| Param | Original file | Final file |
|---|---|---|
| Filename | modeM0/AS1T02_092T01_9000002384_16144cztM0_level2.evt | modeM0/AS1T02_092T01_9000002384_16144cztM0_level2_quad_clean.evt |
| Size (bytes) | 554,506,560 | 99,351,360 |
| Size | 528.8 MB | 94.7 MB |
| Events in quadrant A | 3,728,897 | 644,042 |
| Events in quadrant B | 4,342,657 | 635,949 |
| Events in quadrant C | 3,947,972 | 608,370 |
| Events in quadrant D | 4,264,855 | 598,377 |
| Mode SS | |||
|---|---|---|---|
| Quadrant | BADHDUFLAG | Total packets | Discarded packets |
| A | 0 | 154 | 0 |
| B | 0 | 154 | 0 |
| C | 0 | 154 | 0 |
| D | 0 | 154 | 0 |
| Mode M0 | |||
|---|---|---|---|
| Quadrant | BADHDUFLAG | Total packets | Discarded packets |
| A | 0 | 16265 | 3 |
| B | 0 | 17845 | 2 |
| C | 0 | 16594 | 2 |
| D | 0 | 18039 | 2 |
| Mode M9 | |||
|---|---|---|---|
| Quadrant | BADHDUFLAG | Total packets | Discarded packets |
| A | 0 | 7 | 0 |
| B | 0 | 7 | 0 |
| C | 0 | 7 | 0 |
| D | 0 | 7 | 0 |
| Quadrant | Total seconds | Saturated seconds | Saturation percentage |
|---|---|---|---|
| A | 7501 | 99 | 1.319824% |
| B | 7501 | 192 | 2.559659% |
| C | 7501 | 98 | 1.306492% |
| D | 7501 | 196 | 2.612985% |
Noise dominated data is calculated using 1-second bins in cleaned event files. If a bin has >2000 counts, and if more than 50% of those come from <1% of pixels, then it is considered to be noise-dominated and hence unusable.
| Quadrant | # 1 sec bins | Bins with >0 counts | Bins with >2000 counts | High rate bins dominated by noise | Noise dominated (total time) | Noise dominated (detector-on time) | Marked lightcurve |
|---|---|---|---|---|---|---|---|
| A | 8202 | 7504 | 28 | 28 | 0.34% | 0.37% | 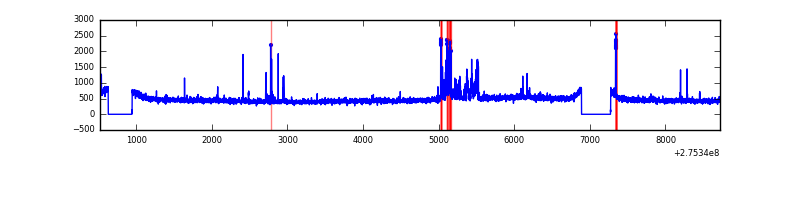 |
| B | 8202 | 7504 | 36 | 36 | 0.44% | 0.48% | 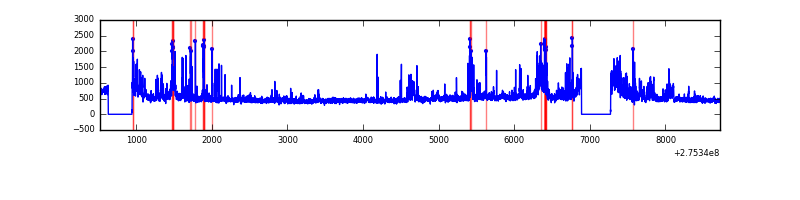 |
| C | 8202 | 7504 | 2 | 2 | 0.02% | 0.03% | 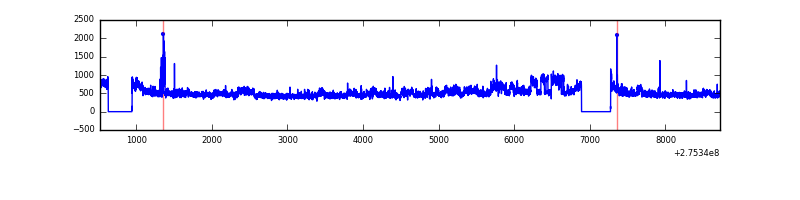 |
| D | 8202 | 7504 | 115 | 115 | 1.40% | 1.53% | 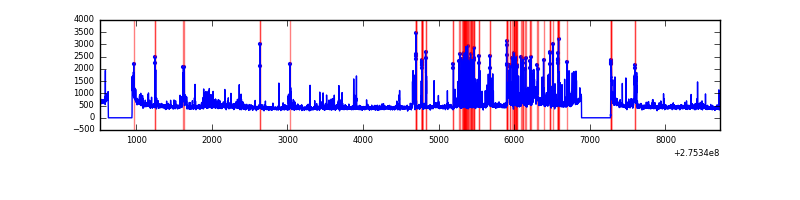 |
Top three noisy pixels from each quadrant. If the there are fewer than three noisy pixels in the level2.evt file, extra rows are filled as -1
| Pixel properties | Quadrant properties | ||||||
|---|---|---|---|---|---|---|---|
| Quadrant | DetID | PixID | Counts | Sigma | Mean | Median | Sigma |
| A | 15 | 174 | 228316 | 1238.55 | 897 | 878 | 183.6 |
| A | 15 | 223 | 20046 | 104.38 | 897 | 878 | 183.6 |
| A | 13 | 248 | 18030 | 93.4 | 897 | 878 | 183.6 |
| B | 0 | 189 | 256456 | 1484.77 | 896 | 874 | 172.1 |
| B | 5 | 65 | 213562 | 1235.58 | 896 | 874 | 172.1 |
| B | 0 | 229 | 99393 | 572.33 | 896 | 874 | 172.1 |
| C | 3 | 233 | 381878 | 1879.78 | 859 | 866 | 202.7 |
| C | 14 | 238 | 130537 | 639.75 | 859 | 866 | 202.7 |
| C | 0 | 207 | 45252 | 218.99 | 859 | 866 | 202.7 |
| D | 1 | 52 | 615556 | 2904.34 | 867 | 844 | 211.7 |
| D | 5 | 222 | 140721 | 660.88 | 867 | 844 | 211.7 |
| D | 10 | 70 | 50102 | 232.73 | 867 | 844 | 211.7 |
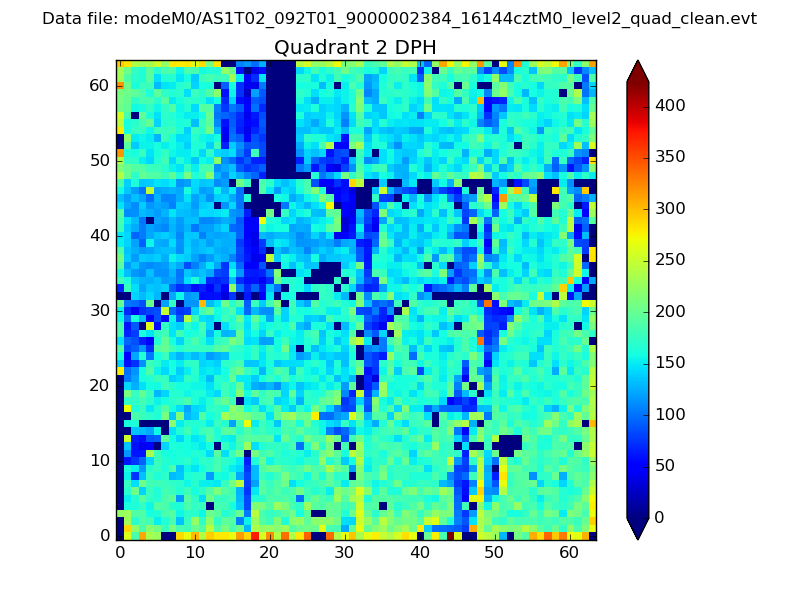
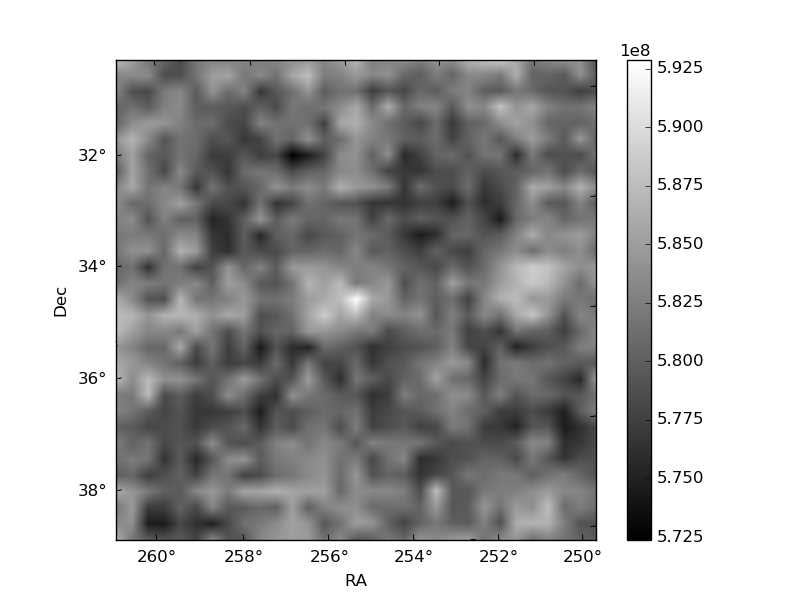
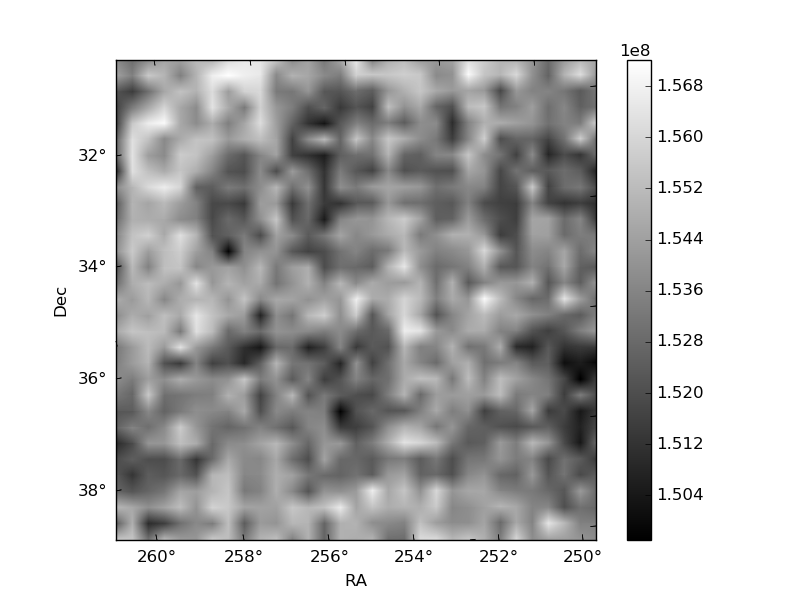
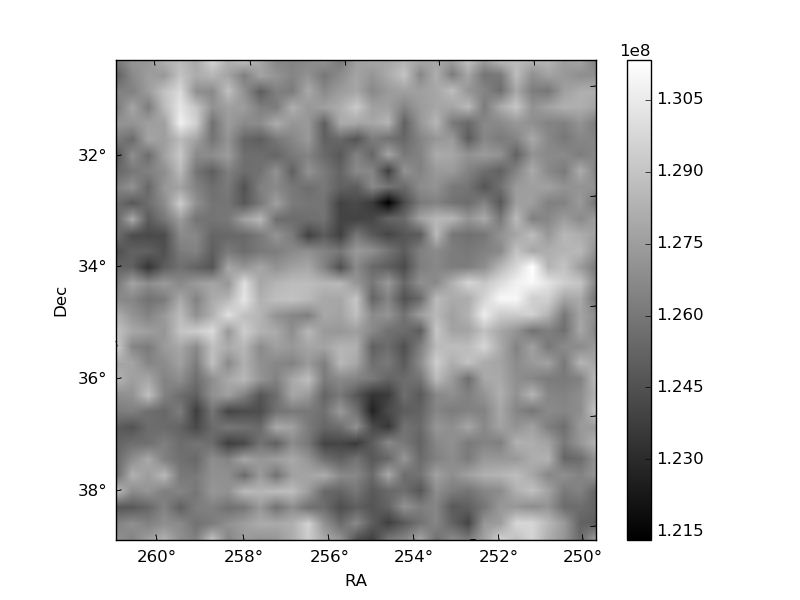
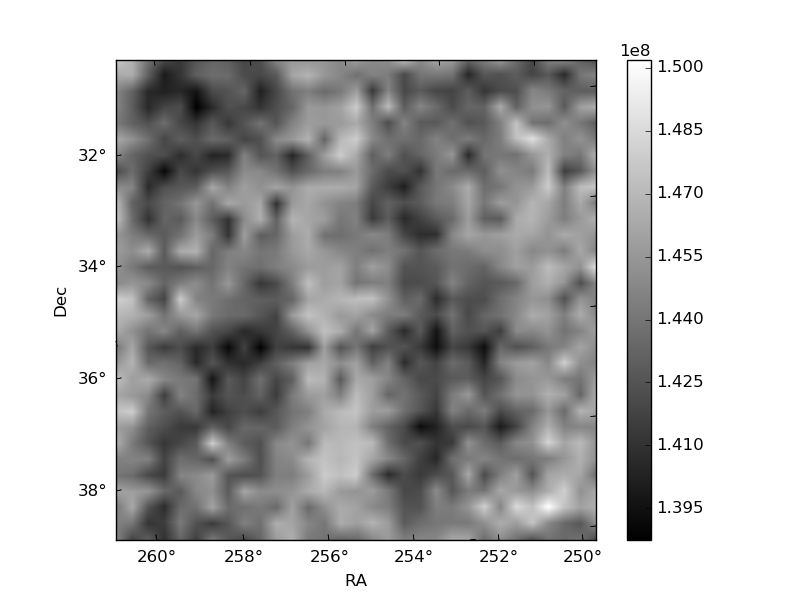
Histogram calculated using DETX and DETY for each event in the final _common_clean file
| Quadrant A | 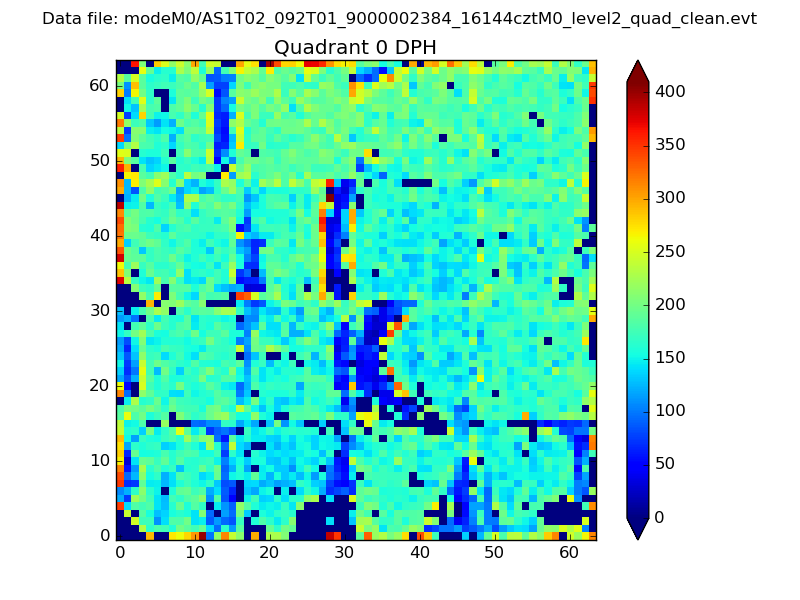 |
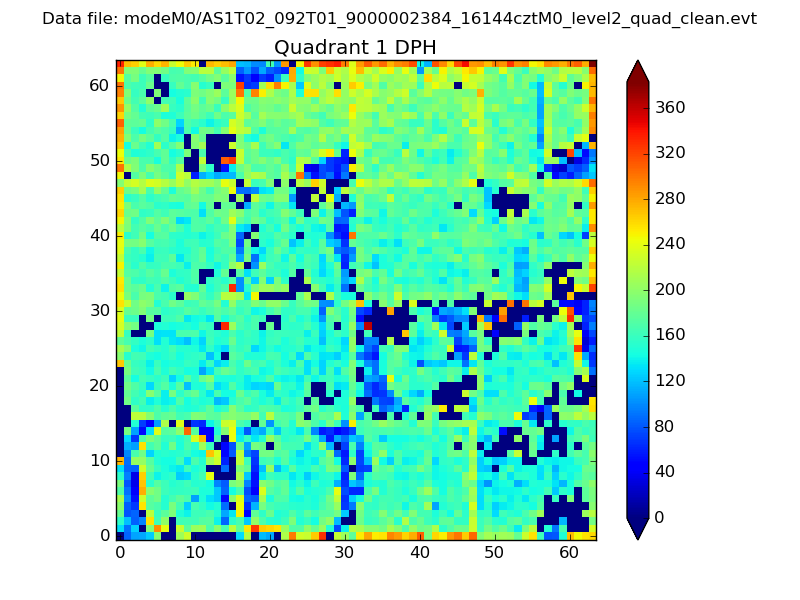 |
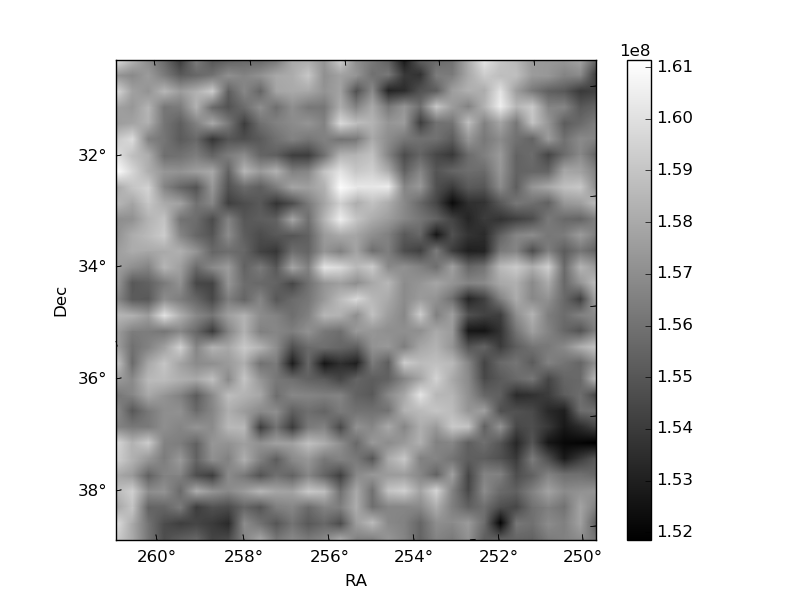
Quadrant B |
|---|---|---|---|
| Quadrant D | 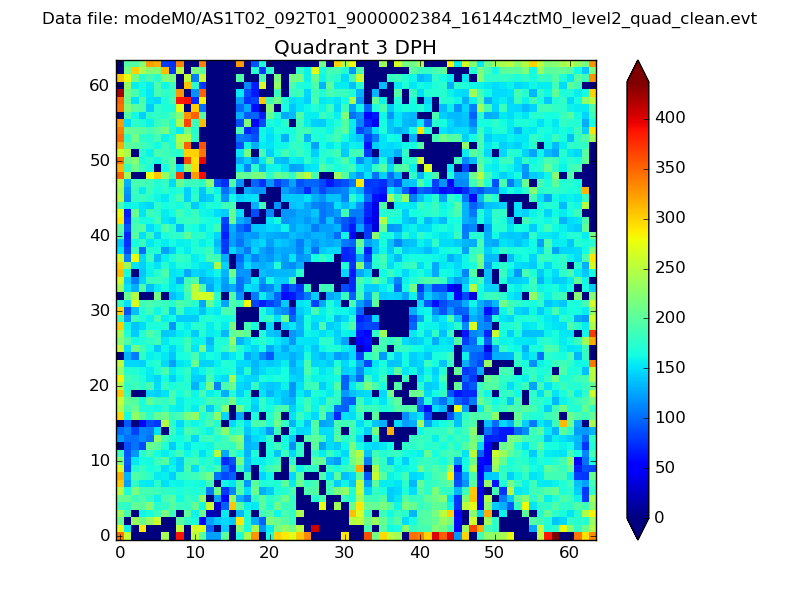 |
 |
Quadrant C |
| Plot type | Count rate plots | Images |
|---|---|---|
| Comparison with Poisson distribution Blue bars denote a histogram of data divided into 1 sec bins. Red curve is a Poisson curve with rate = median count rate of data. |
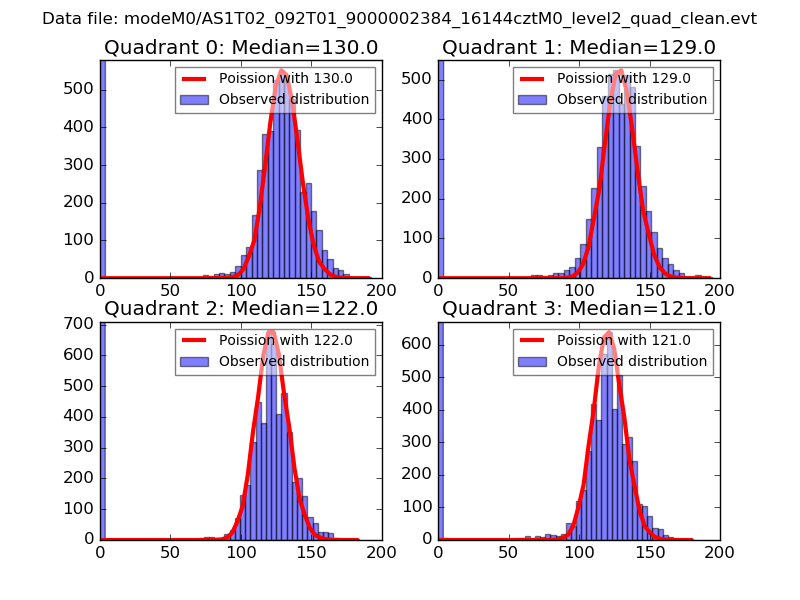 |
 |
| Quadrant-wise count rates Data is divided into 100 sec bins |
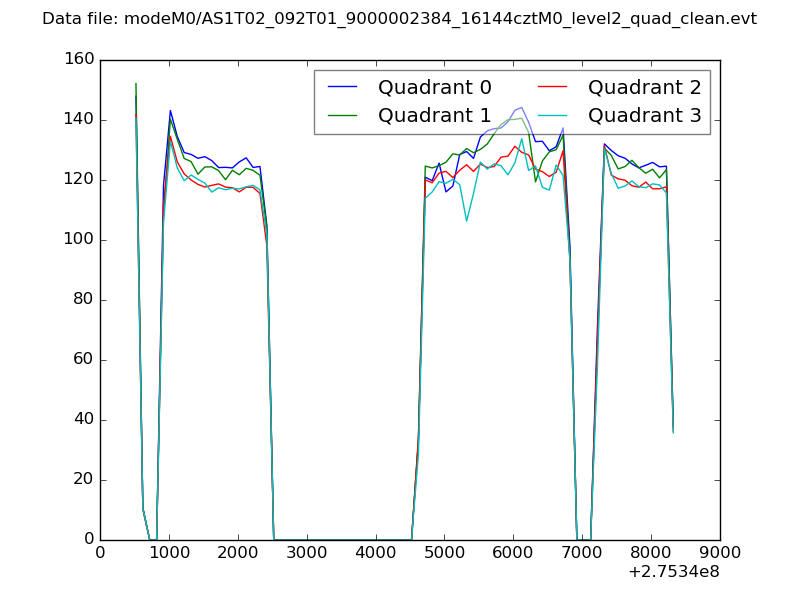 |
|
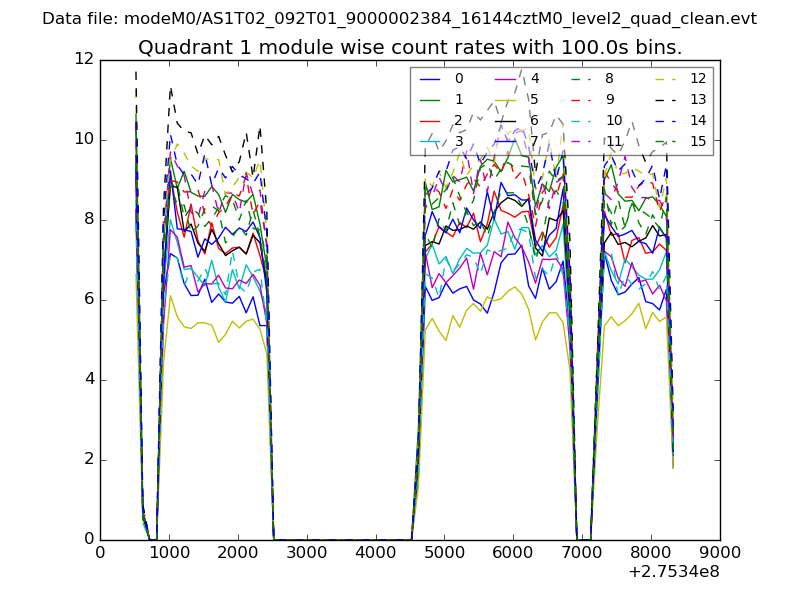
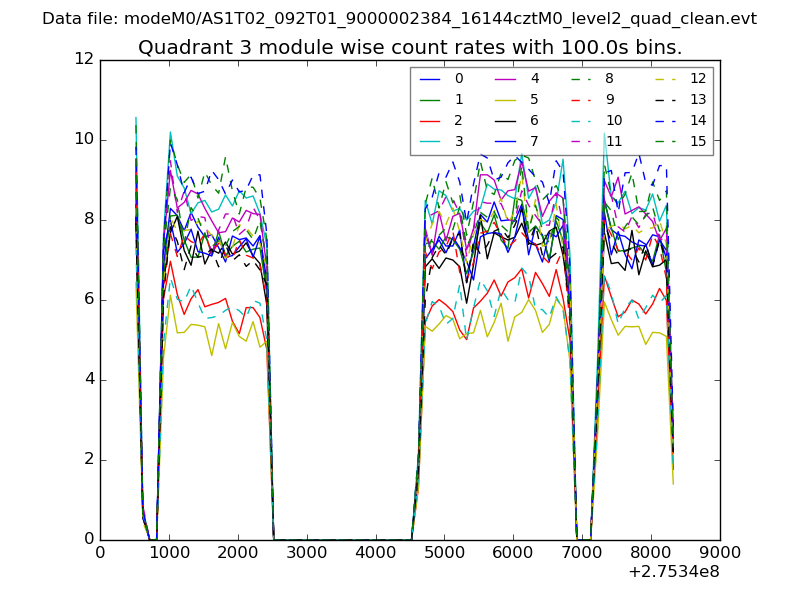
| Module-wise count rates for Quadrant A Data is divided into 100 sec bins |
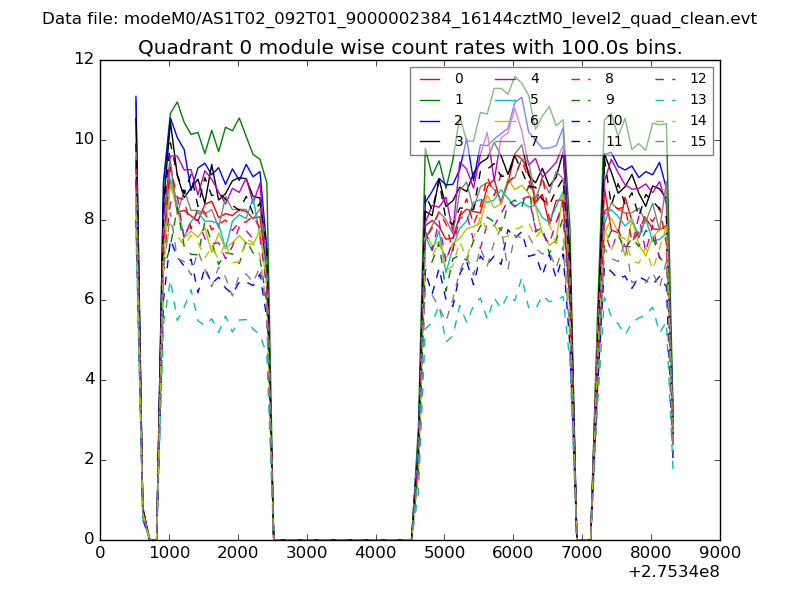 |
 |
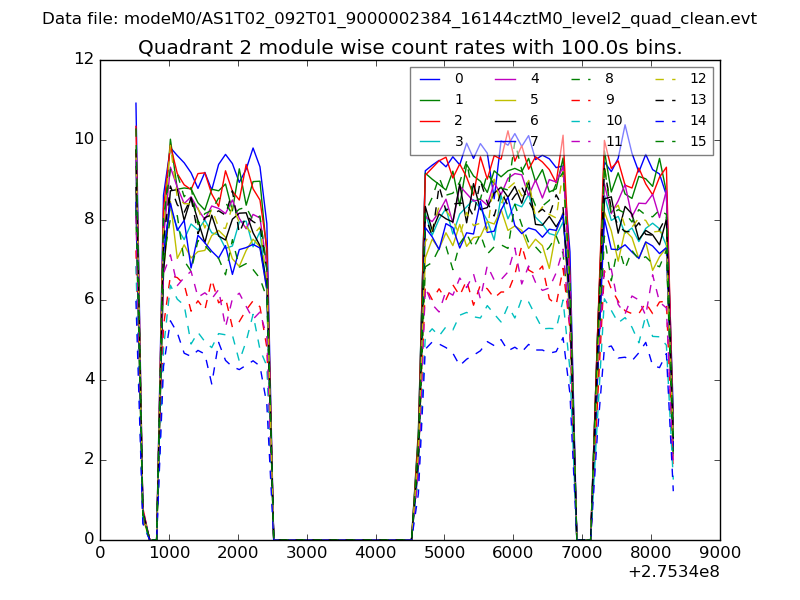
| Module-wise count rates for Quadrant B Data is divided into 100 sec bins |
 |
 |
| Module-wise count rates for Quadrant C Data is divided into 100 sec bins |
 |
 |
| Module-wise count rates for Quadrant D Data is divided into 100 sec bins |
 |
 |
| Parameter | Plot |
|---|---|
| CZT HV Monitor | 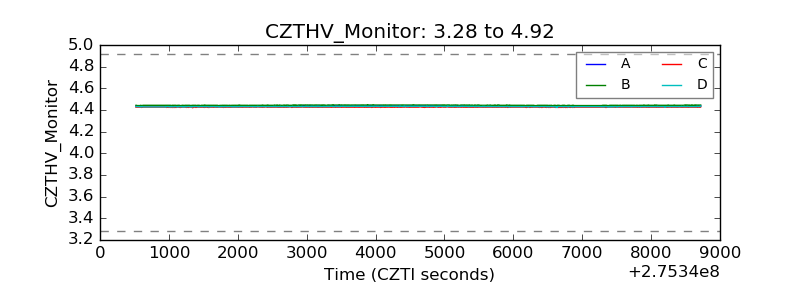 |
| D_VDD | 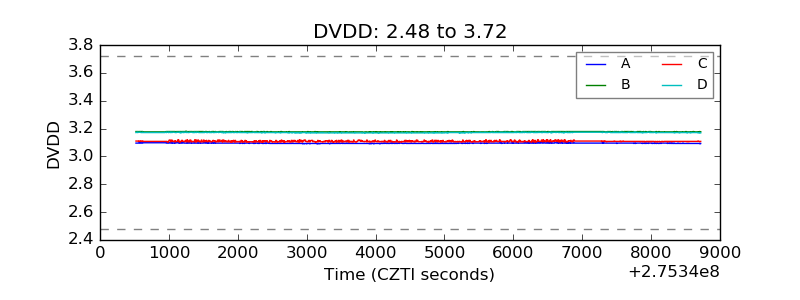 |
| Temperature 1 | 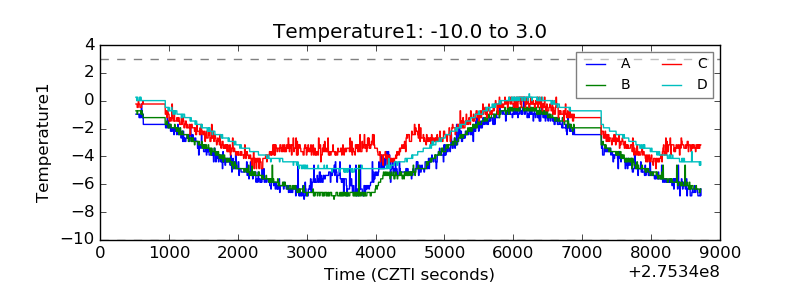 |
| Veto HV Monitor | 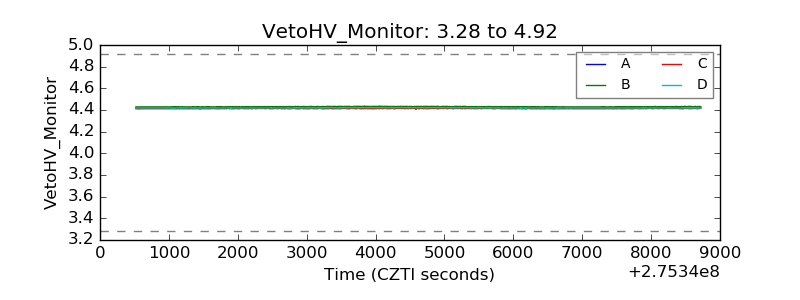 |
| Veto LLD | 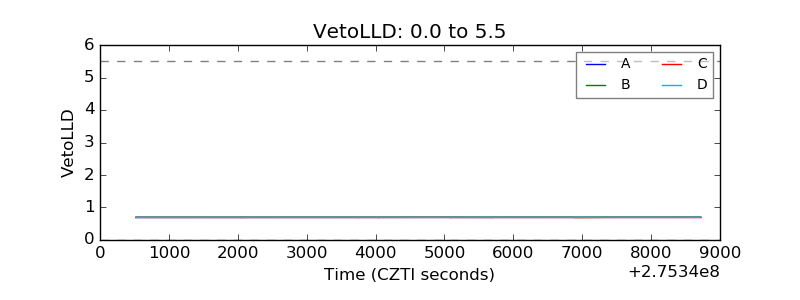 |
| Alpha Counter | 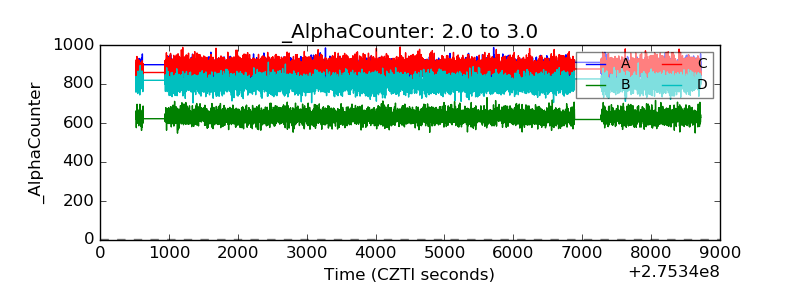 |
| _CPM_Rate | 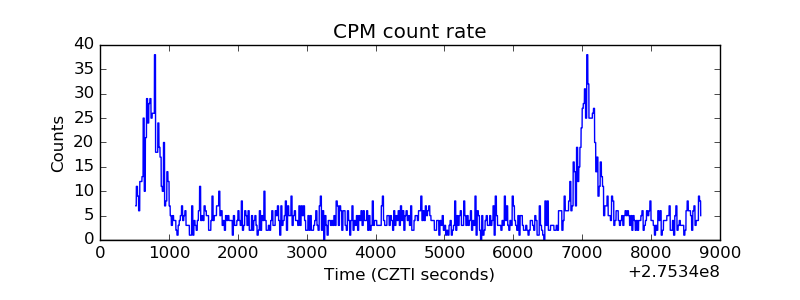 |
| CZT Counter |  |
| +2.5 Volts monitor |  |
| +5 Volts monitor |  |
| _ROLL_ROT | 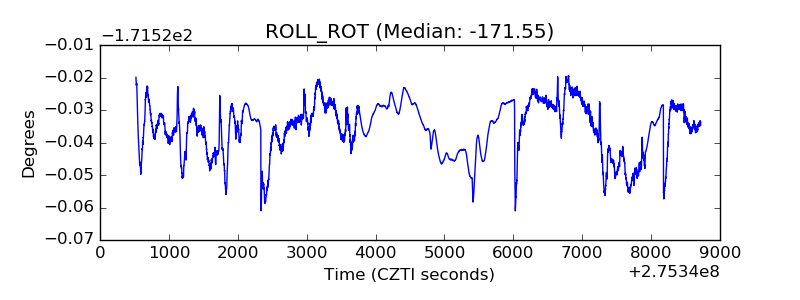 |
| _Roll_DEC | 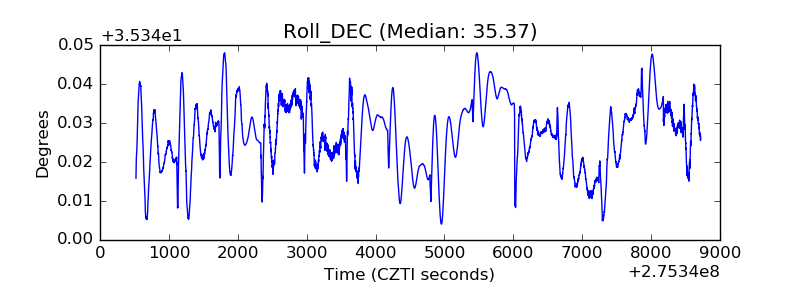 |
| _Roll_RA | 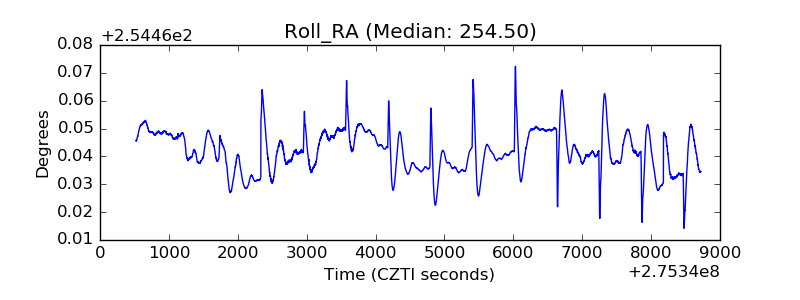 |
| Veto Counter | 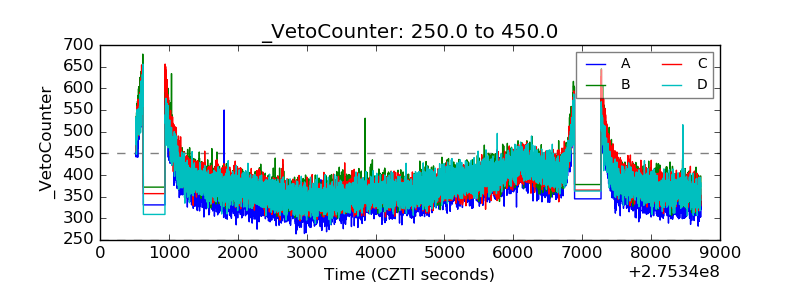 |