| Param | Original file | Final file |
|---|---|---|
| Filename | modeM0/AS1T02_092T01_9000002384_16150cztM0_level2.evt | modeM0/AS1T02_092T01_9000002384_16150cztM0_level2_quad_clean.evt |
| Size (bytes) | 734,748,480 | 127,477,440 |
| Size | 700.7 MB | 121.6 MB |
| Events in quadrant A | 5,327,046 | 803,846 |
| Events in quadrant B | 5,456,978 | 800,152 |
| Events in quadrant C | 5,357,128 | 763,860 |
| Events in quadrant D | 5,390,880 | 756,929 |
| Mode SS | |||
|---|---|---|---|
| Quadrant | BADHDUFLAG | Total packets | Discarded packets |
| A | 0 | 218 | 0 |
| B | 0 | 218 | 0 |
| C | 0 | 218 | 0 |
| D | 0 | 218 | 0 |
| Mode M0 | |||
|---|---|---|---|
| Quadrant | BADHDUFLAG | Total packets | Discarded packets |
| A | 0 | 22951 | 1 |
| B | 0 | 23236 | 1 |
| C | 0 | 22660 | 1 |
| D | 0 | 23520 | 1 |
| Mode M9 | |||
|---|---|---|---|
| Quadrant | BADHDUFLAG | Total packets | Discarded packets |
| A | 0 | 9 | 0 |
| B | 0 | 9 | 0 |
| C | 0 | 9 | 0 |
| D | 0 | 9 | 0 |
| Quadrant | Total seconds | Saturated seconds | Saturation percentage |
|---|---|---|---|
| A | 10619 | 78 | 0.734532% |
| B | 10619 | 68 | 0.640362% |
| C | 10619 | 86 | 0.809869% |
| D | 10619 | 163 | 1.534984% |
Noise dominated data is calculated using 1-second bins in cleaned event files. If a bin has >2000 counts, and if more than 50% of those come from <1% of pixels, then it is considered to be noise-dominated and hence unusable.
| Quadrant | # 1 sec bins | Bins with >0 counts | Bins with >2000 counts | High rate bins dominated by noise | Noise dominated (total time) | Noise dominated (detector-on time) | Marked lightcurve |
|---|---|---|---|---|---|---|---|
| A | 11130 | 10621 | 21 | 21 | 0.19% | 0.20% | 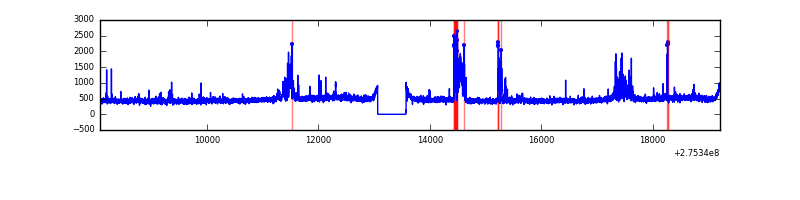 |
| B | 11130 | 10621 | 7 | 7 | 0.06% | 0.07% | 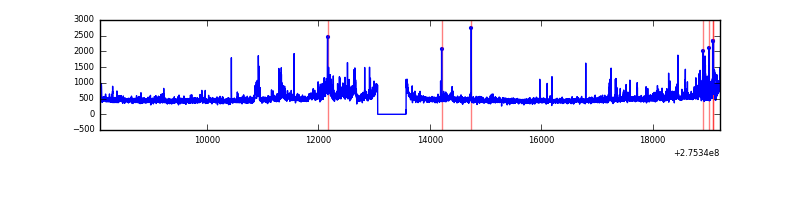 |
| C | 11130 | 10621 | 0 | 0 | 0.00% | 0.00% | 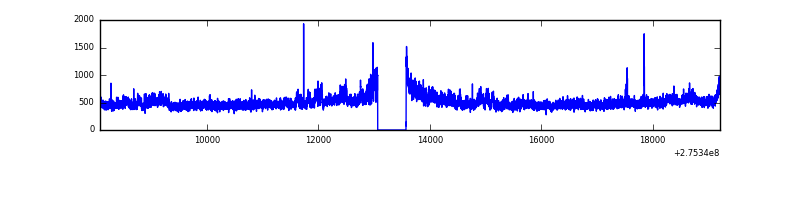 |
| D | 11130 | 10621 | 106 | 106 | 0.95% | 1.00% | 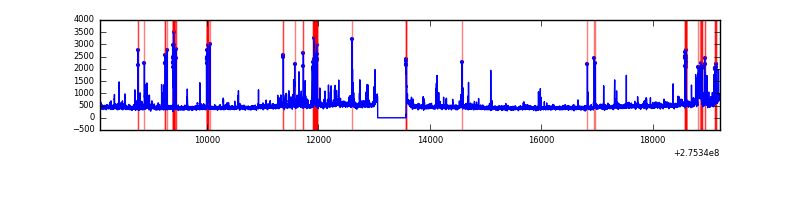 |
Top three noisy pixels from each quadrant. If the there are fewer than three noisy pixels in the level2.evt file, extra rows are filled as -1
| Pixel properties | Quadrant properties | ||||||
|---|---|---|---|---|---|---|---|
| Quadrant | DetID | PixID | Counts | Sigma | Mean | Median | Sigma |
| A | 15 | 174 | 469377 | 1863.01 | 1251 | 1226 | 251.3 |
| A | 0 | 253 | 18353 | 68.16 | 1251 | 1226 | 251.3 |
| A | 0 | 226 | 11023 | 38.99 | 1251 | 1226 | 251.3 |
| B | 5 | 65 | 127332 | 522.03 | 1248 | 1217 | 241.6 |
| B | 0 | 189 | 107688 | 440.71 | 1248 | 1217 | 241.6 |
| B | 4 | 216 | 74750 | 304.37 | 1248 | 1217 | 241.6 |
| C | 3 | 233 | 453394 | 1609.27 | 1193 | 1200 | 281.0 |
| C | 14 | 238 | 181812 | 642.76 | 1193 | 1200 | 281.0 |
| C | 3 | 9 | 37536 | 129.31 | 1193 | 1200 | 281.0 |
| D | 1 | 52 | 422733 | 1420.03 | 1213 | 1175 | 296.9 |
| D | 7 | 38 | 199695 | 668.72 | 1213 | 1175 | 296.9 |
| D | 13 | 168 | 63402 | 209.61 | 1213 | 1175 | 296.9 |
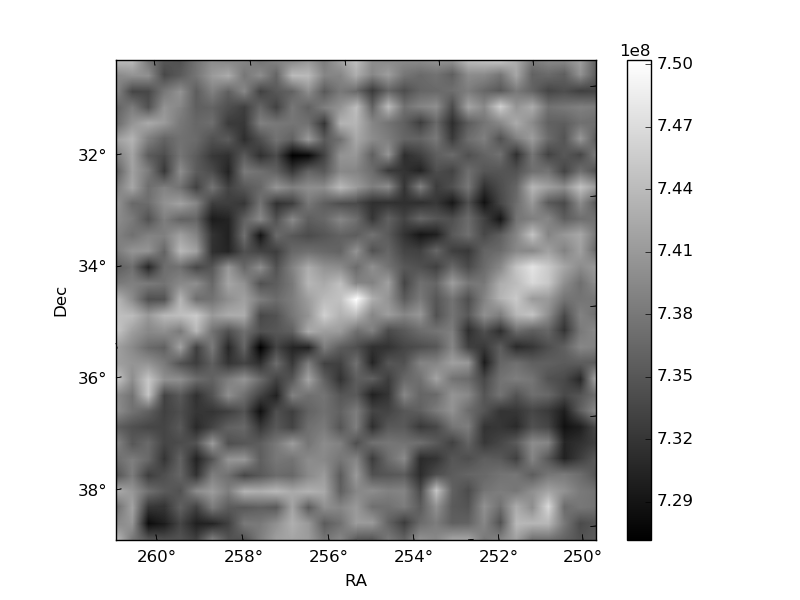
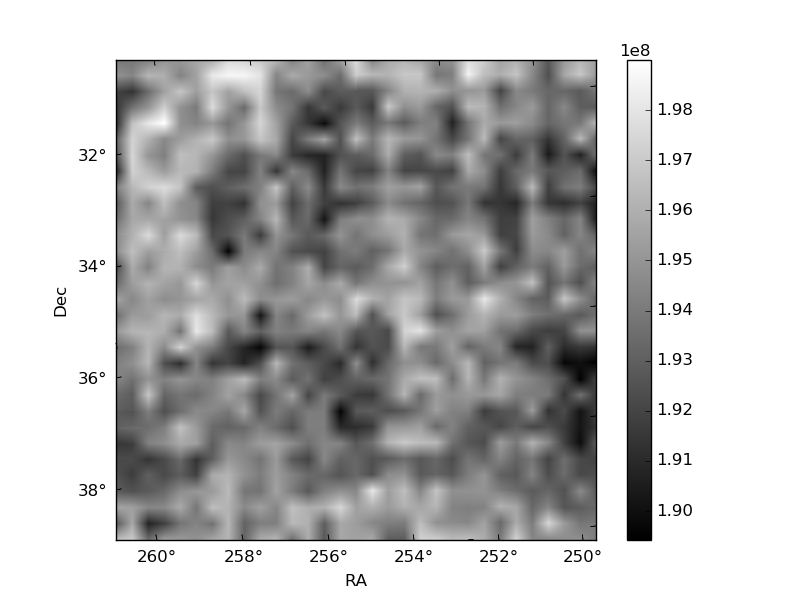
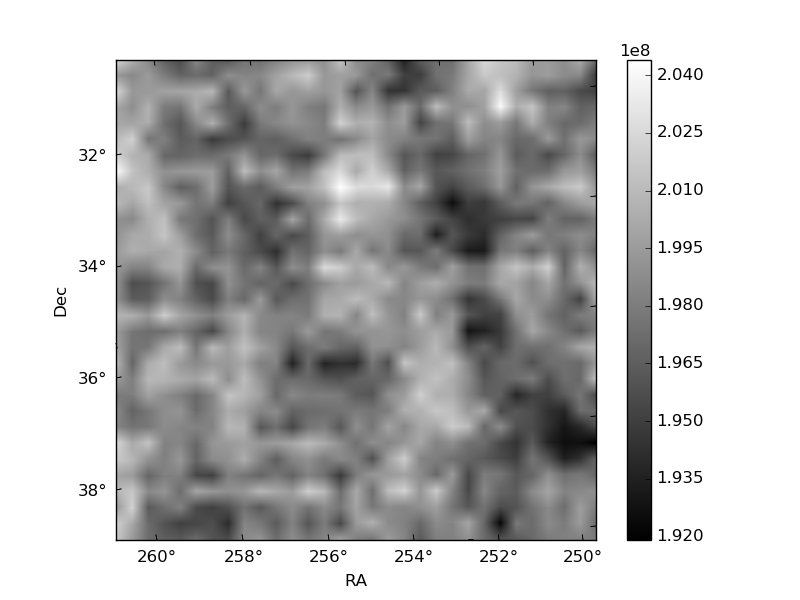
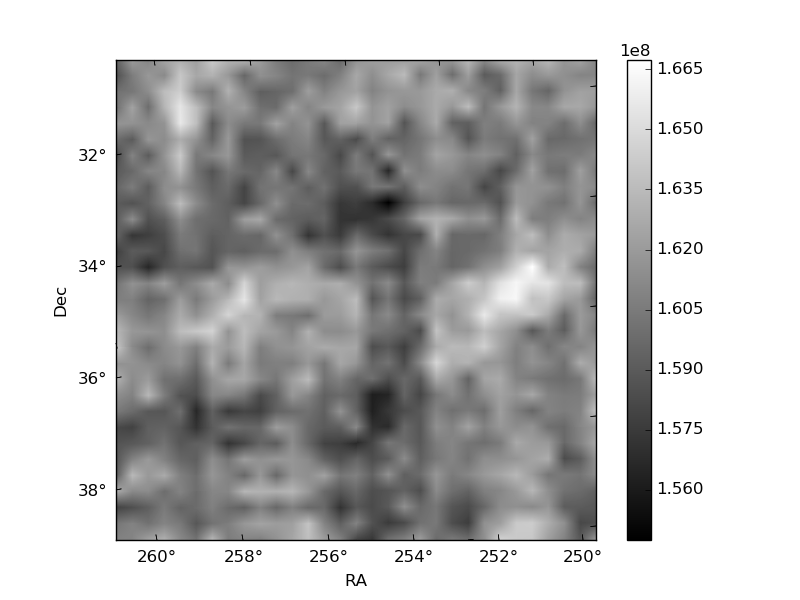
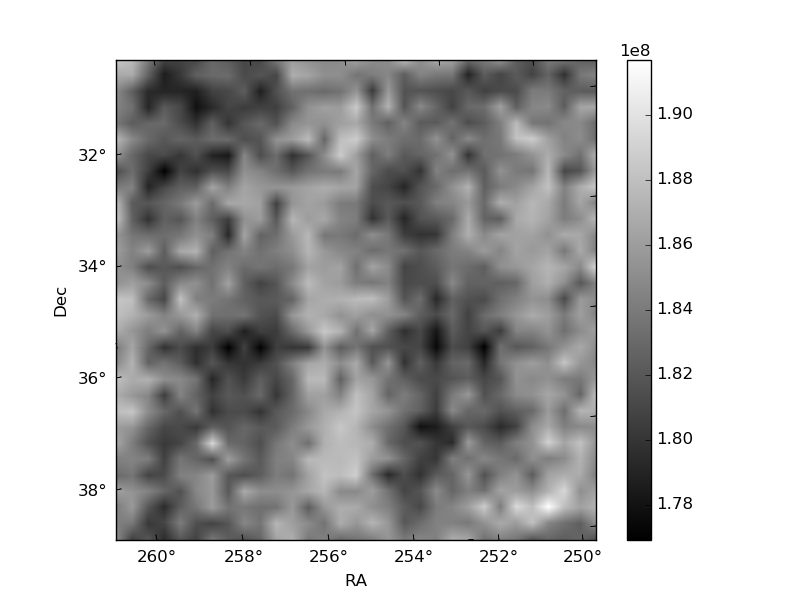
Histogram calculated using DETX and DETY for each event in the final _common_clean file
| Quadrant A | 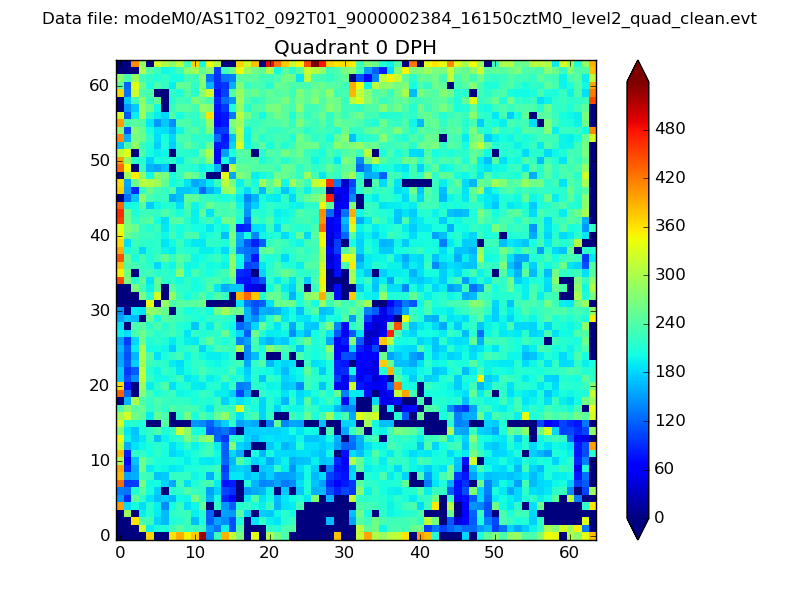 |
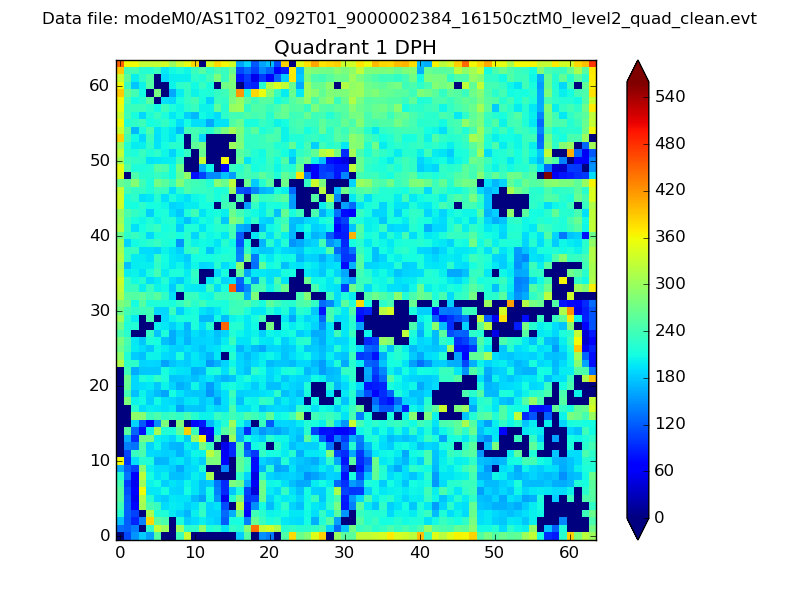 |
Quadrant B |
|---|---|---|---|
| Quadrant D | 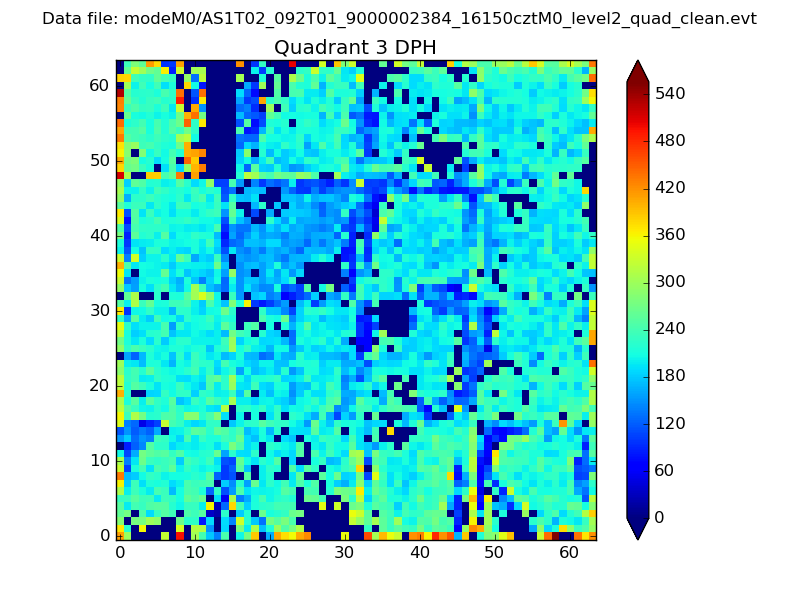 |
 |
Quadrant C |
| Plot type | Count rate plots | Images |
|---|---|---|
| Comparison with Poisson distribution Blue bars denote a histogram of data divided into 1 sec bins. Red curve is a Poisson curve with rate = median count rate of data. |
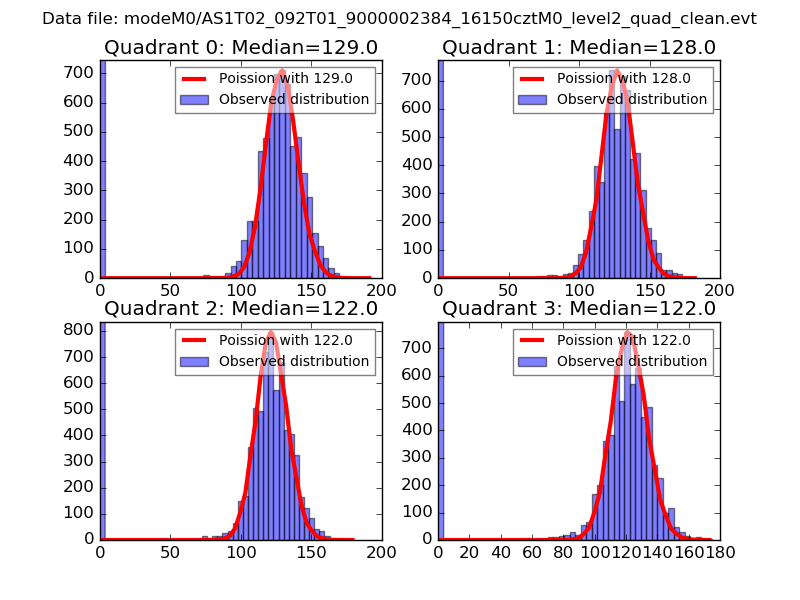 |
 |
| Quadrant-wise count rates Data is divided into 100 sec bins |
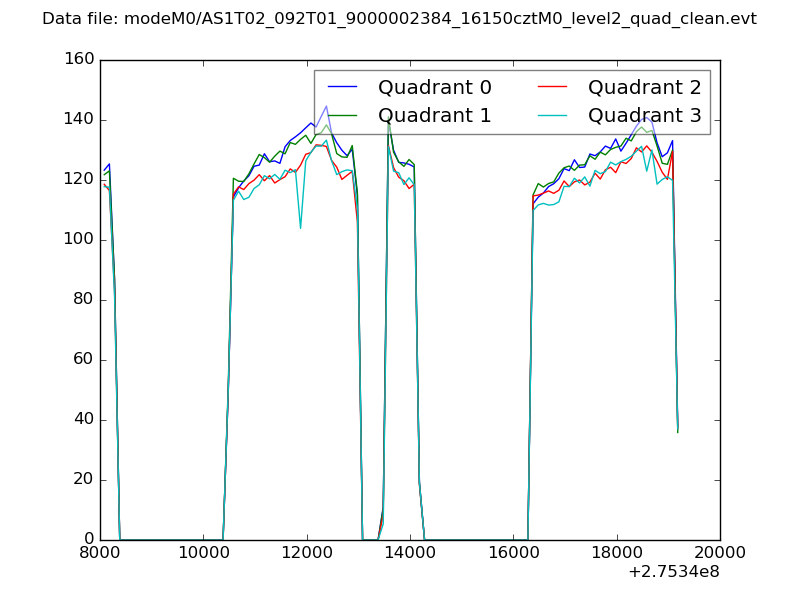 |
|
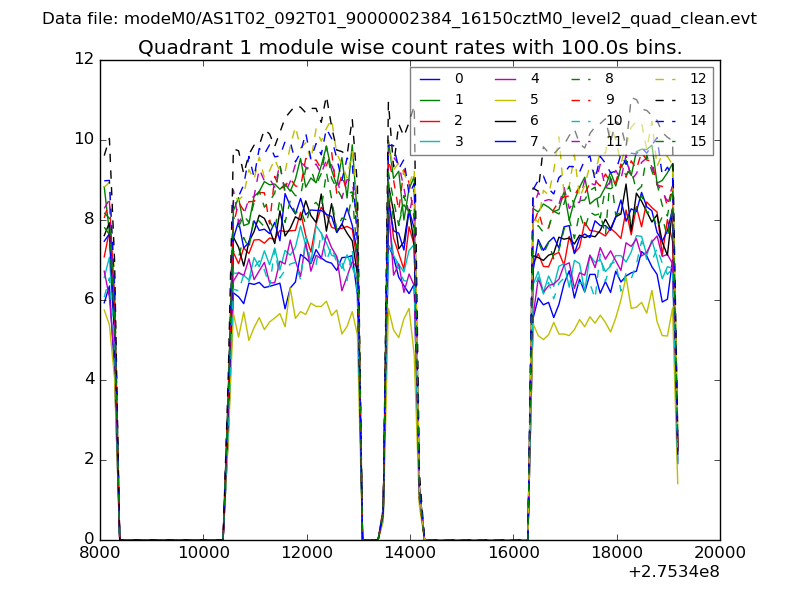
| Module-wise count rates for Quadrant A Data is divided into 100 sec bins |
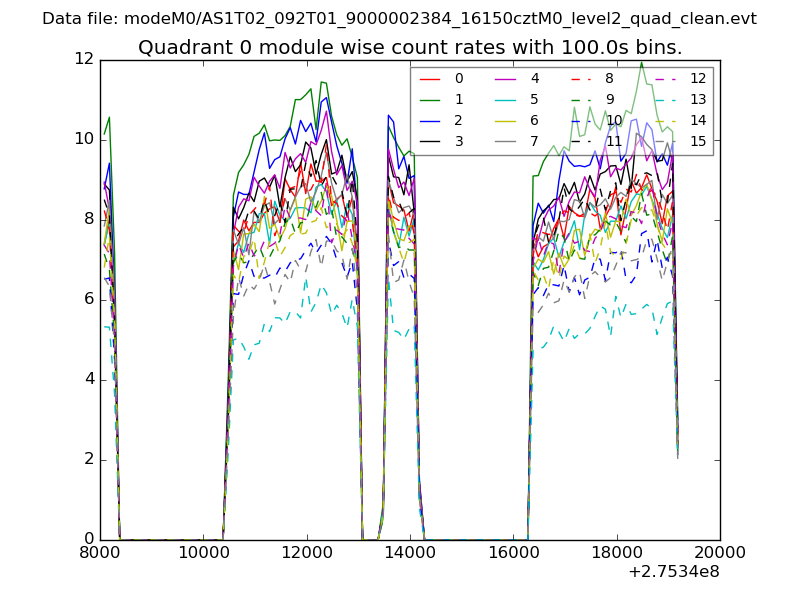 |
 |
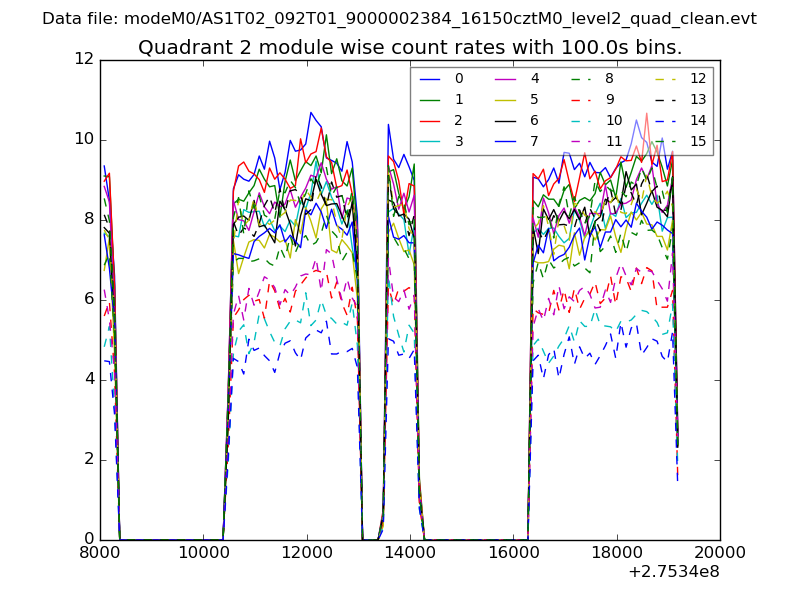
| Module-wise count rates for Quadrant B Data is divided into 100 sec bins |
 |
 |
| Module-wise count rates for Quadrant C Data is divided into 100 sec bins |
 |
 |
| Module-wise count rates for Quadrant D Data is divided into 100 sec bins |
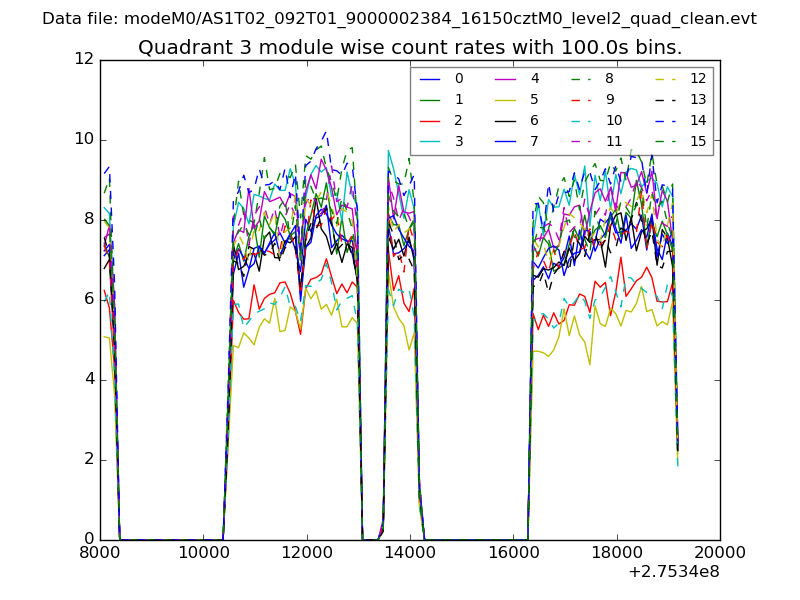 |
 |
| Parameter | Plot |
|---|---|
| CZT HV Monitor | 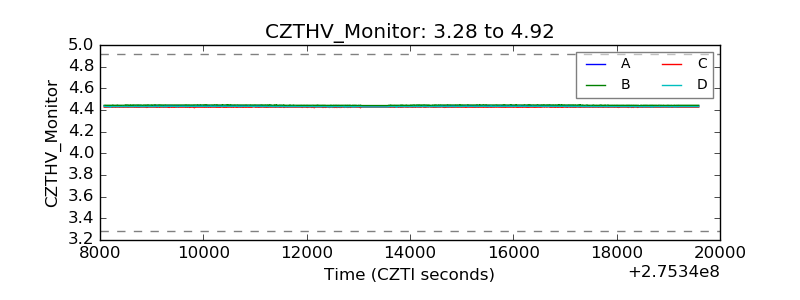 |
| D_VDD | 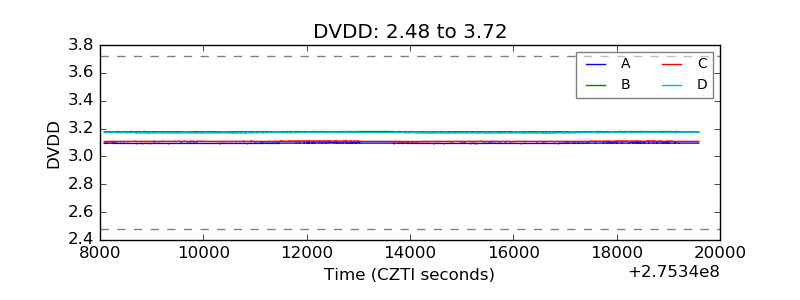 |
| Temperature 1 | 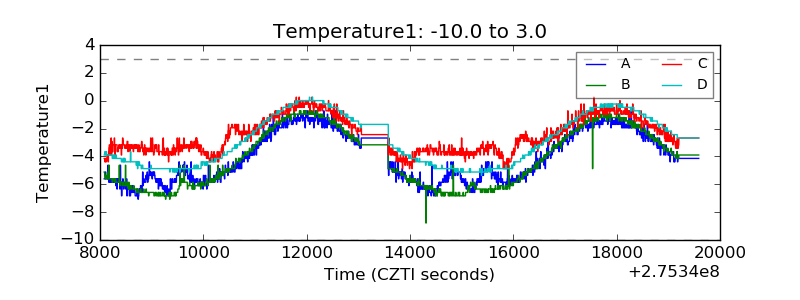 |
| Veto HV Monitor | 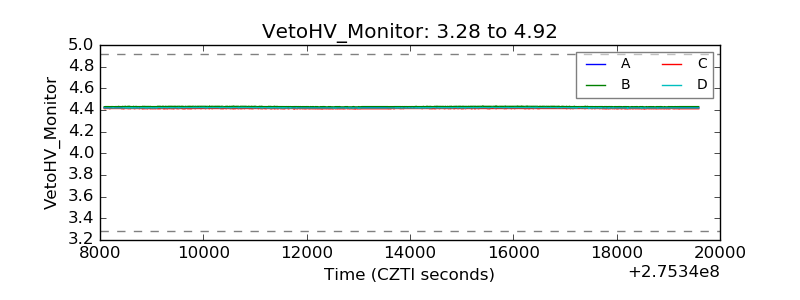 |
| Veto LLD | 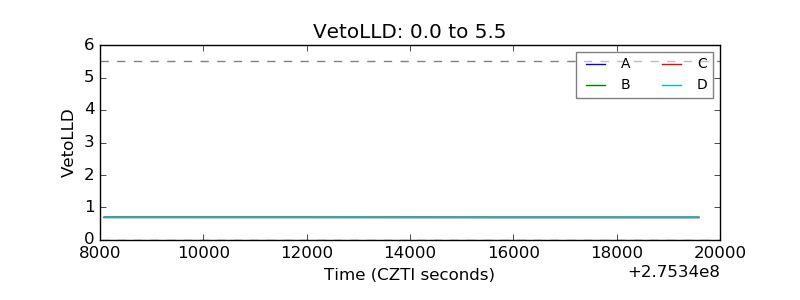 |
| Alpha Counter | 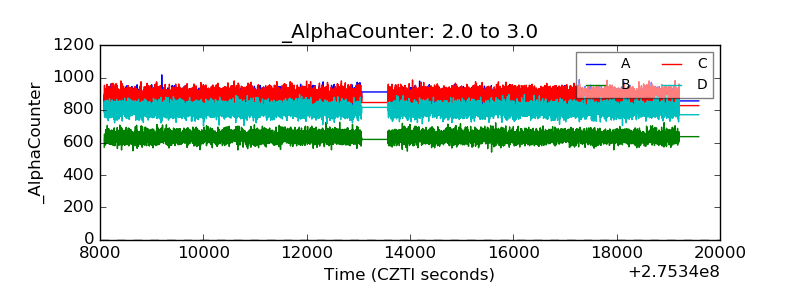 |
| _CPM_Rate | 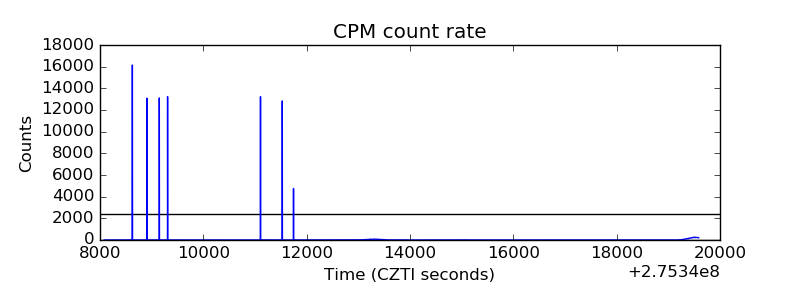 |
| CZT Counter |  |
| +2.5 Volts monitor |  |
| +5 Volts monitor |  |
| _ROLL_ROT | 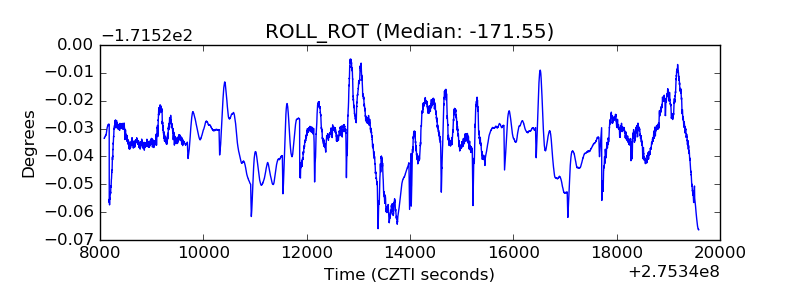 |
| _Roll_DEC | 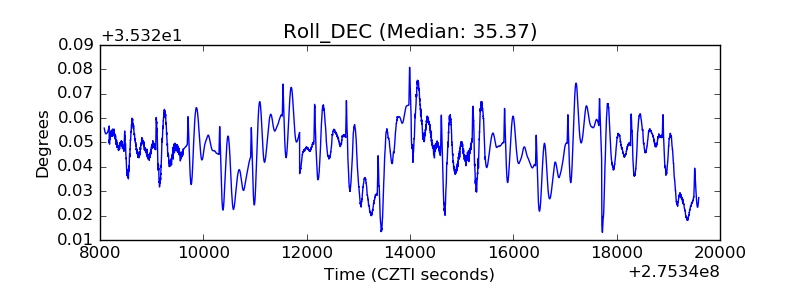 |
| _Roll_RA | 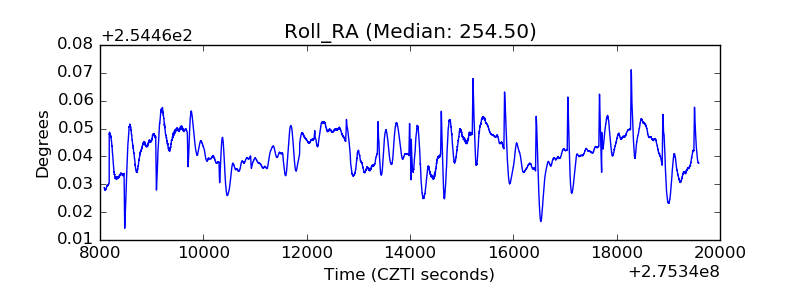 |
| Veto Counter | 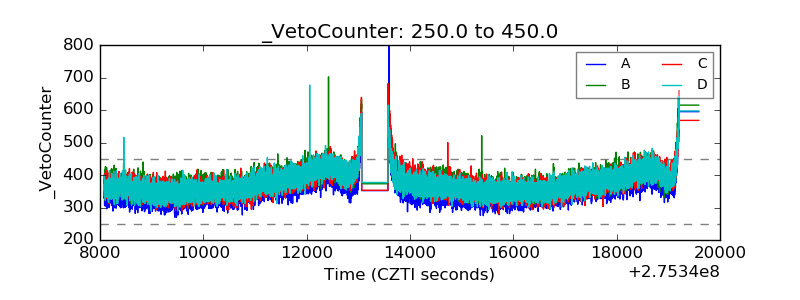 |