| Param | Original file | Final file |
|---|---|---|
| Filename | modeM0/AS1T02_109T01_9000002386cztM0_level2.fits | modeM0/AS1T02_109T01_9000002386cztM0_level2_quad_clean.evt |
| Size (bytes) | 3,045,314,880 | 2,648,759,040 |
| Size | 2.8 GB | 2.5 GB |
| Events in quadrant A | 18,723,310 | 15,259,036 |
| Events in quadrant B | 18,004,038 | 15,612,305 |
| Events in quadrant C | 18,326,834 | 14,775,719 |
| Events in quadrant D | 15,829,038 | 13,237,115 |
| Mode M0 | |||
|---|---|---|---|
| Quadrant | BADHDUFLAG | Total packets | Discarded packets |
| A | 0 | 721782 | 0 |
| B | 0 | 677146 | 0 |
| C | 0 | 688627 | 0 |
| D | 0 | 828990 | 0 |
| Mode SS | |||
|---|---|---|---|
| Quadrant | BADHDUFLAG | Total packets | Discarded packets |
| A | 0 | 6351 | 0 |
| B | 0 | 6377 | 0 |
| C | 0 | 5607 | 0 |
| D | 0 | 6372 | 0 |
| Mode M9 | |||
|---|---|---|---|
| Quadrant | BADHDUFLAG | Total packets | Discarded packets |
| A | 0 | 519 | 0 |
| B | 0 | 515 | 0 |
| C | 0 | 520 | 0 |
| D | 0 | 520 | 0 |
| Quadrant | Total seconds | Saturated seconds | Saturation percentage |
|---|---|---|---|
| A | 312221 | 9460 | 3.029905% |
| B | 312205 | 4662 | 1.493250% |
| C | 312186 | 6431 | 2.059990% |
| D | 311672 | 16415 | 5.266755% |
Noise dominated data is calculated using 1-second bins in cleaned event files. If a bin has >2000 counts, and if more than 50% of those come from <1% of pixels, then it is considered to be noise-dominated and hence unusable.
| Quadrant | # 1 sec bins | Bins with >0 counts | Bins with >2000 counts | High rate bins dominated by noise | Noise dominated (total time) | Noise dominated (detector-on time) | Marked lightcurve |
|---|---|---|---|---|---|---|---|
| A | 396706 | 313744 | 0 | 0 | 0.00% | 0.00% |  |
| B | 396706 | 313728 | 0 | 0 | 0.00% | 0.00% | 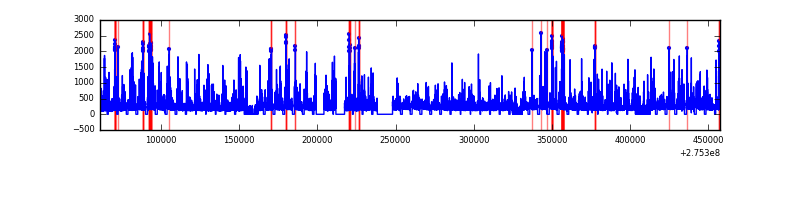 |
| C | 396705 | 313783 | 0 | 0 | 0.00% | 0.00% |  |
| D | 396706 | 312686 | 0 | 0 | 0.00% | 0.00% |  |
Top three noisy pixels from each quadrant. If the there are fewer than three noisy pixels in the level2.evt file, extra rows are filled as -1
| Pixel properties | Quadrant properties | ||||||
|---|---|---|---|---|---|---|---|
| Quadrant | DetID | PixID | Counts | Sigma | Mean | Median | Sigma |
| A | 0 | 29 | 17648 | 11.13 | 4871 | 4573 | 1174.7 |
| A | 7 | 110 | 14963 | 8.84 | 4871 | 4573 | 1174.7 |
| A | 0 | 30 | 14071 | 8.09 | 4871 | 4573 | 1174.7 |
| B | 2 | 9 | 14755 | 11.02 | 4771 | 4554 | 926.0 |
| B | 2 | 8 | 12256 | 8.32 | 4771 | 4554 | 926.0 |
| B | 5 | 128 | 11757 | 7.78 | 4771 | 4554 | 926.0 |
| C | 1 | 80 | 13810 | 7.57 | 4840 | 4507 | 1229.6 |
| C | 1 | 81 | 13466 | 7.29 | 4840 | 4507 | 1229.6 |
| C | 12 | 241 | 12729 | 6.69 | 4840 | 4507 | 1229.6 |
| D | 3 | 14 | 11653 | 6.33 | 4520 | 4116 | 1189.9 |
| D | 6 | 231 | 11415 | 6.13 | 4520 | 4116 | 1189.9 |
| D | 6 | 67 | 11138 | 5.9 | 4520 | 4116 | 1189.9 |
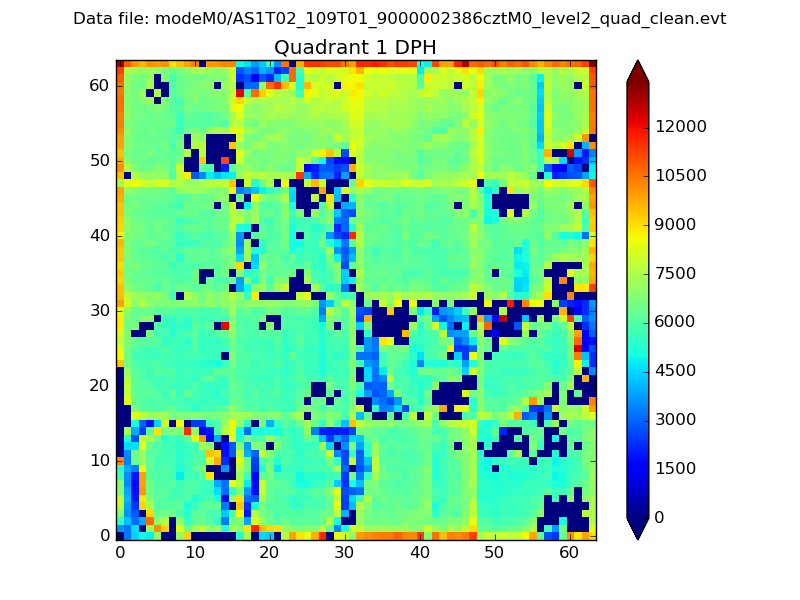
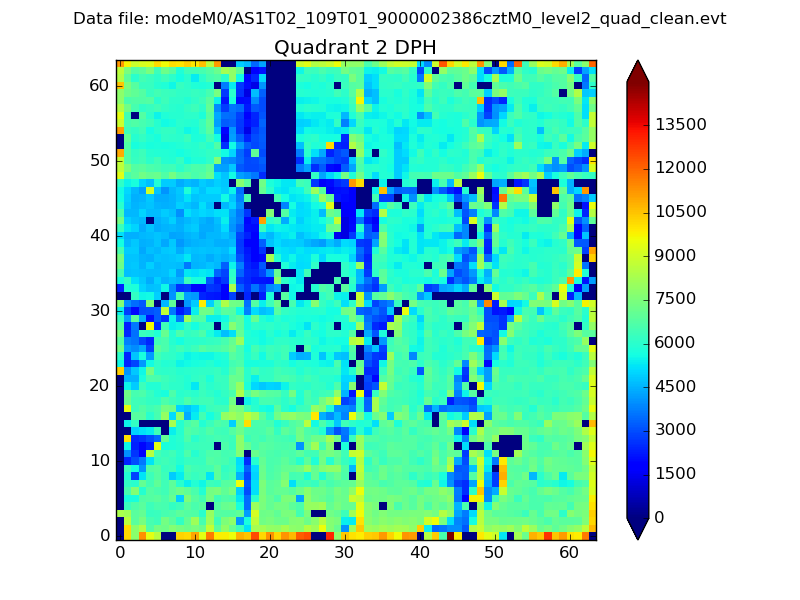
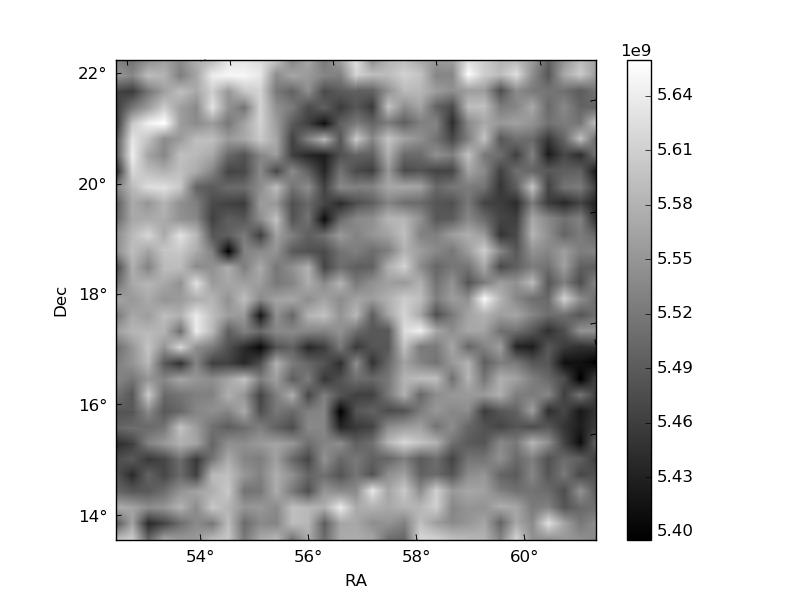
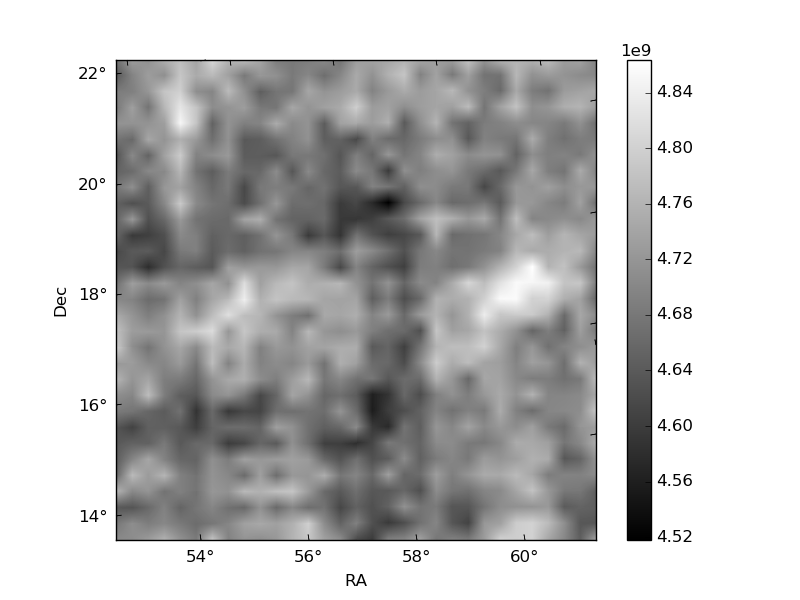
Histogram calculated using DETX and DETY for each event in the final _common_clean file
| Quadrant A |  |
 |
Quadrant B |
|---|---|---|---|
| Quadrant D | 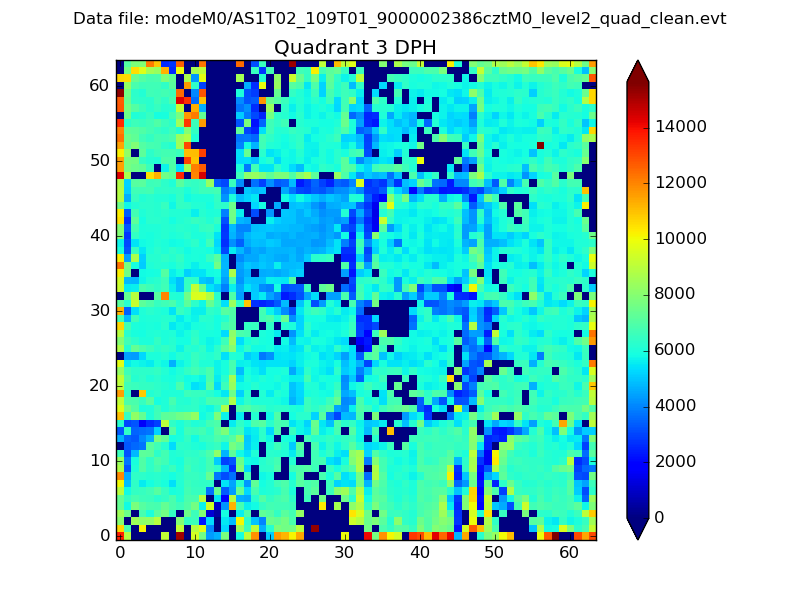 |
 |
Quadrant C |
| Plot type | Count rate plots | Images |
|---|---|---|
| Comparison with Poisson distribution Blue bars denote a histogram of data divided into 1 sec bins. Red curve is a Poisson curve with rate = median count rate of data. |
 |
 |
| Quadrant-wise count rates Data is divided into 100 sec bins |
 |
|
| Module-wise count rates for Quadrant A Data is divided into 100 sec bins |
 |
 |
| Module-wise count rates for Quadrant B Data is divided into 100 sec bins |
 |
 |
| Module-wise count rates for Quadrant C Data is divided into 100 sec bins |
 |
 |
| Module-wise count rates for Quadrant D Data is divided into 100 sec bins |
 |
 |
| Parameter | Plot |
|---|---|
| CZT HV Monitor |  |
| D_VDD |  |
| Temperature 1 |  |
| Veto HV Monitor |  |
| Veto LLD |  |
| Alpha Counter |  |
| _CPM_Rate |  |
| CZT Counter |  |
| +2.5 Volts monitor |  |
| +5 Volts monitor |  |
| _ROLL_ROT |  |
| _Roll_DEC |  |
| _Roll_RA |  |
| Veto Counter |  |