| Param | Original file | Final file |
|---|---|---|
| Filename | modeM0/AS1T02_109T01_9000002386_16151cztM0_level2.evt | modeM0/AS1T02_109T01_9000002386_16151cztM0_level2_quad_clean.evt |
| Size (bytes) | 505,252,800 | 73,180,800 |
| Size | 481.8 MB | 69.8 MB |
| Events in quadrant A | 3,946,069 | 455,842 |
| Events in quadrant B | 3,250,831 | 468,438 |
| Events in quadrant C | 3,196,812 | 445,067 |
| Events in quadrant D | 4,502,141 | 428,522 |
| Mode M0 | |||
|---|---|---|---|
| Quadrant | BADHDUFLAG | Total packets | Discarded packets |
| A | 0 | 15633 | 2 |
| B | 0 | 13229 | 1 |
| C | 0 | 13087 | 1 |
| D | 0 | 17241 | 1 |
| Mode SS | |||
|---|---|---|---|
| Quadrant | BADHDUFLAG | Total packets | Discarded packets |
| A | 0 | 120 | 0 |
| B | 0 | 120 | 0 |
| C | 0 | 120 | 0 |
| D | 0 | 120 | 0 |
| Mode M9 | |||
|---|---|---|---|
| Quadrant | BADHDUFLAG | Total packets | Discarded packets |
| A | 0 | 12 | 0 |
| B | 0 | 12 | 0 |
| C | 0 | 12 | 0 |
| D | 0 | 12 | 0 |
| Quadrant | Total seconds | Saturated seconds | Saturation percentage |
|---|---|---|---|
| A | 5988 | 164 | 2.738811% |
| B | 5988 | 55 | 0.918504% |
| C | 5988 | 35 | 0.584502% |
| D | 5988 | 353 | 5.895124% |
Noise dominated data is calculated using 1-second bins in cleaned event files. If a bin has >2000 counts, and if more than 50% of those come from <1% of pixels, then it is considered to be noise-dominated and hence unusable.
| Quadrant | # 1 sec bins | Bins with >0 counts | Bins with >2000 counts | High rate bins dominated by noise | Noise dominated (total time) | Noise dominated (detector-on time) | Marked lightcurve |
|---|---|---|---|---|---|---|---|
| A | 7184 | 5990 | 106 | 106 | 1.48% | 1.77% | 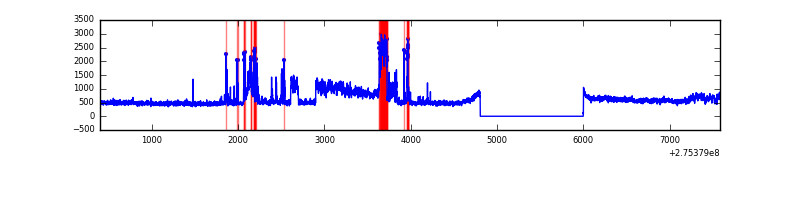 |
| B | 7184 | 5990 | 11 | 11 | 0.15% | 0.18% | 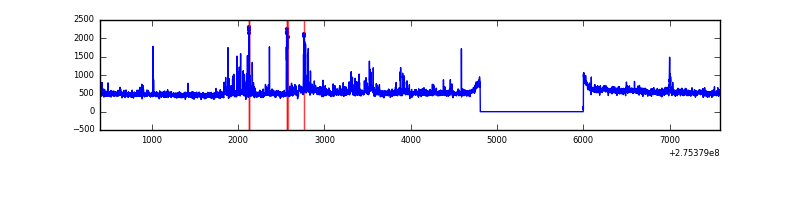 |
| C | 7184 | 5990 | 0 | 0 | 0.00% | 0.00% | 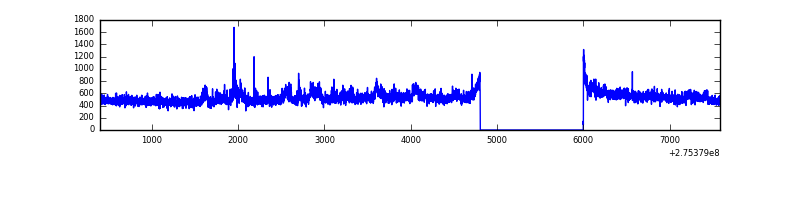 |
| D | 7184 | 5990 | 307 | 307 | 4.27% | 5.13% | 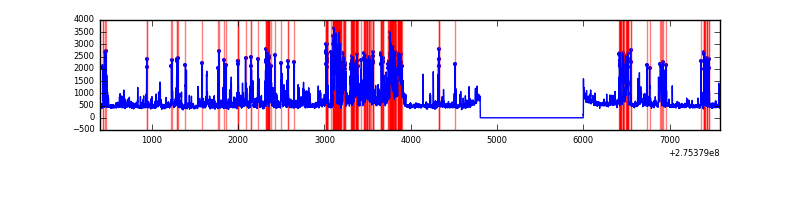 |
Top three noisy pixels from each quadrant. If the there are fewer than three noisy pixels in the level2.evt file, extra rows are filled as -1
| Pixel properties | Quadrant properties | ||||||
|---|---|---|---|---|---|---|---|
| Quadrant | DetID | PixID | Counts | Sigma | Mean | Median | Sigma |
| A | 0 | 253 | 537615 | 3530.08 | 759 | 745 | 152.1 |
| A | 15 | 174 | 481303 | 3159.81 | 759 | 745 | 152.1 |
| A | 0 | 226 | 6850 | 40.14 | 759 | 745 | 152.1 |
| B | 5 | 65 | 149705 | 1027.02 | 758 | 742 | 145.0 |
| B | 0 | 229 | 54285 | 369.15 | 758 | 742 | 145.0 |
| B | 4 | 216 | 24890 | 166.49 | 758 | 742 | 145.0 |
| C | 3 | 233 | 249332 | 1483.14 | 721 | 729 | 167.6 |
| C | 14 | 238 | 110968 | 657.67 | 721 | 729 | 167.6 |
| C | 0 | 207 | 15183 | 86.23 | 721 | 729 | 167.6 |
| D | 1 | 52 | 1434533 | 8091.65 | 727 | 705 | 177.2 |
| D | 7 | 38 | 253951 | 1429.16 | 727 | 705 | 177.2 |
| D | 13 | 172 | 28866 | 158.92 | 727 | 705 | 177.2 |
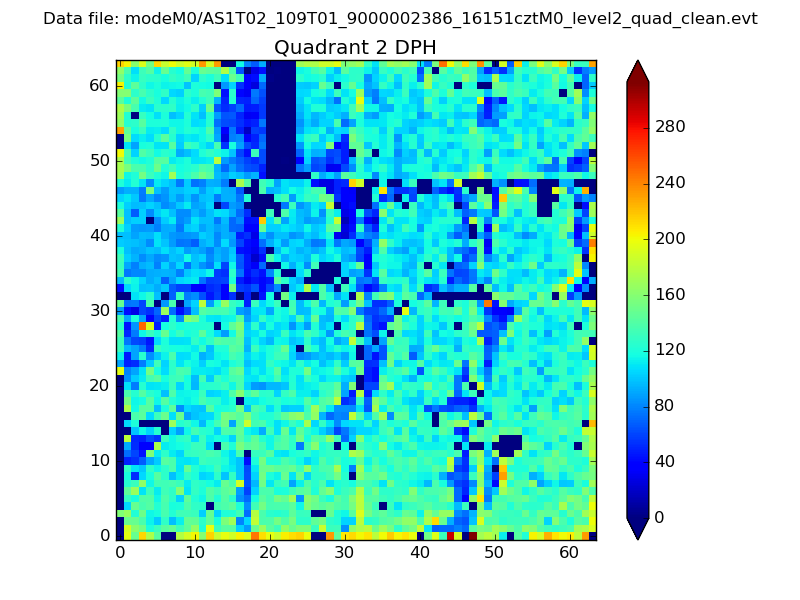
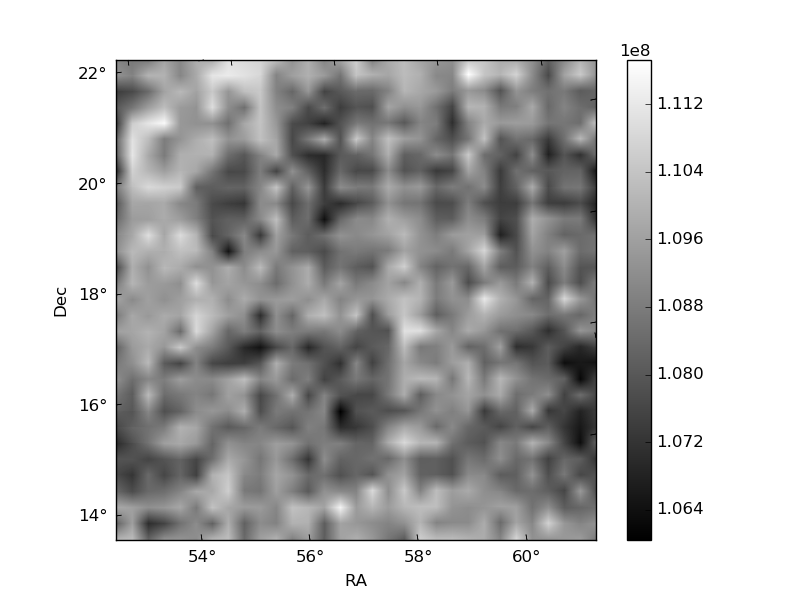
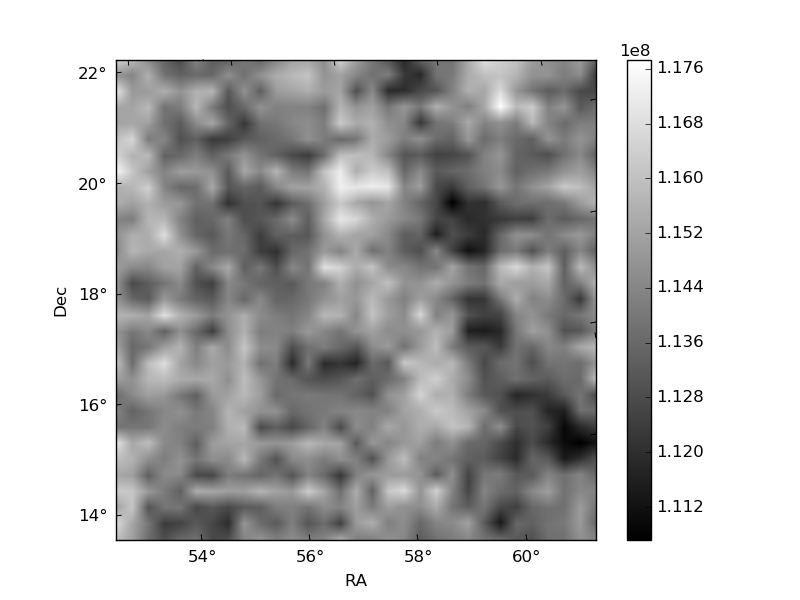
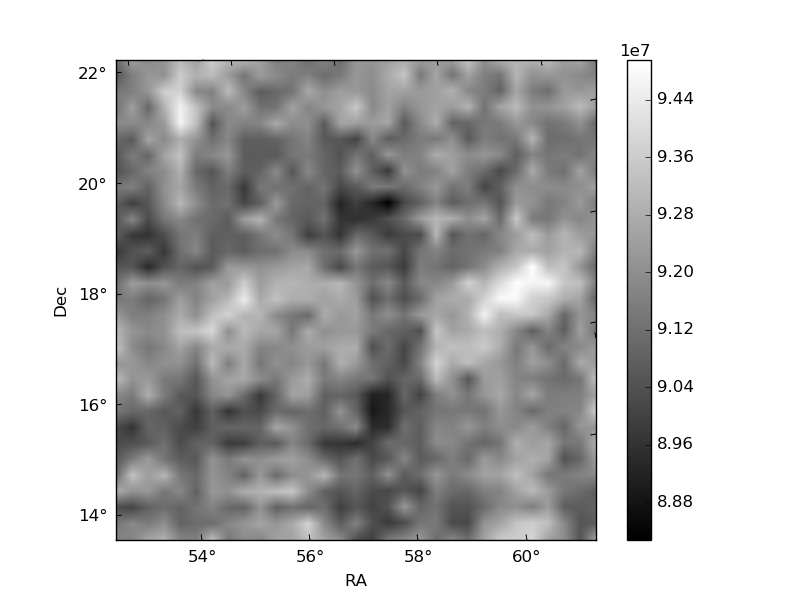
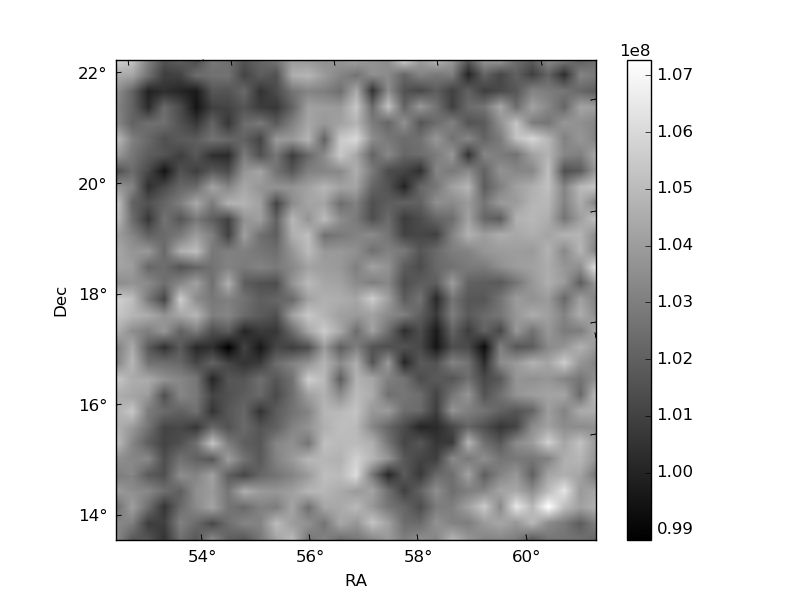
Histogram calculated using DETX and DETY for each event in the final _common_clean file
| Quadrant A | 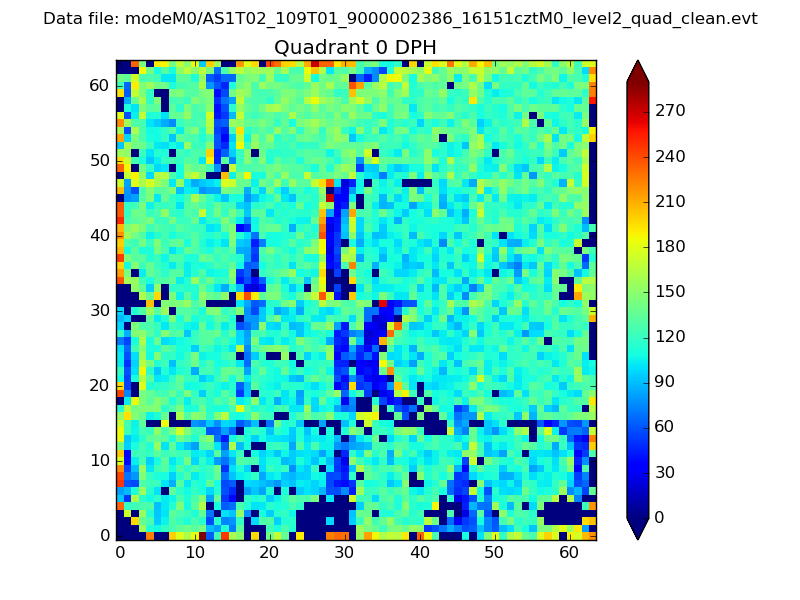 |
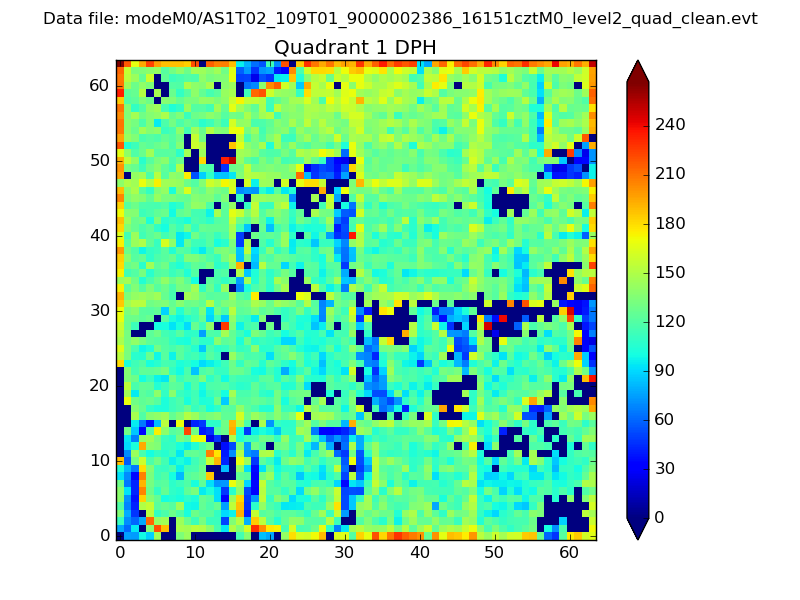 |
Quadrant B |
|---|---|---|---|
| Quadrant D | 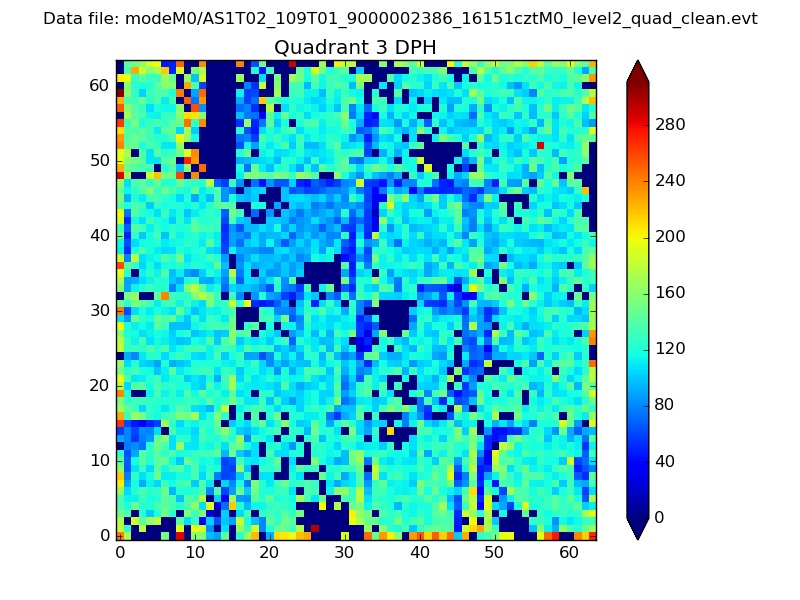 |
 |
Quadrant C |
| Plot type | Count rate plots | Images |
|---|---|---|
| Comparison with Poisson distribution Blue bars denote a histogram of data divided into 1 sec bins. Red curve is a Poisson curve with rate = median count rate of data. |
 |
 |
| Quadrant-wise count rates Data is divided into 100 sec bins |
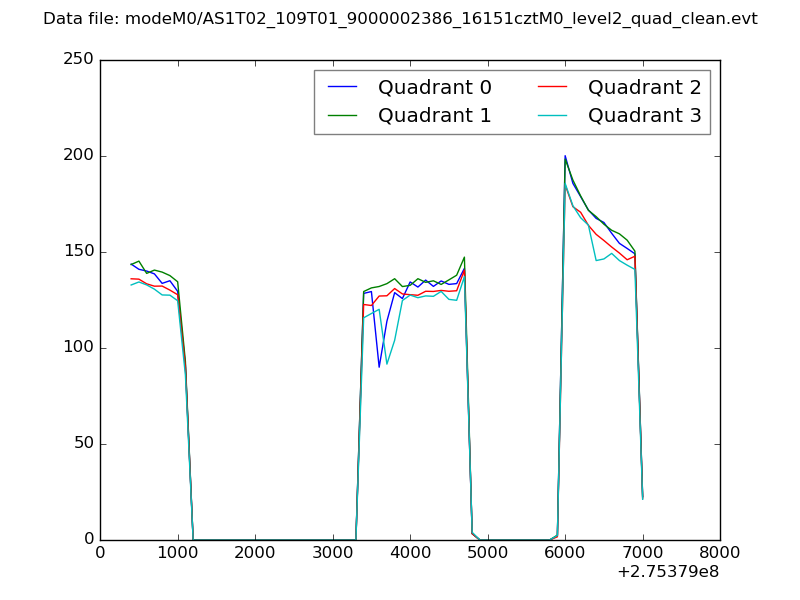 |
|
| Module-wise count rates for Quadrant A Data is divided into 100 sec bins |
 |
 |
| Module-wise count rates for Quadrant B Data is divided into 100 sec bins |
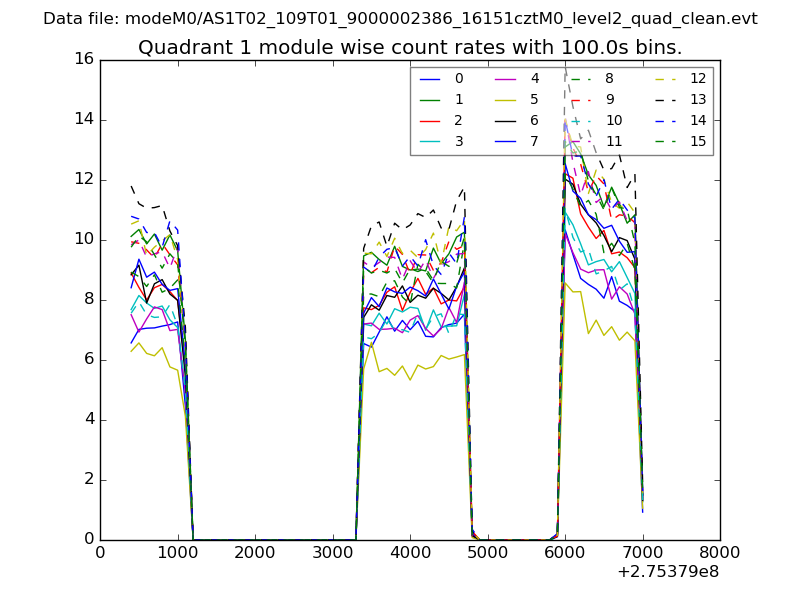 |
 |
| Module-wise count rates for Quadrant C Data is divided into 100 sec bins |
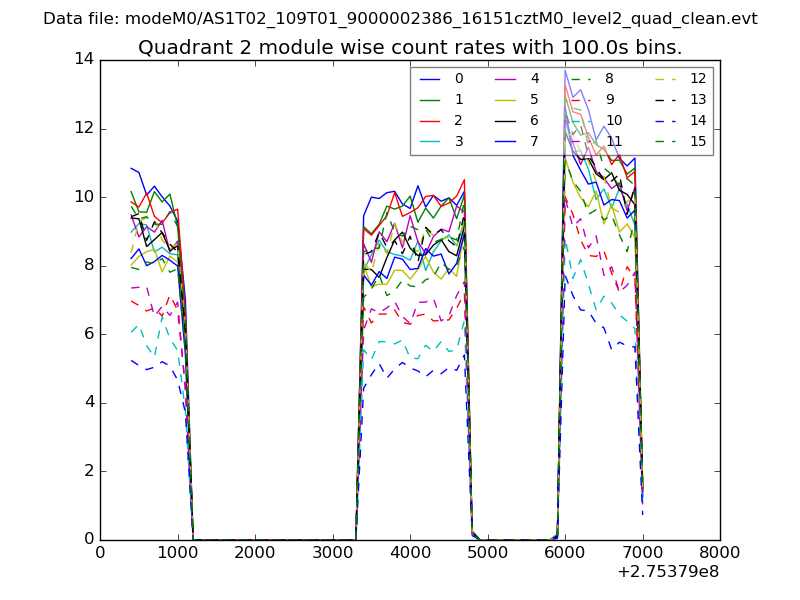 |
 |
| Module-wise count rates for Quadrant D Data is divided into 100 sec bins |
 |
 |
| Parameter | Plot |
|---|---|
| CZT HV Monitor | 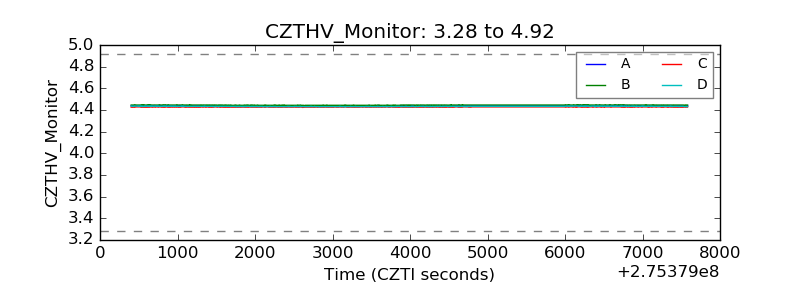 |
| D_VDD | 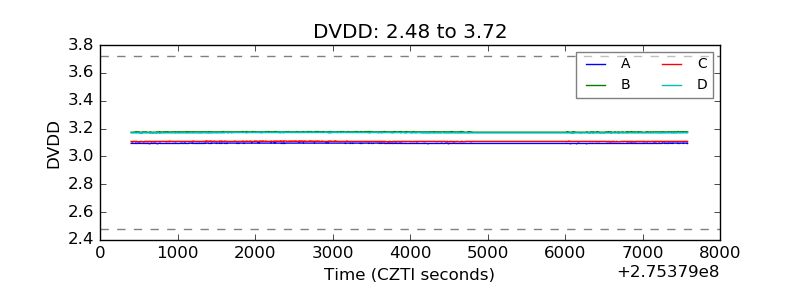 |
| Temperature 1 | 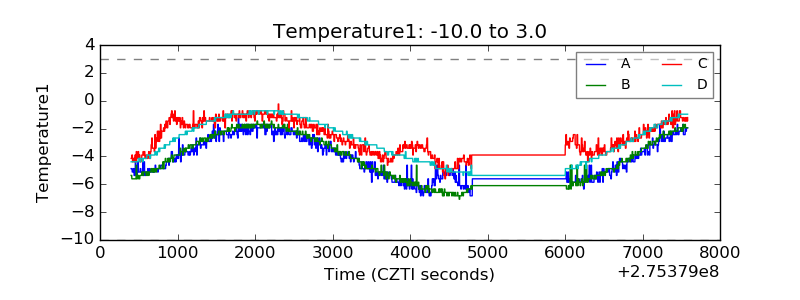 |
| Veto HV Monitor | 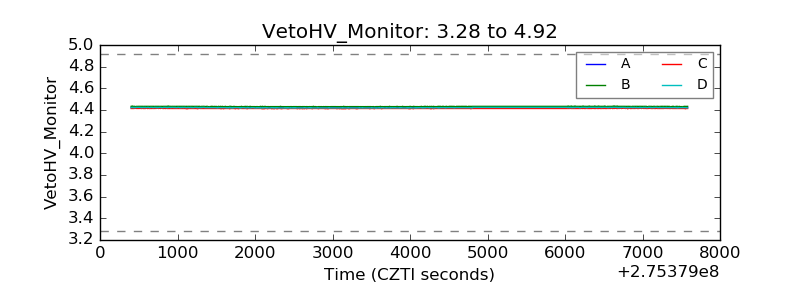 |
| Veto LLD | 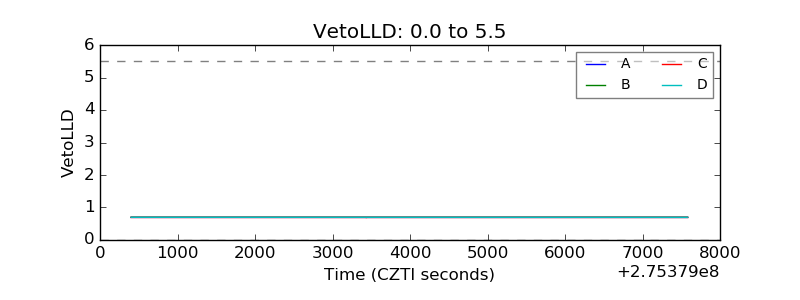 |
| Alpha Counter | 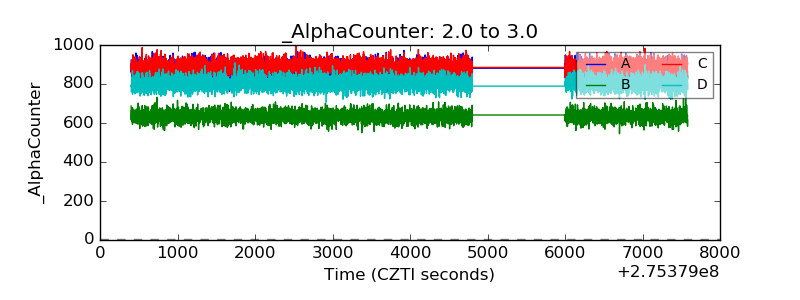 |
| _CPM_Rate | 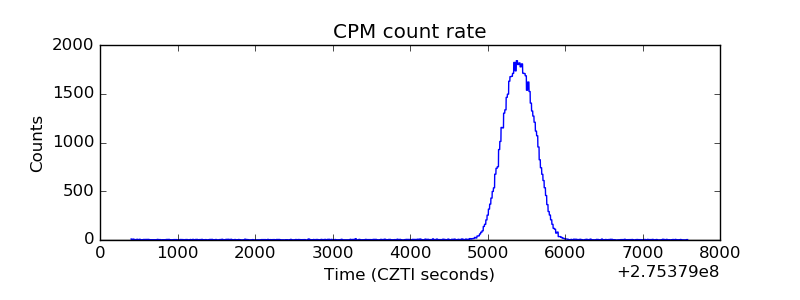 |
| CZT Counter |  |
| +2.5 Volts monitor |  |
| +5 Volts monitor | 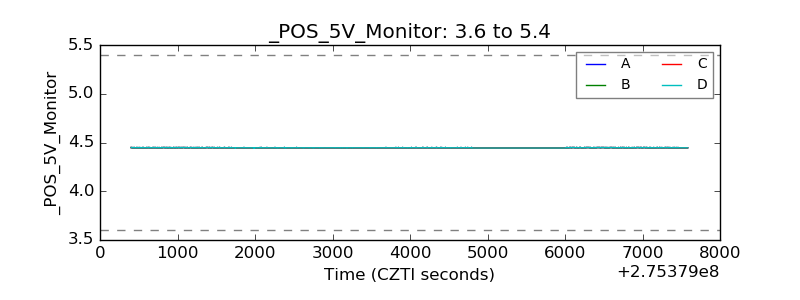 |
| _ROLL_ROT |  |
| _Roll_DEC |  |
| _Roll_RA |  |
| Veto Counter |  |