| Param | Original file | Final file |
|---|---|---|
| Filename | modeM0/AS1T02_109T01_9000002386_16153cztM0_level2.evt | modeM0/AS1T02_109T01_9000002386_16153cztM0_level2_quad_clean.evt |
| Size (bytes) | 532,958,400 | 72,504,000 |
| Size | 508.3 MB | 69.1 MB |
| Events in quadrant A | 3,690,262 | 444,775 |
| Events in quadrant B | 4,196,971 | 448,170 |
| Events in quadrant C | 3,843,967 | 428,216 |
| Events in quadrant D | 3,968,803 | 420,647 |
| Mode M0 | |||
|---|---|---|---|
| Quadrant | BADHDUFLAG | Total packets | Discarded packets |
| A | 0 | 15092 | 3 |
| B | 0 | 16561 | 2 |
| C | 0 | 15422 | 2 |
| D | 0 | 15739 | 2 |
| Mode SS | |||
|---|---|---|---|
| Quadrant | BADHDUFLAG | Total packets | Discarded packets |
| A | 0 | 130 | 0 |
| B | 0 | 130 | 0 |
| C | 0 | 130 | 0 |
| D | 0 | 130 | 0 |
| Mode M9 | |||
|---|---|---|---|
| Quadrant | BADHDUFLAG | Total packets | Discarded packets |
| A | 0 | 13 | 0 |
| B | 0 | 13 | 0 |
| C | 0 | 13 | 0 |
| D | 0 | 13 | 0 |
| Quadrant | Total seconds | Saturated seconds | Saturation percentage |
|---|---|---|---|
| A | 6502 | 77 | 1.184251% |
| B | 6502 | 221 | 3.398954% |
| C | 6502 | 105 | 1.614888% |
| D | 6503 | 189 | 2.906351% |
Noise dominated data is calculated using 1-second bins in cleaned event files. If a bin has >2000 counts, and if more than 50% of those come from <1% of pixels, then it is considered to be noise-dominated and hence unusable.
| Quadrant | # 1 sec bins | Bins with >0 counts | Bins with >2000 counts | High rate bins dominated by noise | Noise dominated (total time) | Noise dominated (detector-on time) | Marked lightcurve |
|---|---|---|---|---|---|---|---|
| A | 7813 | 6504 | 3 | 3 | 0.04% | 0.05% | 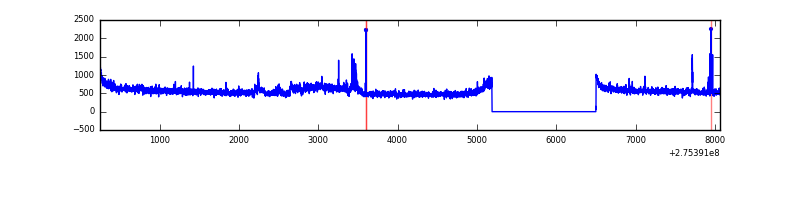 |
| B | 7813 | 6504 | 111 | 111 | 1.42% | 1.71% | 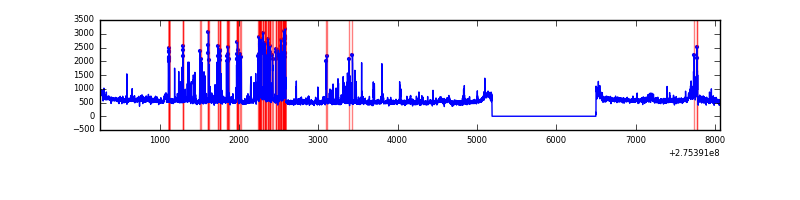 |
| C | 7813 | 6504 | 0 | 0 | 0.00% | 0.00% | 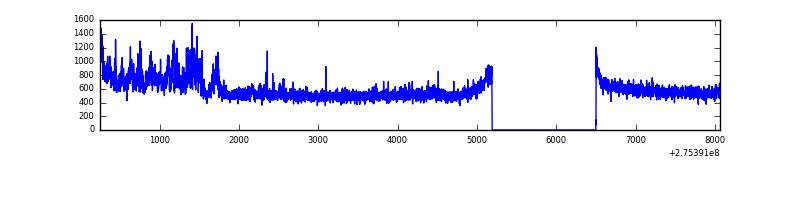 |
| D | 7814 | 6505 | 132 | 132 | 1.69% | 2.03% | 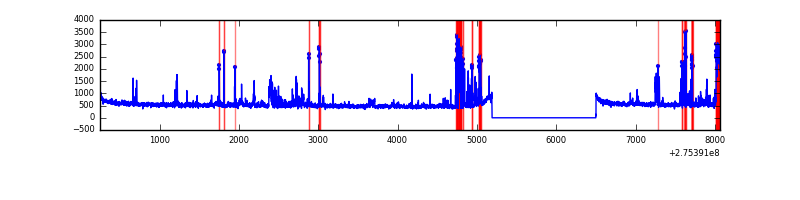 |
Top three noisy pixels from each quadrant. If the there are fewer than three noisy pixels in the level2.evt file, extra rows are filled as -1
| Pixel properties | Quadrant properties | ||||||
|---|---|---|---|---|---|---|---|
| Quadrant | DetID | PixID | Counts | Sigma | Mean | Median | Sigma |
| A | 0 | 253 | 153846 | 851.52 | 898 | 880 | 179.6 |
| A | 15 | 174 | 57000 | 312.4 | 898 | 880 | 179.6 |
| A | 8 | 247 | 26941 | 145.07 | 898 | 880 | 179.6 |
| B | 5 | 65 | 500110 | 3041.92 | 877 | 862 | 164.1 |
| B | 0 | 229 | 74310 | 447.52 | 877 | 862 | 164.1 |
| B | 4 | 173 | 62484 | 375.46 | 877 | 862 | 164.1 |
| C | 3 | 233 | 392939 | 2022.01 | 846 | 853 | 193.9 |
| C | 14 | 238 | 131536 | 673.94 | 846 | 853 | 193.9 |
| C | 0 | 207 | 16726 | 81.86 | 846 | 853 | 193.9 |
| D | 1 | 52 | 583147 | 2793.27 | 863 | 839 | 208.5 |
| D | 5 | 222 | 99957 | 475.46 | 863 | 839 | 208.5 |
| D | 2 | 234 | 25605 | 118.8 | 863 | 839 | 208.5 |
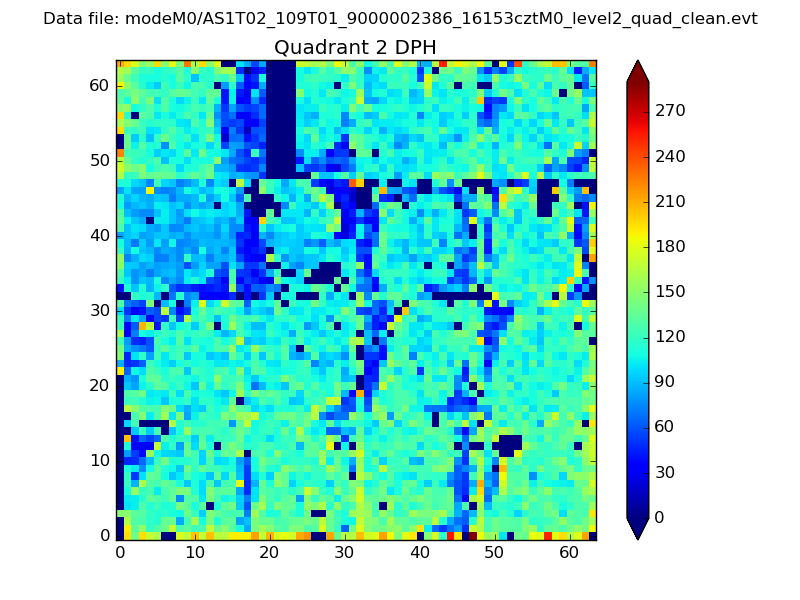
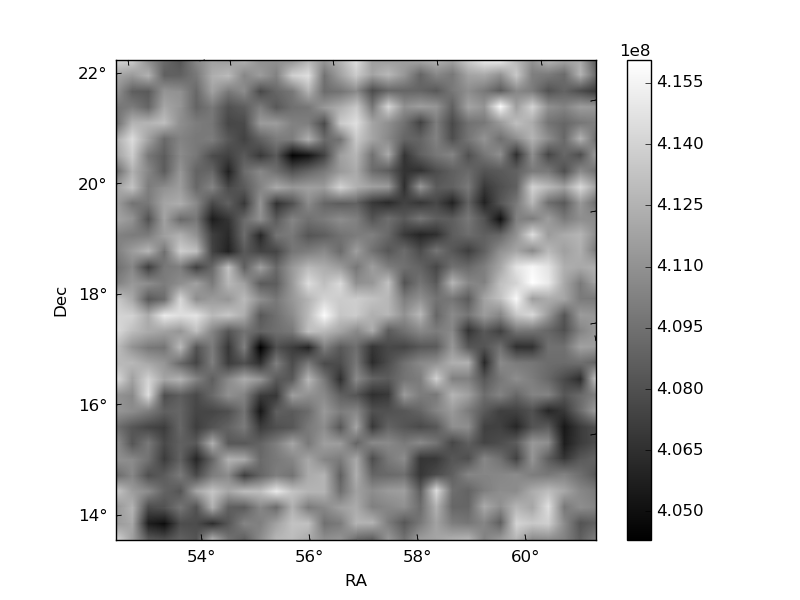
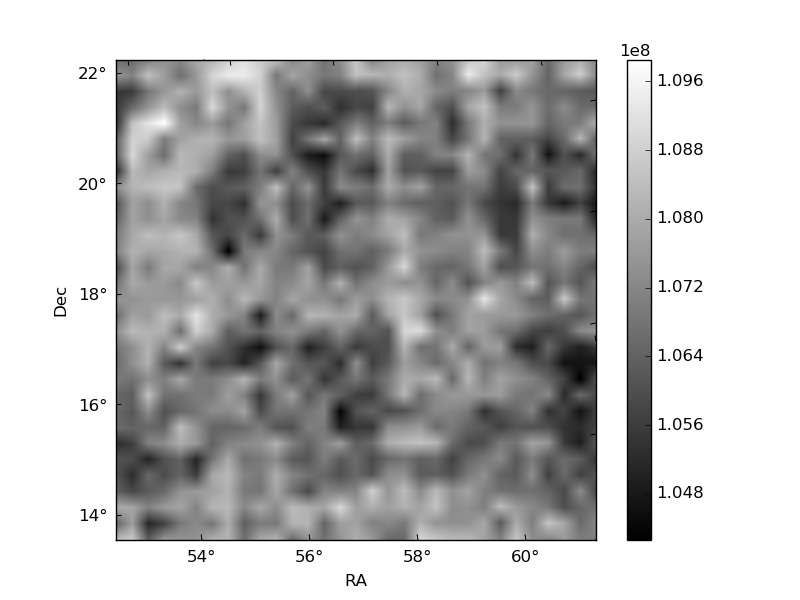
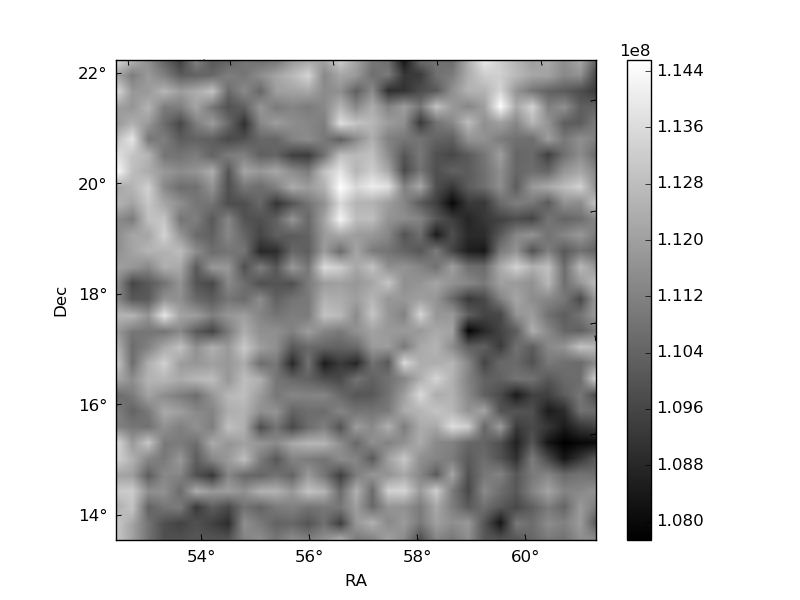
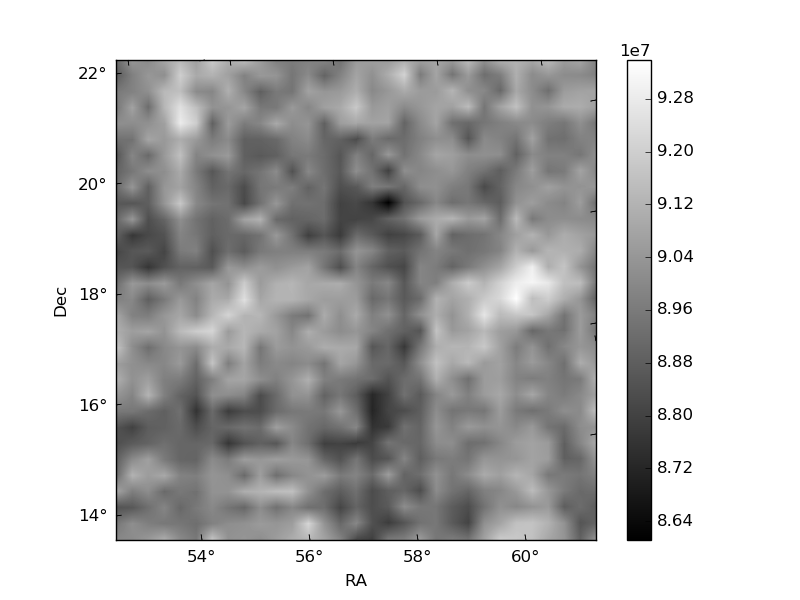
Histogram calculated using DETX and DETY for each event in the final _common_clean file
| Quadrant A | 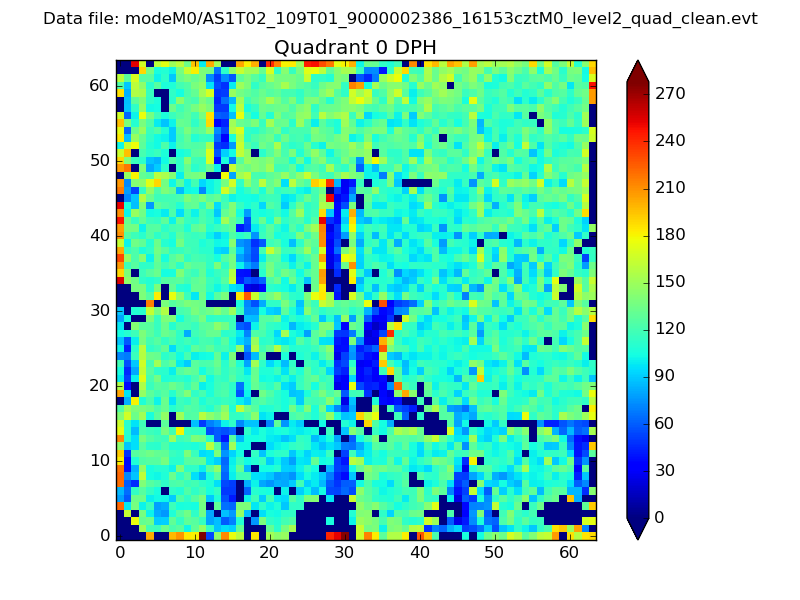 |
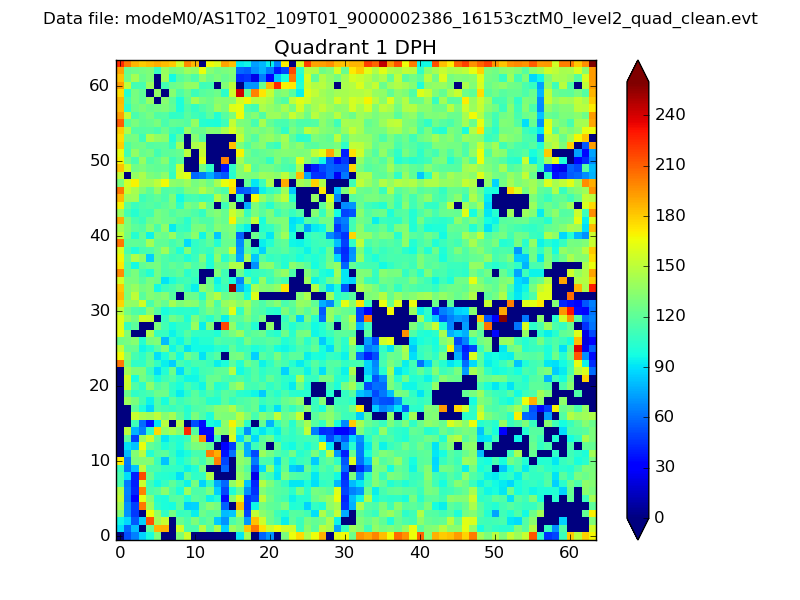 |
Quadrant B |
|---|---|---|---|
| Quadrant D | 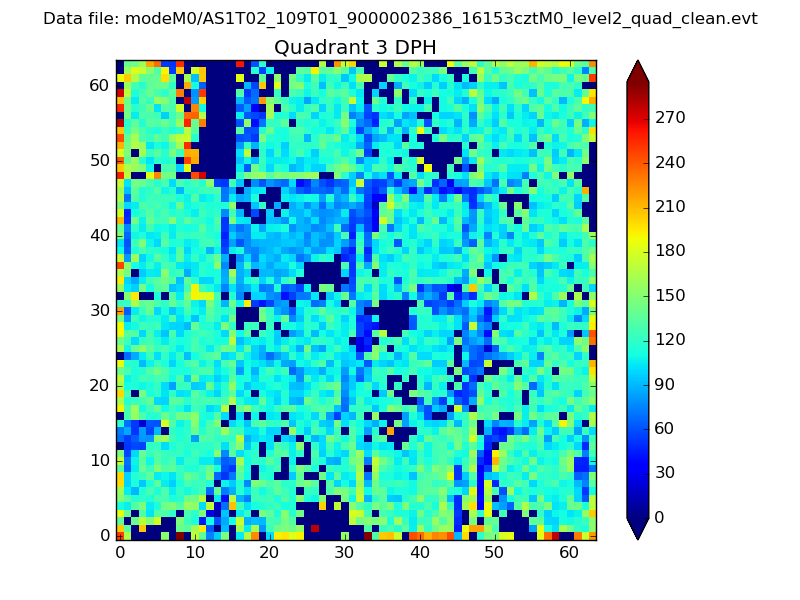 |
 |
Quadrant C |
| Plot type | Count rate plots | Images |
|---|---|---|
| Comparison with Poisson distribution Blue bars denote a histogram of data divided into 1 sec bins. Red curve is a Poisson curve with rate = median count rate of data. |
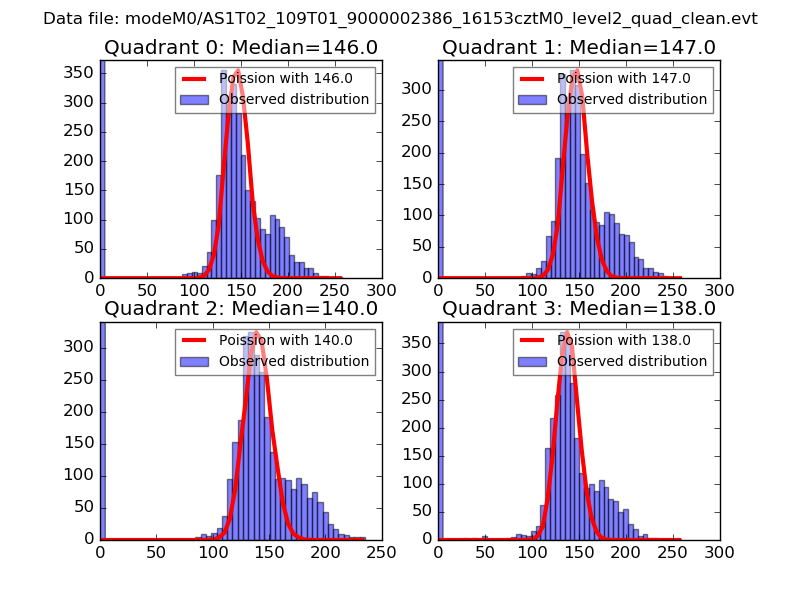 |
 |
| Quadrant-wise count rates Data is divided into 100 sec bins |
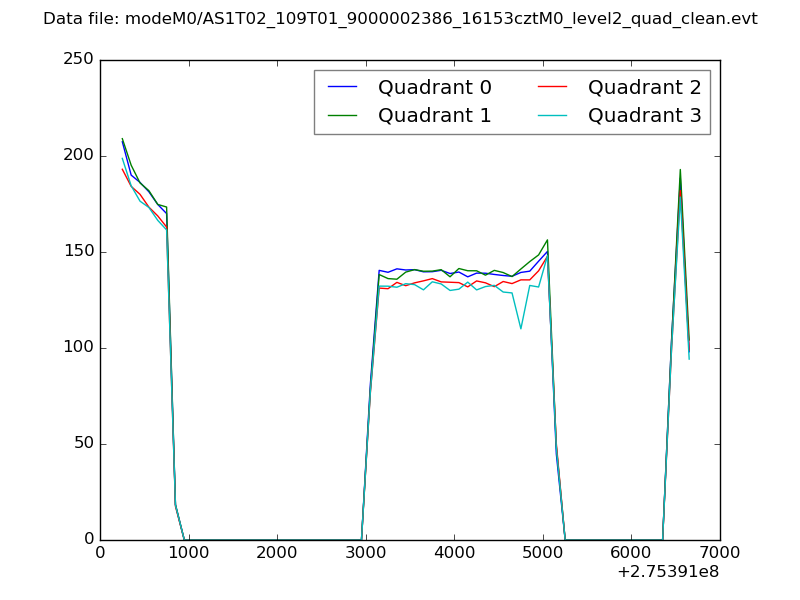 |
|
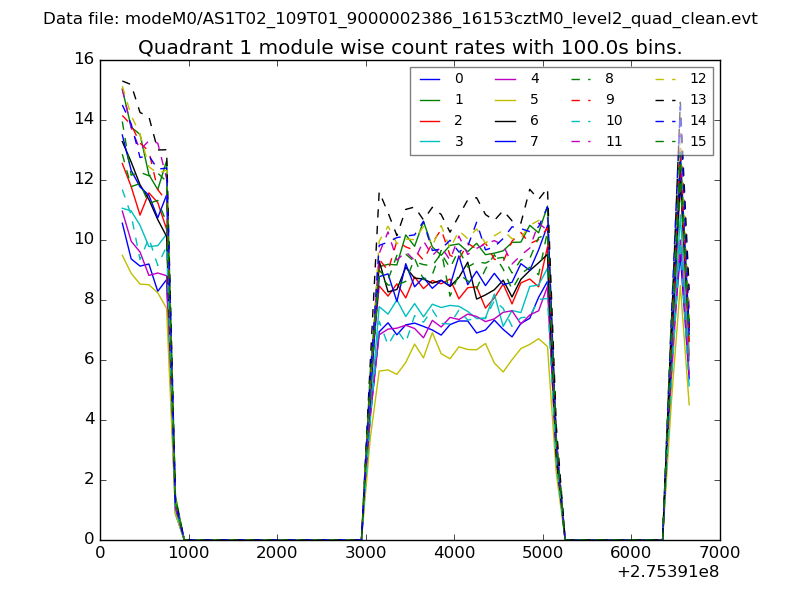
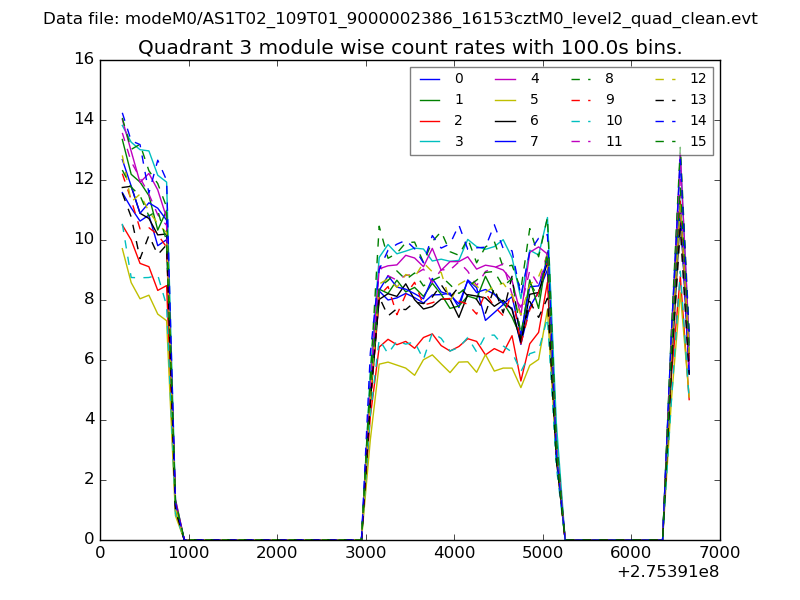
| Module-wise count rates for Quadrant A Data is divided into 100 sec bins |
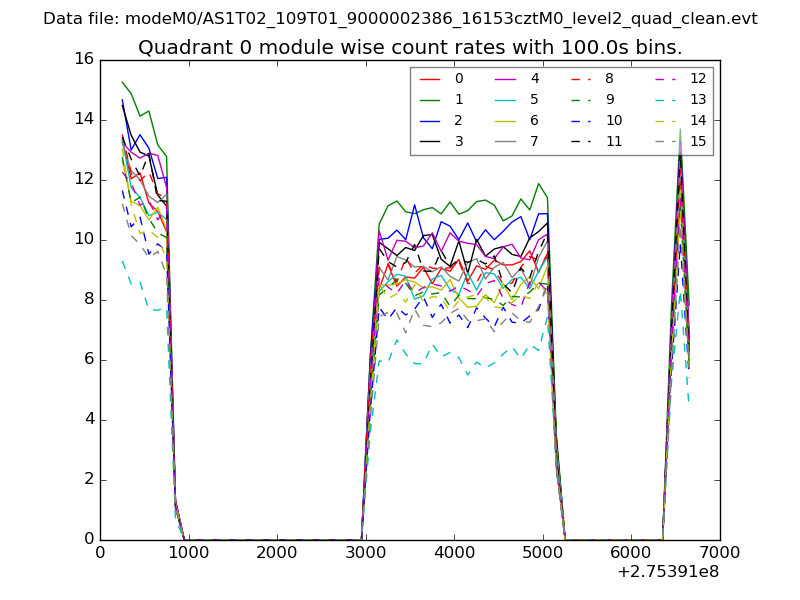 |
 |
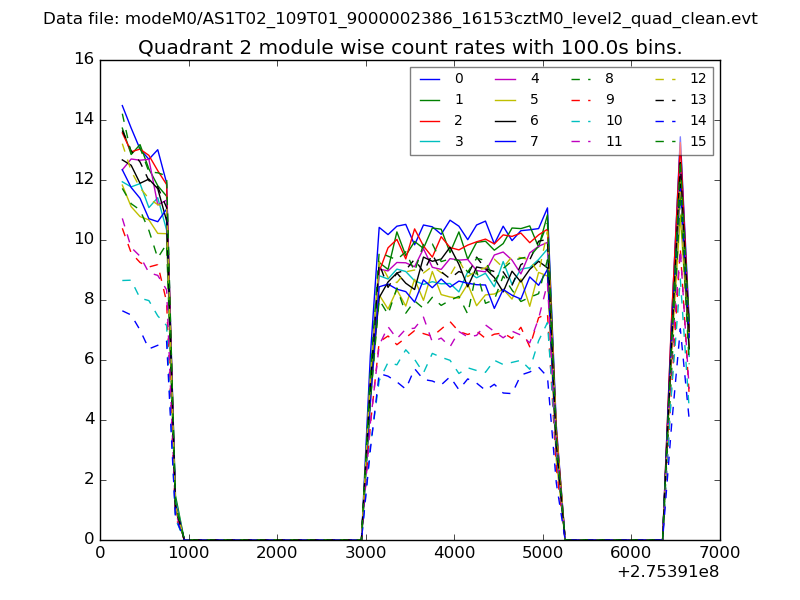
| Module-wise count rates for Quadrant B Data is divided into 100 sec bins |
 |
 |
| Module-wise count rates for Quadrant C Data is divided into 100 sec bins |
 |
 |
| Module-wise count rates for Quadrant D Data is divided into 100 sec bins |
 |
 |
| Parameter | Plot |
|---|---|
| CZT HV Monitor | 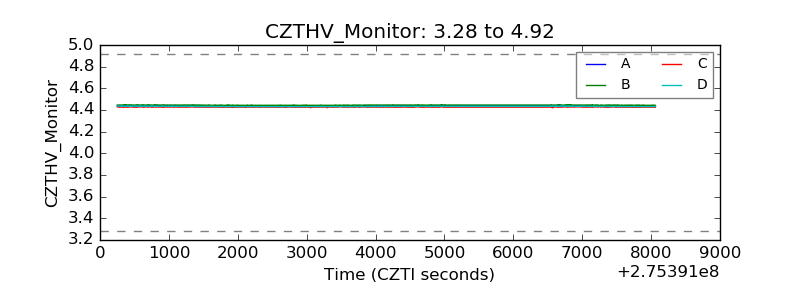 |
| D_VDD | 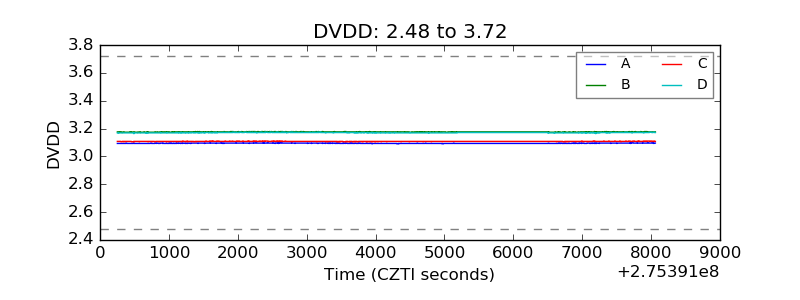 |
| Temperature 1 | 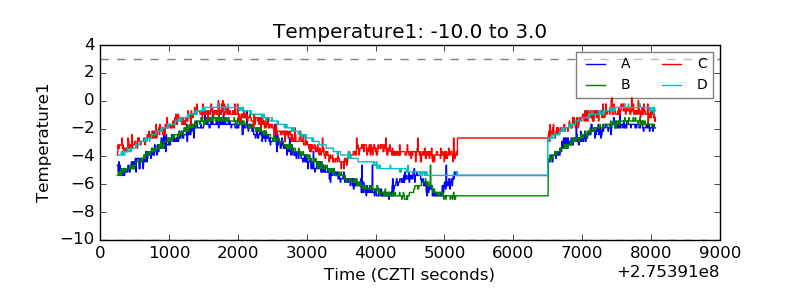 |
| Veto HV Monitor | 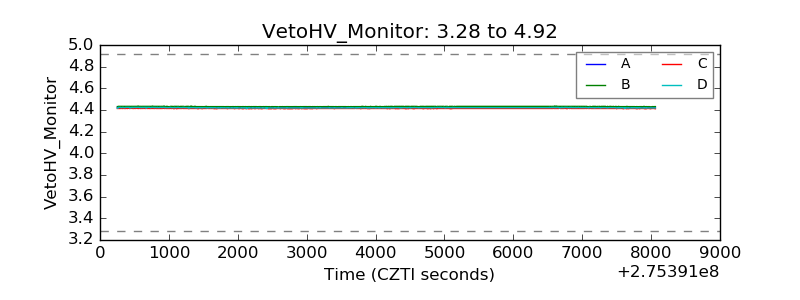 |
| Veto LLD |  |
| Alpha Counter | 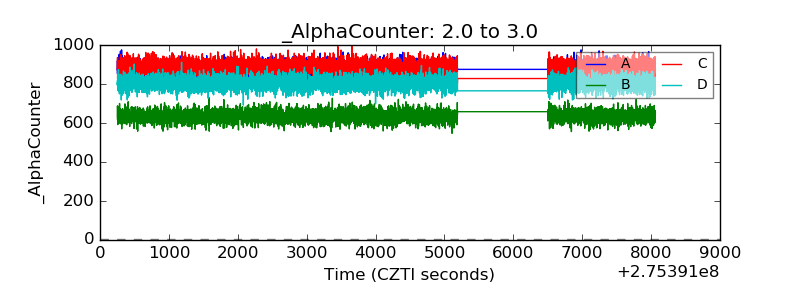 |
| _CPM_Rate | 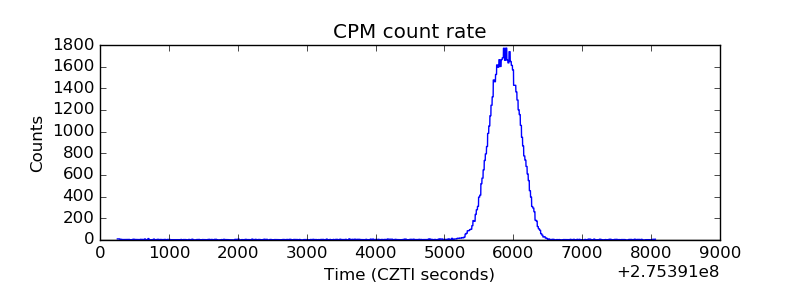 |
| CZT Counter | 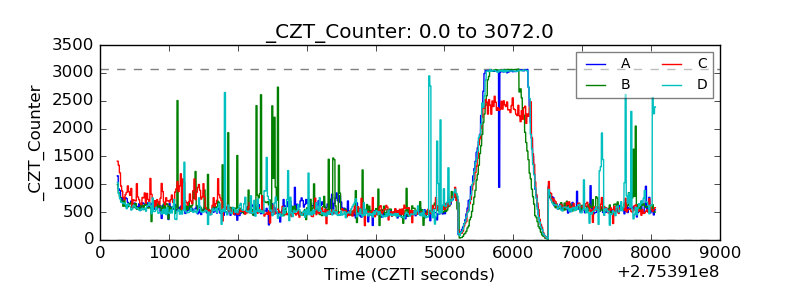 |
| +2.5 Volts monitor |  |
| +5 Volts monitor |  |
| _ROLL_ROT | 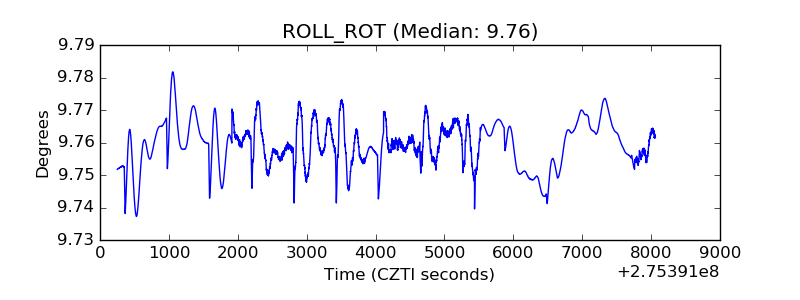 |
| _Roll_DEC | 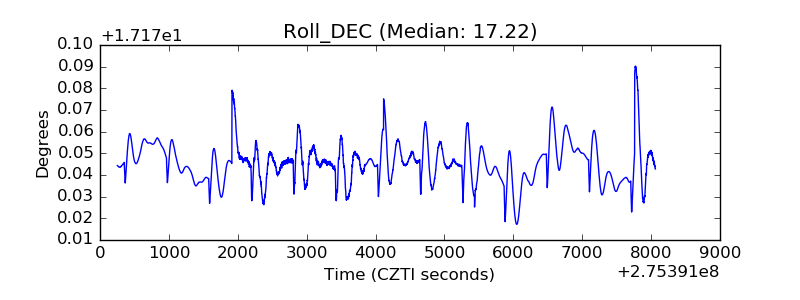 |
| _Roll_RA | 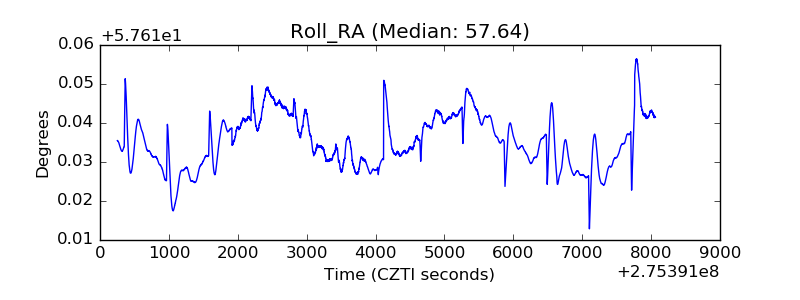 |
| Veto Counter | 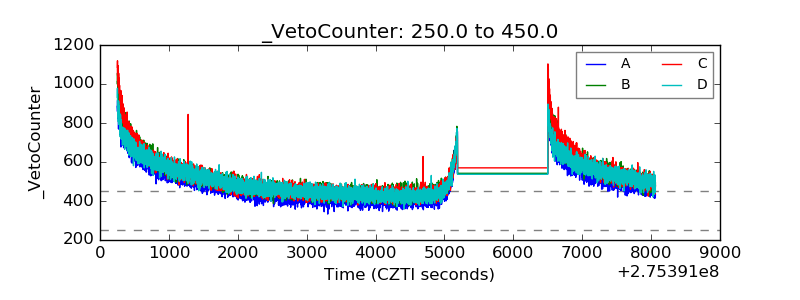 |