| Param | Original file | Final file |
|---|---|---|
| Filename | modeM0/AS1T02_109T01_9000002386_16154cztM0_level2.evt | modeM0/AS1T02_109T01_9000002386_16154cztM0_level2_quad_clean.evt |
| Size (bytes) | 522,440,640 | 65,966,400 |
| Size | 498.2 MB | 62.9 MB |
| Events in quadrant A | 3,541,415 | 389,754 |
| Events in quadrant B | 3,694,486 | 397,466 |
| Events in quadrant C | 3,541,934 | 380,530 |
| Events in quadrant D | 4,601,547 | 374,353 |
| Mode M0 | |||
|---|---|---|---|
| Quadrant | BADHDUFLAG | Total packets | Discarded packets |
| A | 0 | 14362 | 3 |
| B | 0 | 14963 | 2 |
| C | 0 | 14426 | 2 |
| D | 0 | 17771 | 2 |
| Mode SS | |||
|---|---|---|---|
| Quadrant | BADHDUFLAG | Total packets | Discarded packets |
| A | 0 | 134 | 0 |
| B | 0 | 134 | 0 |
| C | 0 | 134 | 0 |
| D | 0 | 134 | 0 |
| Mode M9 | |||
|---|---|---|---|
| Quadrant | BADHDUFLAG | Total packets | Discarded packets |
| A | 0 | 13 | 0 |
| B | 0 | 13 | 0 |
| C | 0 | 13 | 0 |
| D | 0 | 14 | 0 |
| Quadrant | Total seconds | Saturated seconds | Saturation percentage |
|---|---|---|---|
| A | 6520 | 131 | 2.009202% |
| B | 6520 | 136 | 2.085890% |
| C | 6520 | 126 | 1.932515% |
| D | 6520 | 474 | 7.269939% |
Noise dominated data is calculated using 1-second bins in cleaned event files. If a bin has >2000 counts, and if more than 50% of those come from <1% of pixels, then it is considered to be noise-dominated and hence unusable.
| Quadrant | # 1 sec bins | Bins with >0 counts | Bins with >2000 counts | High rate bins dominated by noise | Noise dominated (total time) | Noise dominated (detector-on time) | Marked lightcurve |
|---|---|---|---|---|---|---|---|
| A | 7796 | 6522 | 18 | 18 | 0.23% | 0.28% | 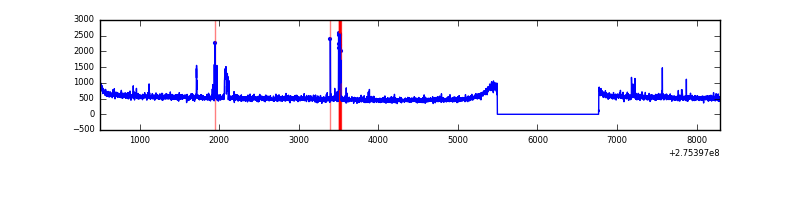 |
| B | 7796 | 6522 | 12 | 12 | 0.15% | 0.18% | 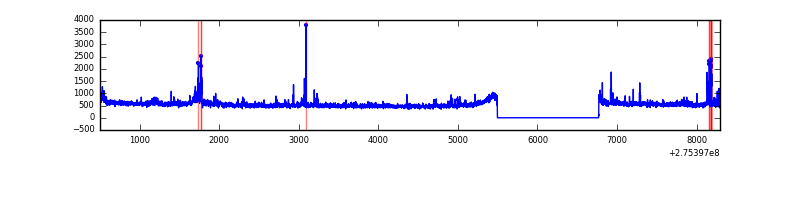 |
| C | 7796 | 6522 | 2 | 2 | 0.03% | 0.03% | 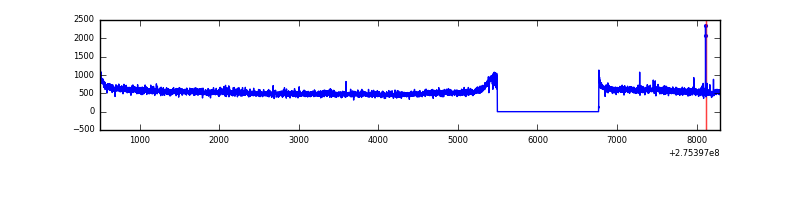 |
| D | 7796 | 6522 | 381 | 381 | 4.89% | 5.84% | 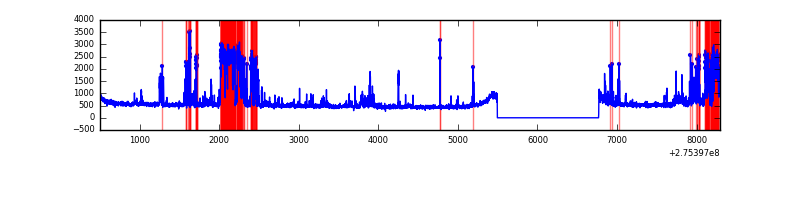 |
Top three noisy pixels from each quadrant. If the there are fewer than three noisy pixels in the level2.evt file, extra rows are filled as -1
| Pixel properties | Quadrant properties | ||||||
|---|---|---|---|---|---|---|---|
| Quadrant | DetID | PixID | Counts | Sigma | Mean | Median | Sigma |
| A | 15 | 174 | 120347 | 675.17 | 884 | 869 | 177.0 |
| A | 8 | 247 | 18538 | 99.85 | 884 | 869 | 177.0 |
| A | 0 | 226 | 8080 | 40.75 | 884 | 869 | 177.0 |
| B | 0 | 229 | 70794 | 425.8 | 874 | 856 | 164.3 |
| B | 5 | 65 | 66450 | 399.35 | 874 | 856 | 164.3 |
| B | 4 | 216 | 35751 | 212.45 | 874 | 856 | 164.3 |
| C | 14 | 238 | 131151 | 673.76 | 840 | 846 | 193.4 |
| C | 3 | 233 | 119091 | 611.4 | 840 | 846 | 193.4 |
| C | 0 | 207 | 11967 | 57.5 | 840 | 846 | 193.4 |
| D | 1 | 52 | 1144218 | 5569.71 | 842 | 819 | 205.3 |
| D | 7 | 38 | 147478 | 714.4 | 842 | 819 | 205.3 |
| D | 12 | 233 | 64827 | 311.79 | 842 | 819 | 205.3 |
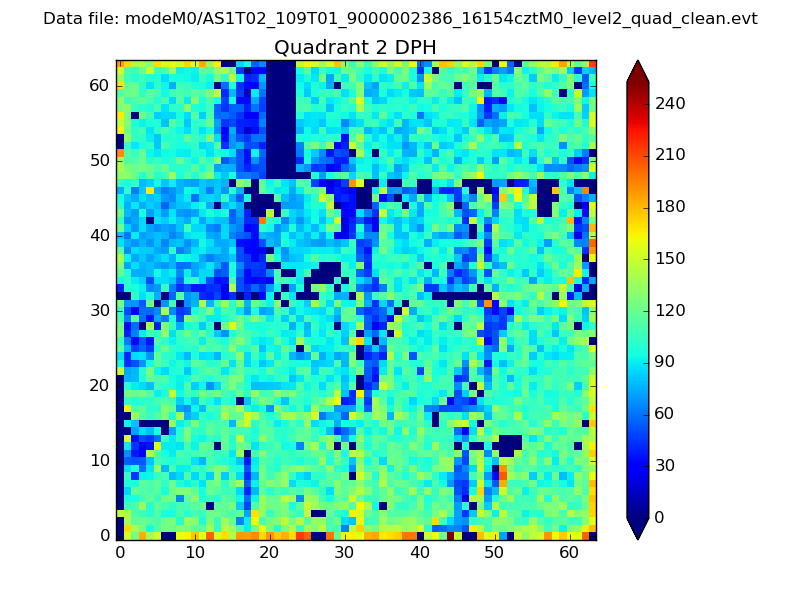
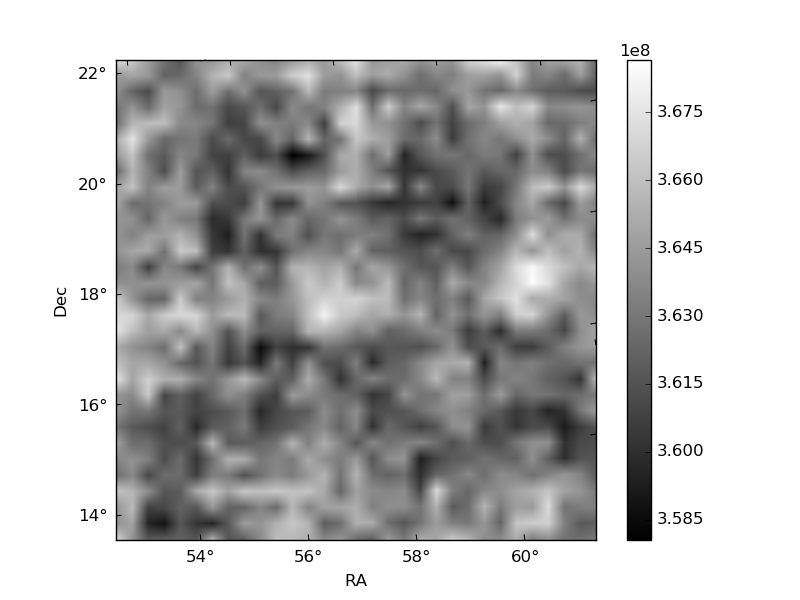
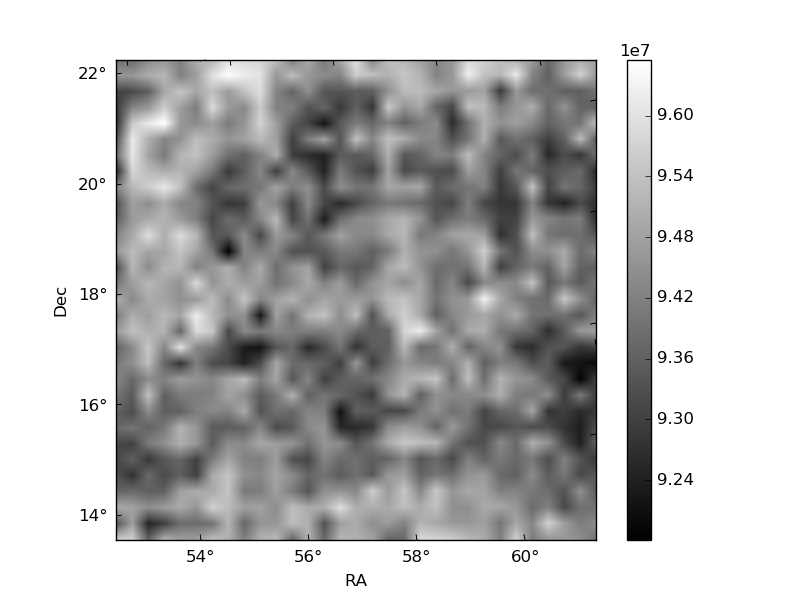
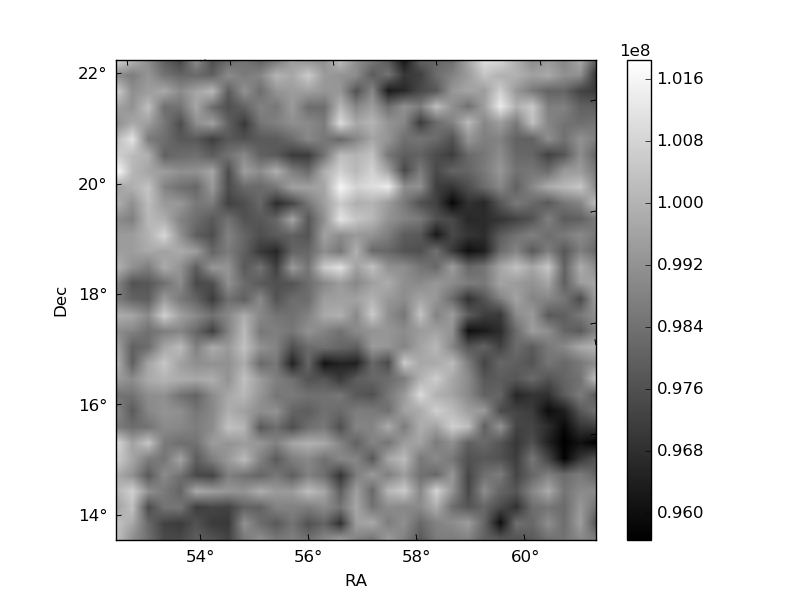
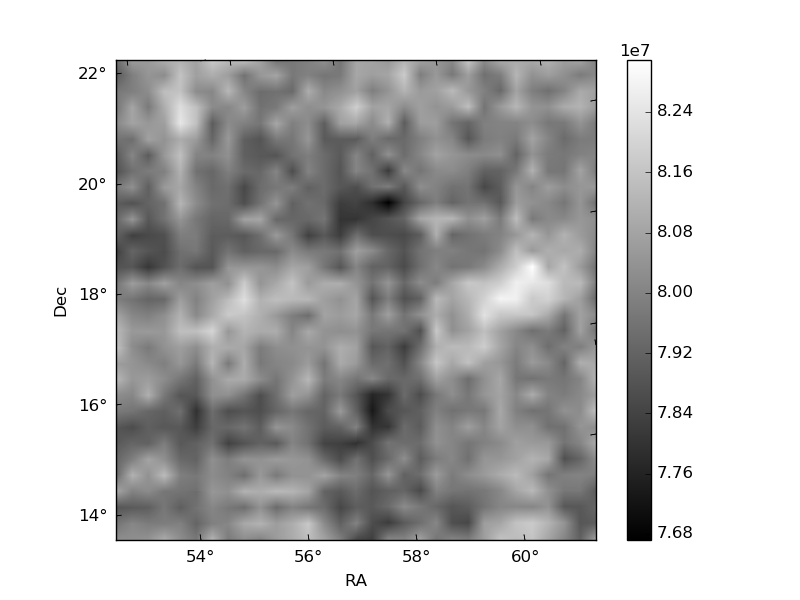
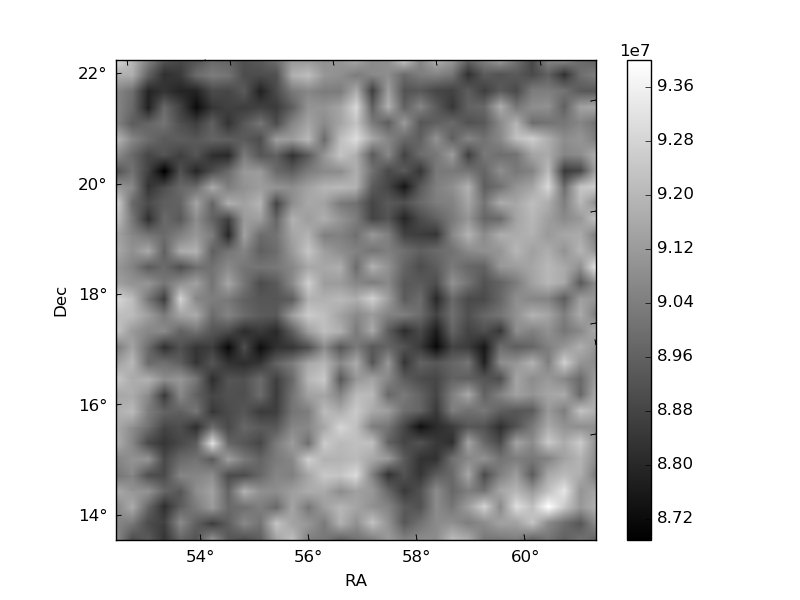
Histogram calculated using DETX and DETY for each event in the final _common_clean file
| Quadrant A | 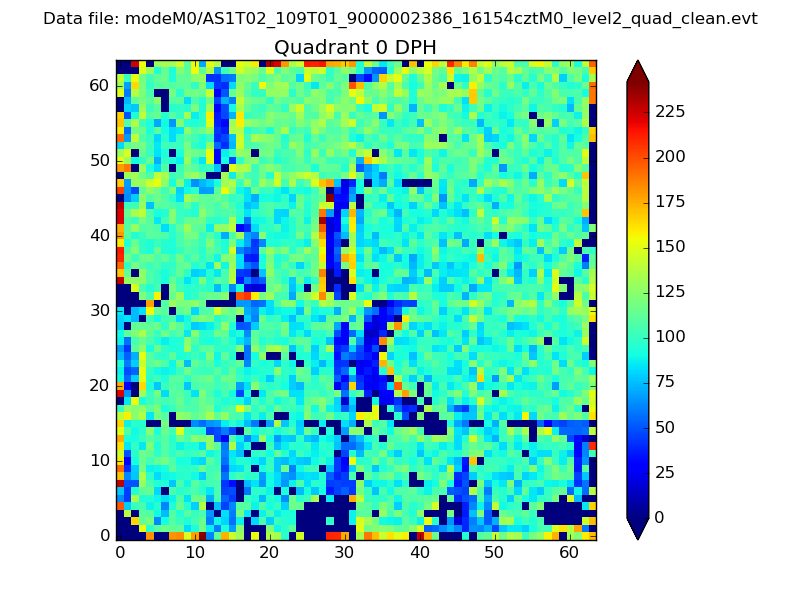 |
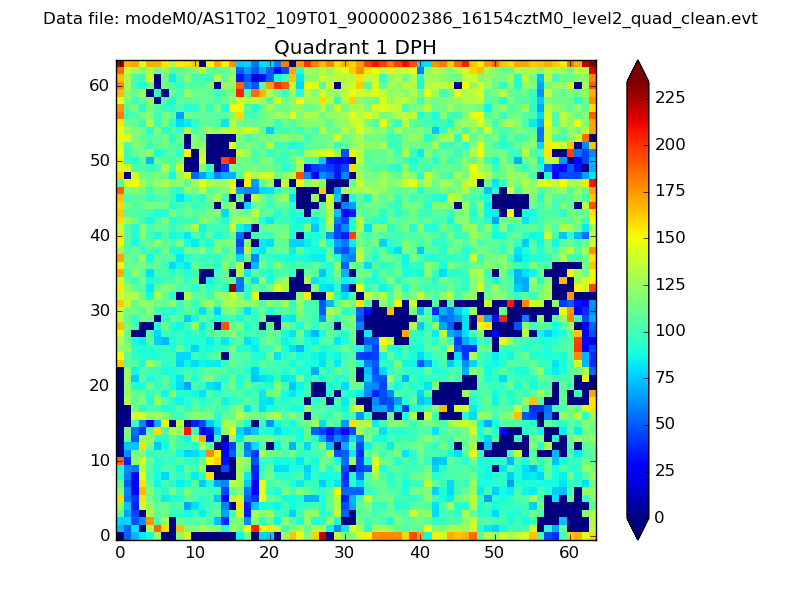 |
Quadrant B |
|---|---|---|---|
| Quadrant D | 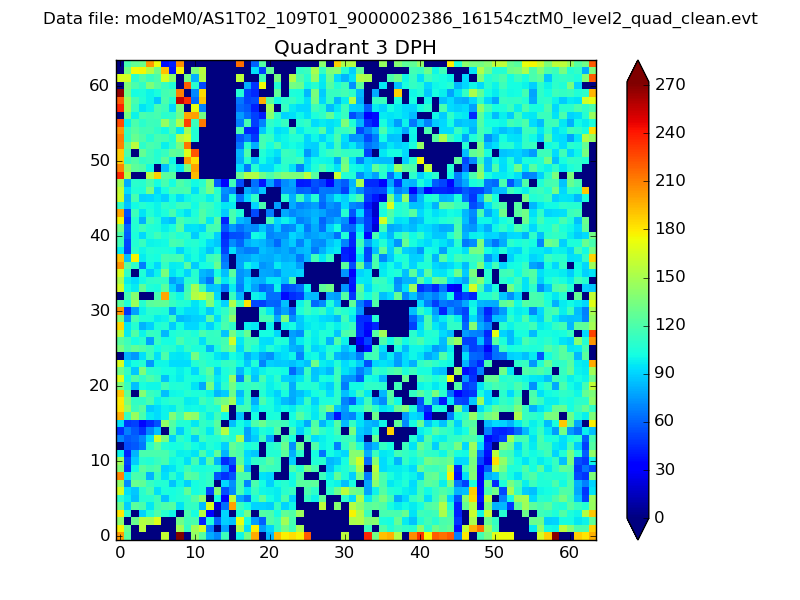 |
 |
Quadrant C |
| Plot type | Count rate plots | Images |
|---|---|---|
| Comparison with Poisson distribution Blue bars denote a histogram of data divided into 1 sec bins. Red curve is a Poisson curve with rate = median count rate of data. |
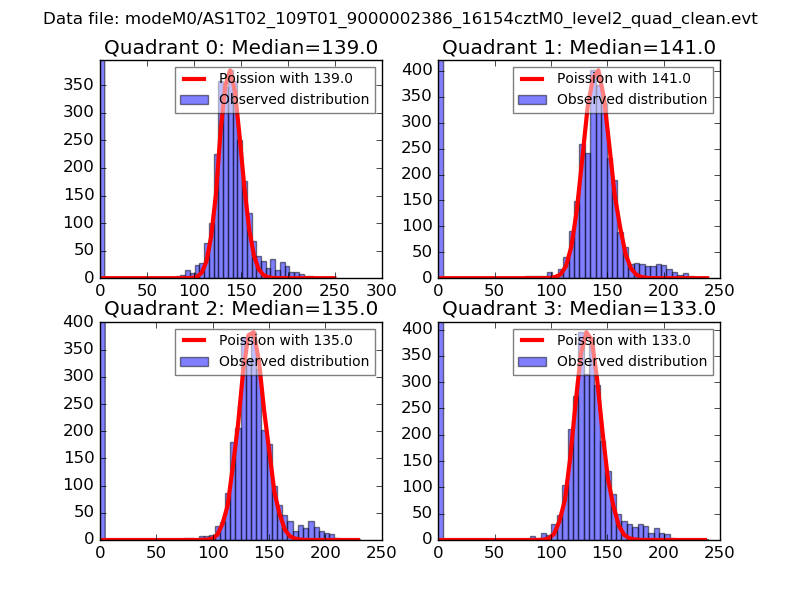 |
 |
| Quadrant-wise count rates Data is divided into 100 sec bins |
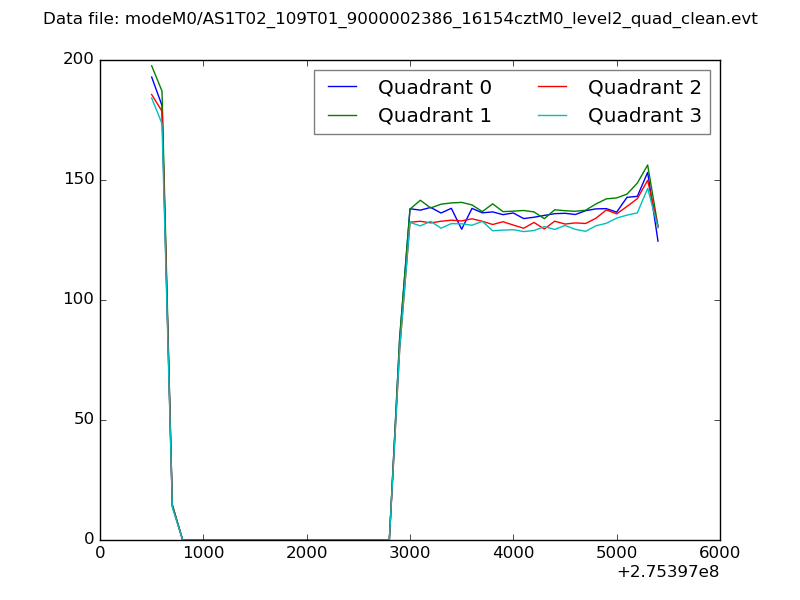 |
|
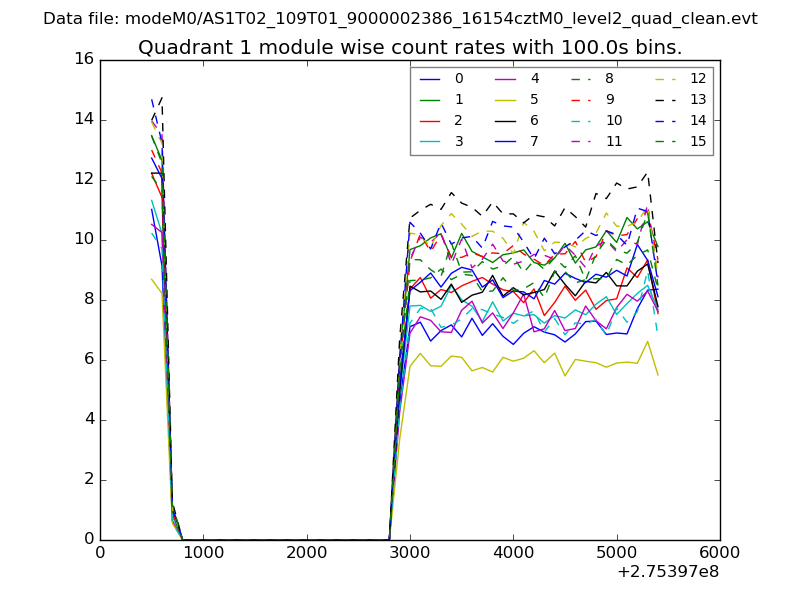
| Module-wise count rates for Quadrant A Data is divided into 100 sec bins |
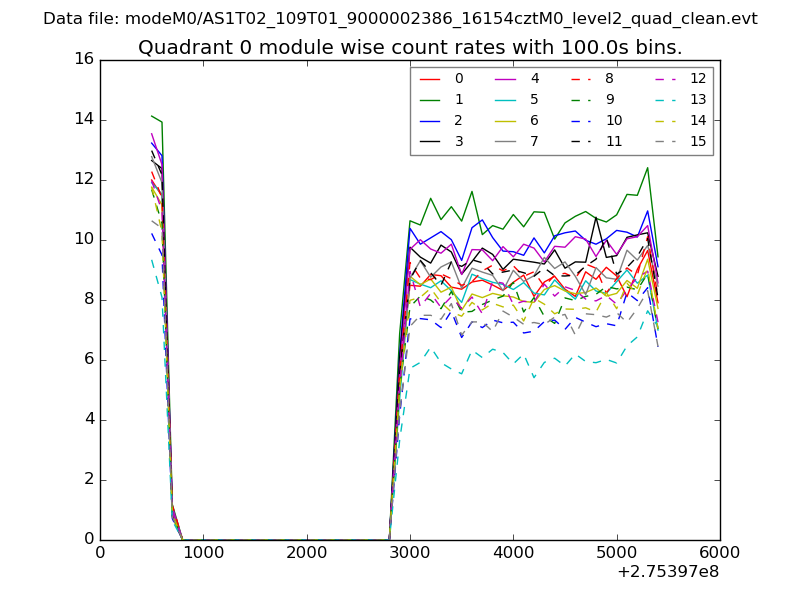 |
 |
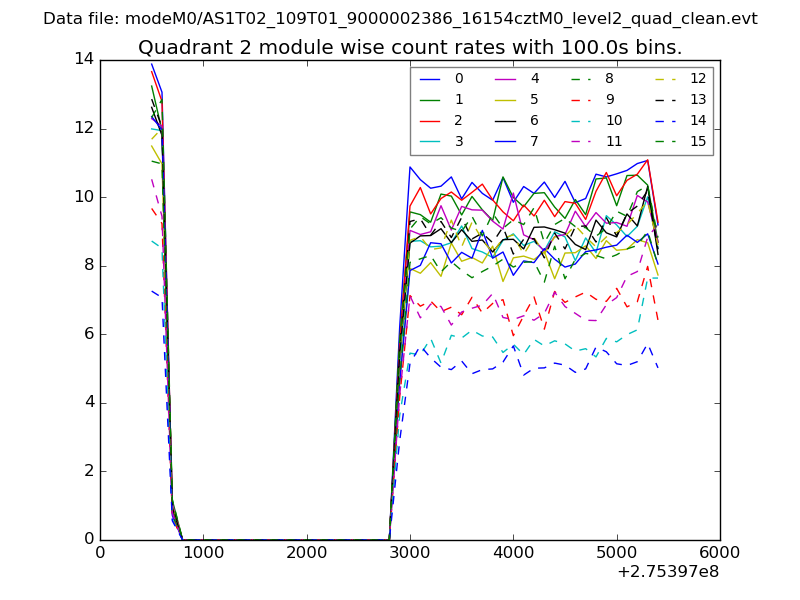
| Module-wise count rates for Quadrant B Data is divided into 100 sec bins |
 |
 |
| Module-wise count rates for Quadrant C Data is divided into 100 sec bins |
 |
 |
| Module-wise count rates for Quadrant D Data is divided into 100 sec bins |
 |
 |
| Parameter | Plot |
|---|---|
| CZT HV Monitor | 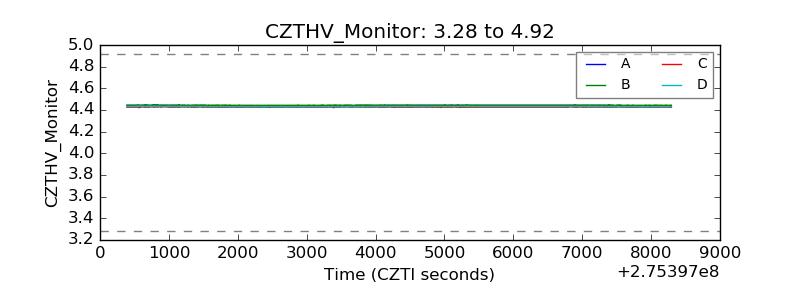 |
| D_VDD | 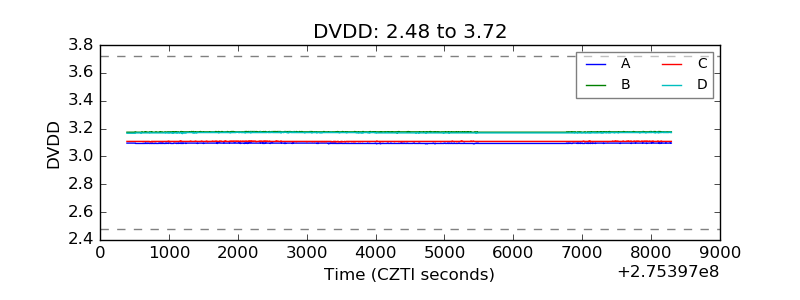 |
| Temperature 1 | 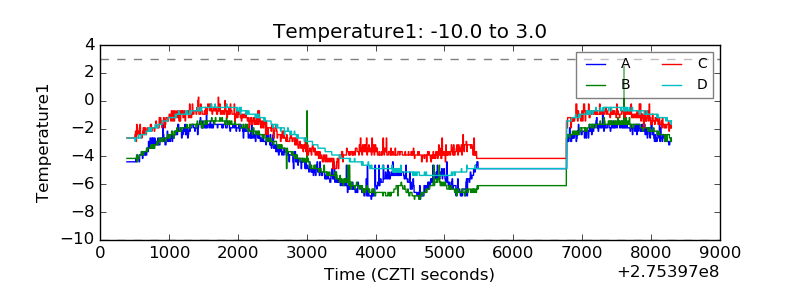 |
| Veto HV Monitor | 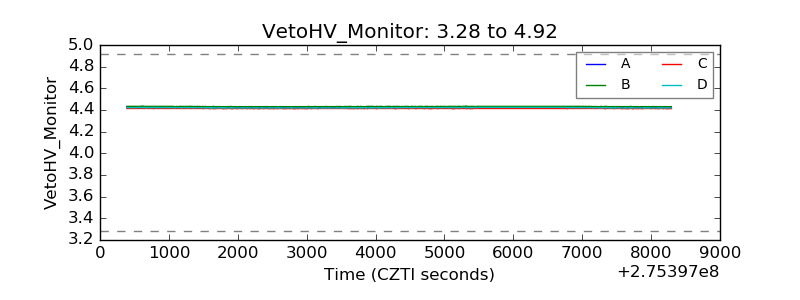 |
| Veto LLD | 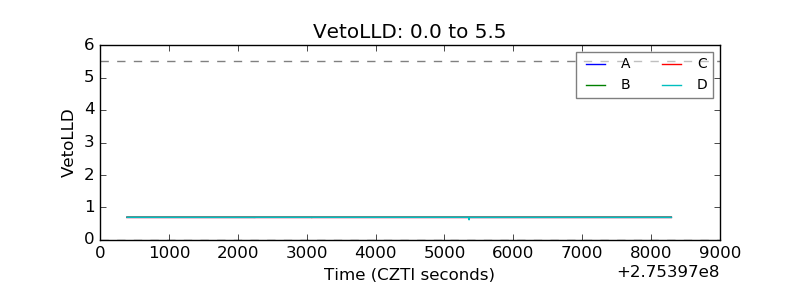 |
| Alpha Counter | 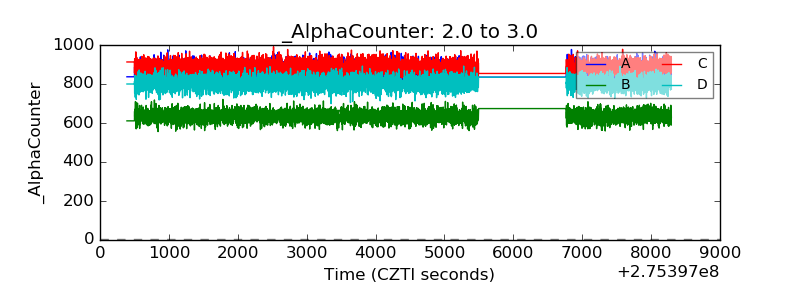 |
| _CPM_Rate | 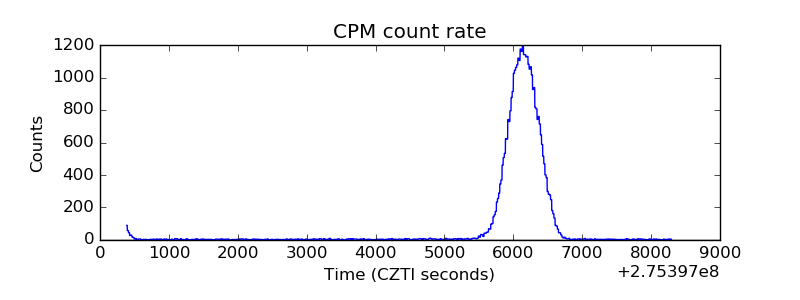 |
| CZT Counter | 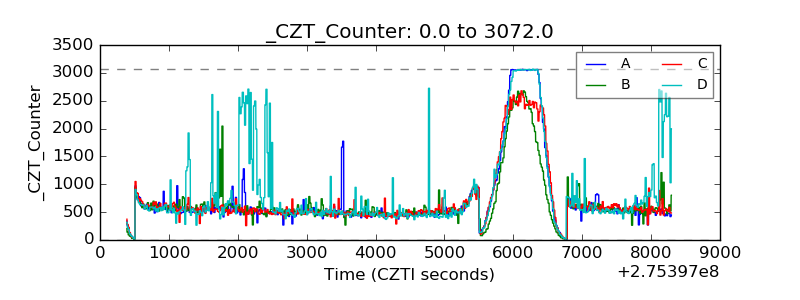 |
| +2.5 Volts monitor | 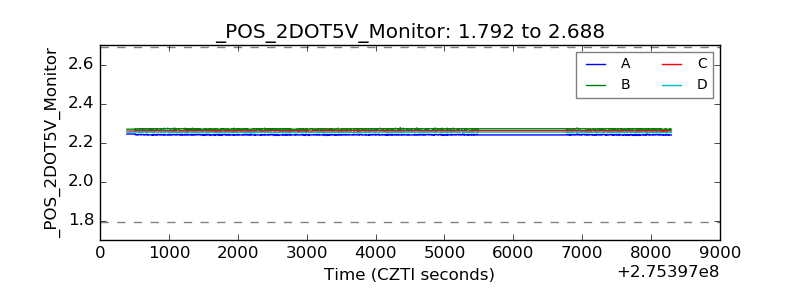 |
| +5 Volts monitor | 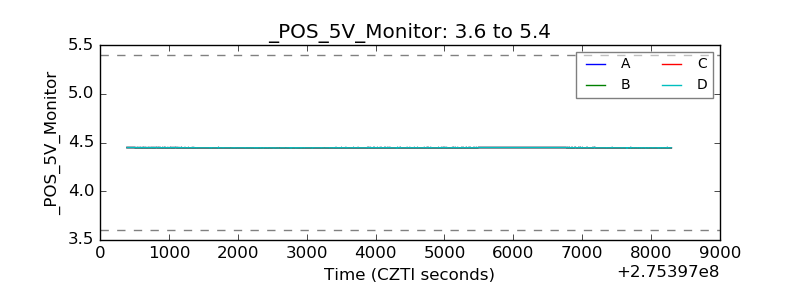 |
| _ROLL_ROT | 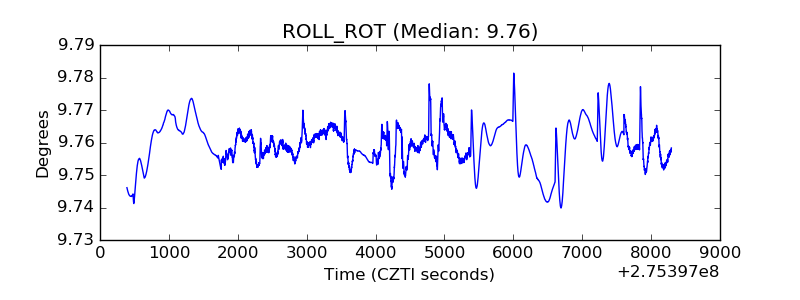 |
| _Roll_DEC | 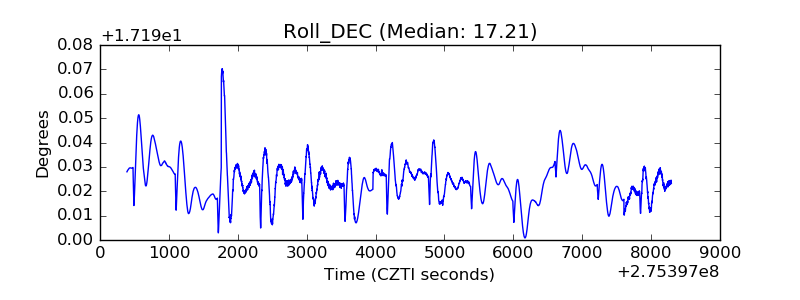 |
| _Roll_RA | 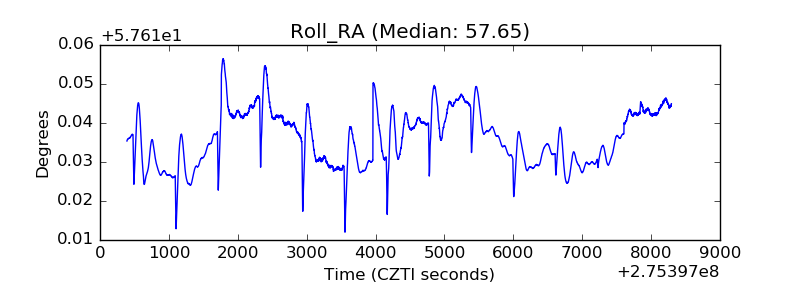 |
| Veto Counter |  |