| Param | Original file | Final file |
|---|---|---|
| Filename | modeM0/AS1T02_109T01_9000002386_16156cztM0_level2.evt | modeM0/AS1T02_109T01_9000002386_16156cztM0_level2_quad_clean.evt |
| Size (bytes) | 507,205,440 | 77,929,920 |
| Size | 483.7 MB | 74.3 MB |
| Events in quadrant A | 3,413,235 | 476,562 |
| Events in quadrant B | 3,595,392 | 482,684 |
| Events in quadrant C | 3,423,497 | 465,295 |
| Events in quadrant D | 4,463,209 | 457,499 |
| Mode M0 | |||
|---|---|---|---|
| Quadrant | BADHDUFLAG | Total packets | Discarded packets |
| A | 0 | 14542 | 3 |
| B | 0 | 15019 | 2 |
| C | 0 | 14410 | 2 |
| D | 0 | 18014 | 2 |
| Mode SS | |||
|---|---|---|---|
| Quadrant | BADHDUFLAG | Total packets | Discarded packets |
| A | 0 | 140 | 0 |
| B | 0 | 140 | 0 |
| C | 0 | 140 | 0 |
| D | 0 | 140 | 0 |
| Mode M9 | |||
|---|---|---|---|
| Quadrant | BADHDUFLAG | Total packets | Discarded packets |
| A | 0 | 19 | 0 |
| B | 0 | 19 | 0 |
| C | 0 | 19 | 0 |
| D | 0 | 19 | 0 |
| Quadrant | Total seconds | Saturated seconds | Saturation percentage |
|---|---|---|---|
| A | 6859 | 118 | 1.720367% |
| B | 6859 | 165 | 2.405598% |
| C | 6859 | 168 | 2.449337% |
| D | 6859 | 289 | 4.213442% |
Noise dominated data is calculated using 1-second bins in cleaned event files. If a bin has >2000 counts, and if more than 50% of those come from <1% of pixels, then it is considered to be noise-dominated and hence unusable.
| Quadrant | # 1 sec bins | Bins with >0 counts | Bins with >2000 counts | High rate bins dominated by noise | Noise dominated (total time) | Noise dominated (detector-on time) | Marked lightcurve |
|---|---|---|---|---|---|---|---|
| A | 8695 | 6862 | 2 | 2 | 0.02% | 0.03% | 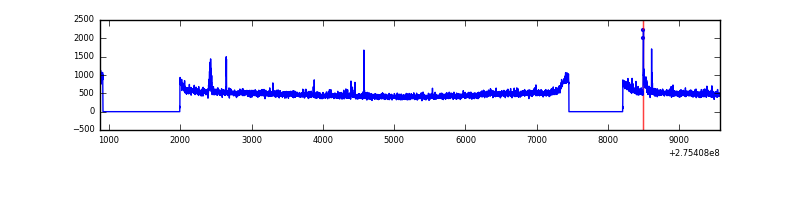 |
| B | 8695 | 6862 | 9 | 9 | 0.10% | 0.13% | 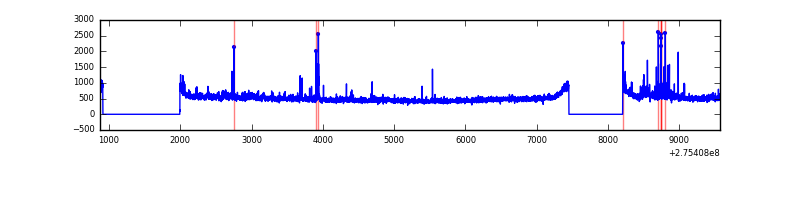 |
| C | 8695 | 6862 | 1 | 1 | 0.01% | 0.01% | 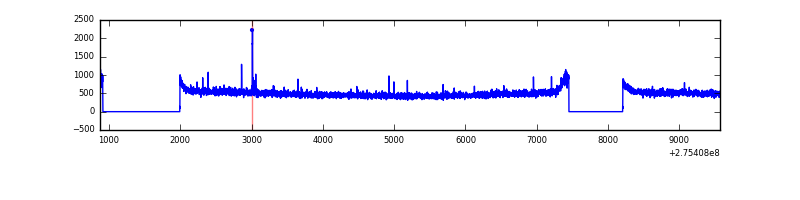 |
| D | 8695 | 6862 | 92 | 92 | 1.06% | 1.34% | 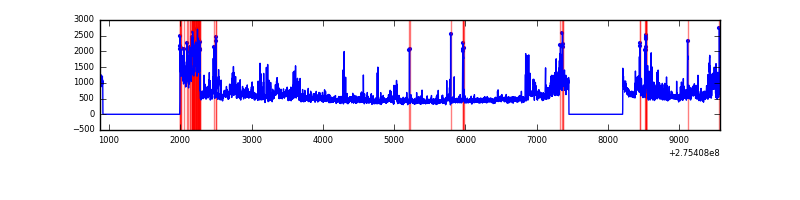 |
Top three noisy pixels from each quadrant. If the there are fewer than three noisy pixels in the level2.evt file, extra rows are filled as -1
| Pixel properties | Quadrant properties | ||||||
|---|---|---|---|---|---|---|---|
| Quadrant | DetID | PixID | Counts | Sigma | Mean | Median | Sigma |
| A | 15 | 174 | 70261 | 393.59 | 863 | 842 | 176.4 |
| A | 8 | 247 | 14658 | 78.33 | 863 | 842 | 176.4 |
| A | 9 | 143 | 7952 | 40.31 | 863 | 842 | 176.4 |
| B | 5 | 65 | 45096 | 267.26 | 861 | 841 | 165.6 |
| B | 4 | 216 | 38965 | 230.24 | 861 | 841 | 165.6 |
| B | 7 | 220 | 31806 | 187.0 | 861 | 841 | 165.6 |
| C | 14 | 238 | 126156 | 641.88 | 828 | 833 | 195.2 |
| C | 3 | 233 | 35835 | 179.27 | 828 | 833 | 195.2 |
| C | 0 | 207 | 26418 | 131.04 | 828 | 833 | 195.2 |
| D | 1 | 52 | 964617 | 4698.04 | 839 | 814 | 205.1 |
| D | 5 | 222 | 196101 | 951.92 | 839 | 814 | 205.1 |
| D | 10 | 70 | 80657 | 389.19 | 839 | 814 | 205.1 |
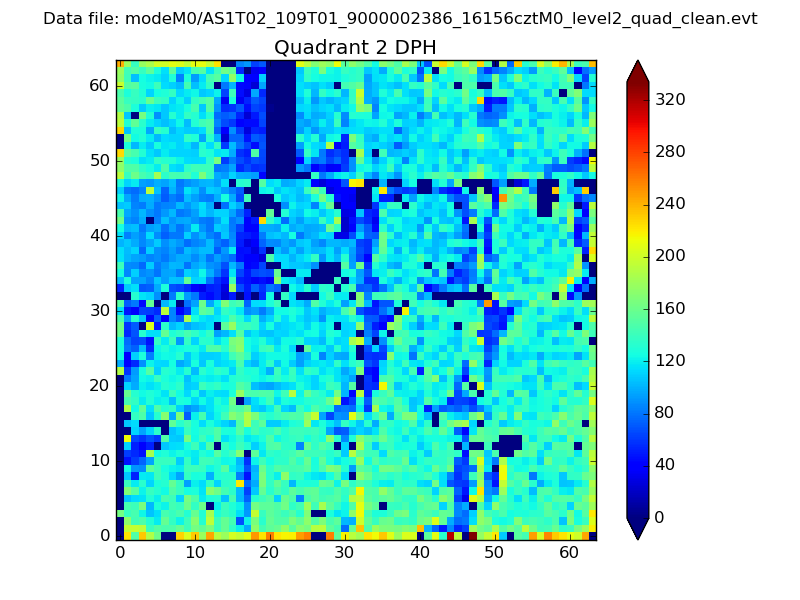
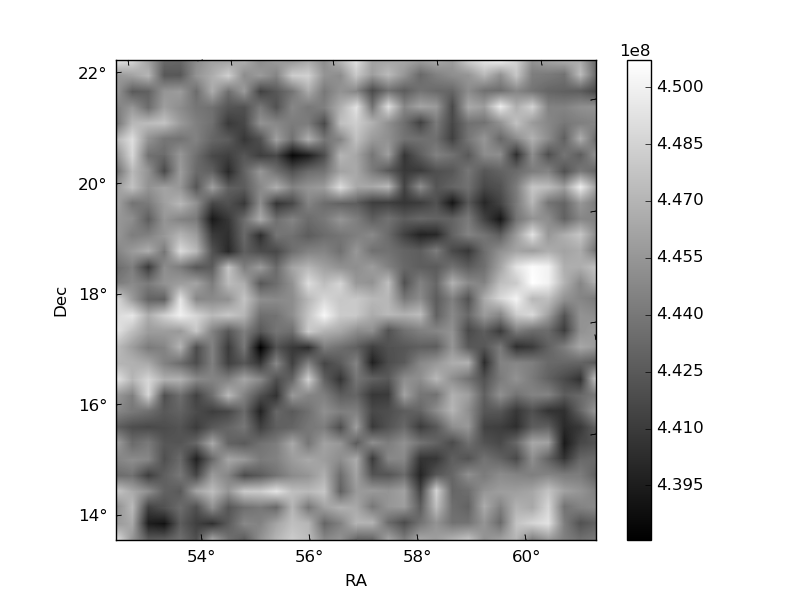
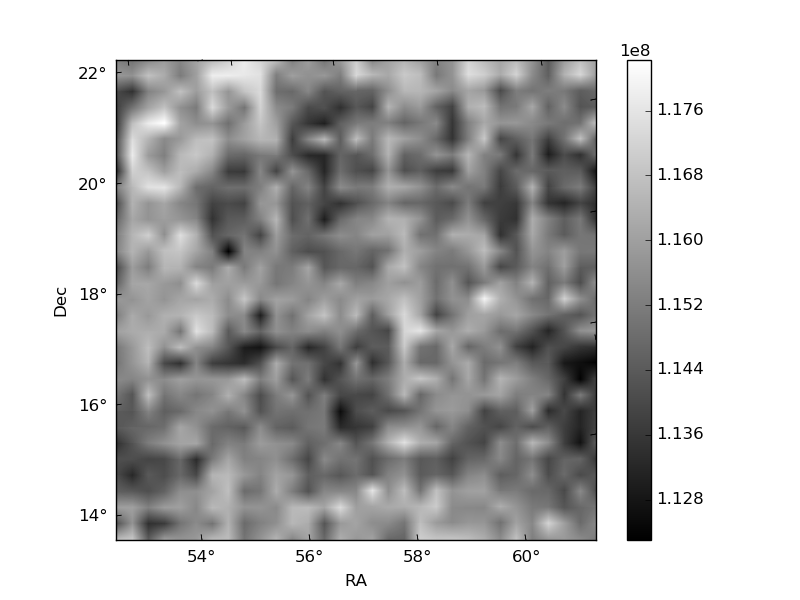
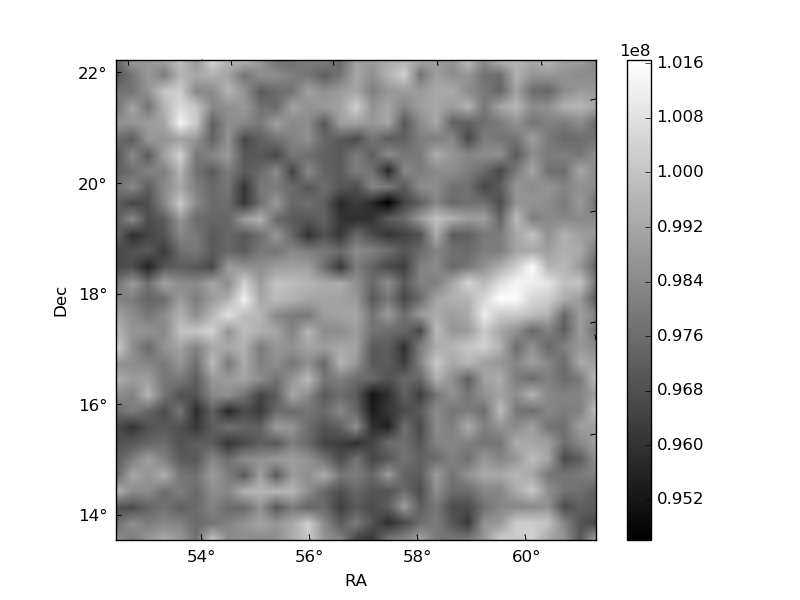
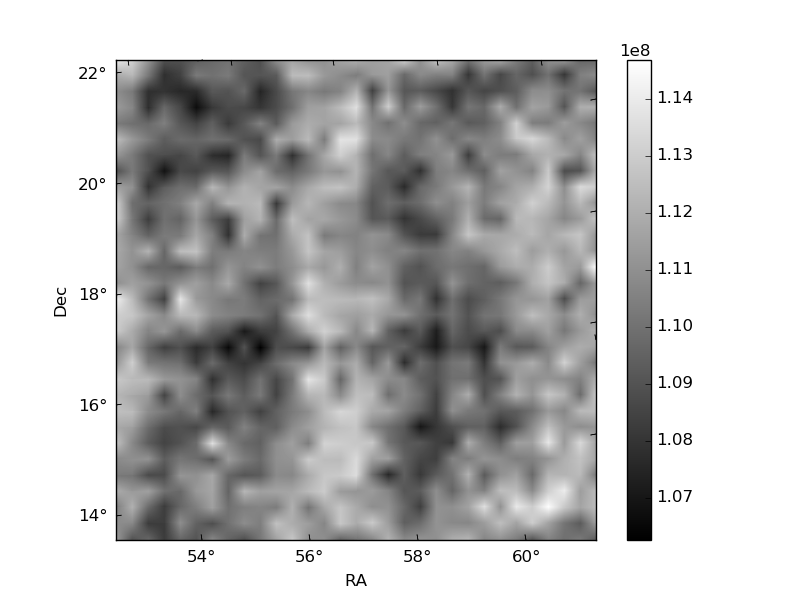
Histogram calculated using DETX and DETY for each event in the final _common_clean file
| Quadrant A | 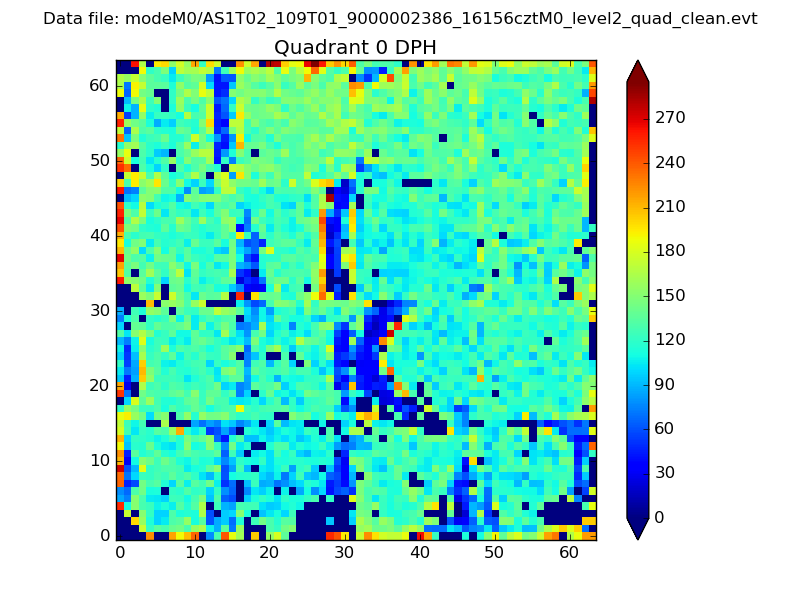 |
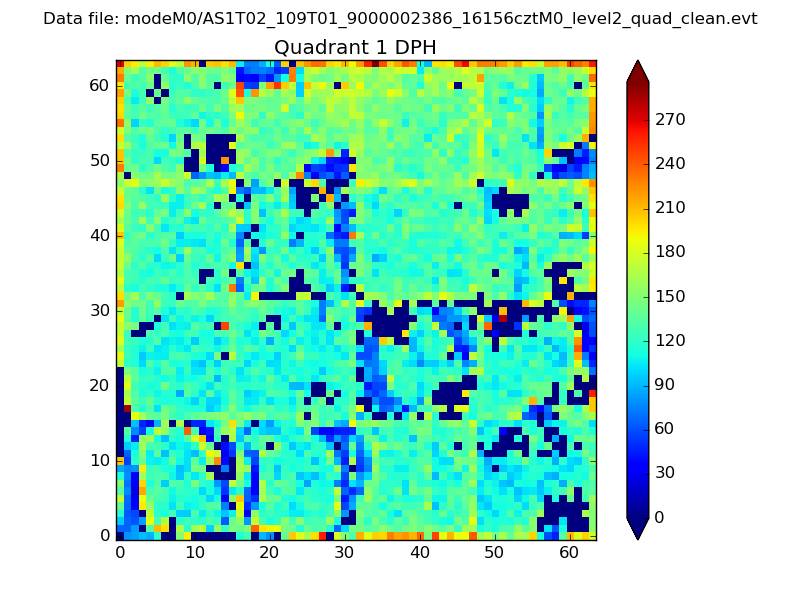 |
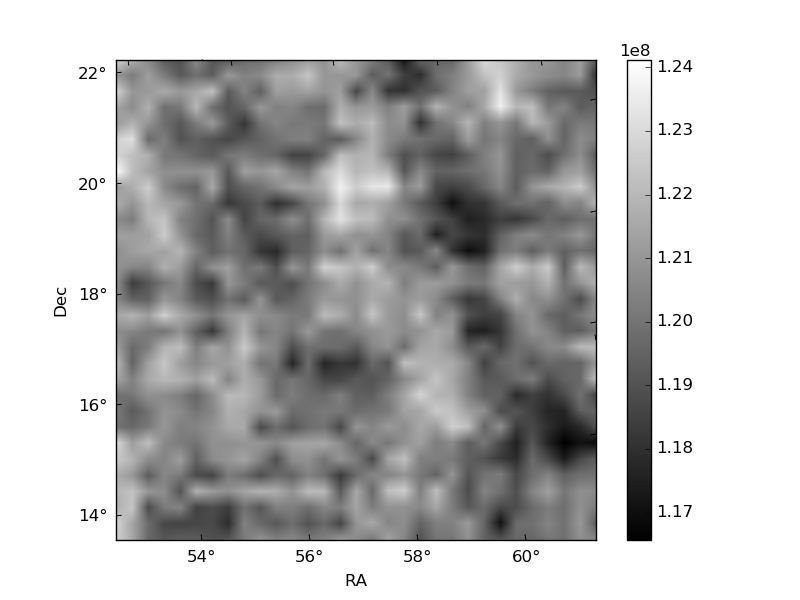
Quadrant B |
|---|---|---|---|
| Quadrant D | 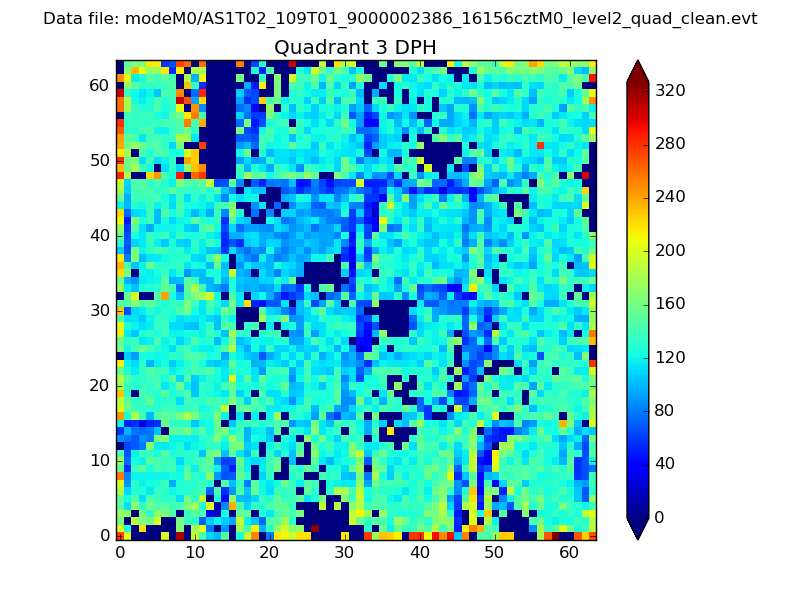 |
 |
Quadrant C |
| Plot type | Count rate plots | Images |
|---|---|---|
| Comparison with Poisson distribution Blue bars denote a histogram of data divided into 1 sec bins. Red curve is a Poisson curve with rate = median count rate of data. |
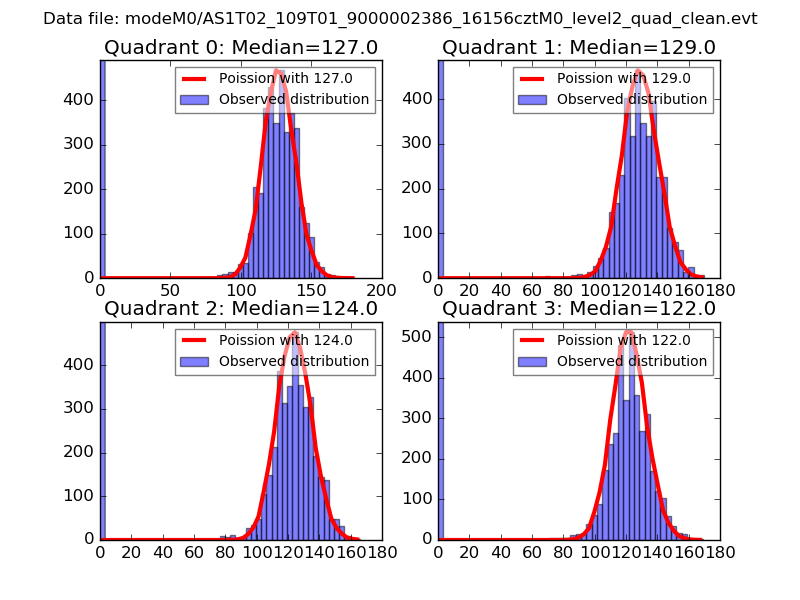 |
 |
| Quadrant-wise count rates Data is divided into 100 sec bins |
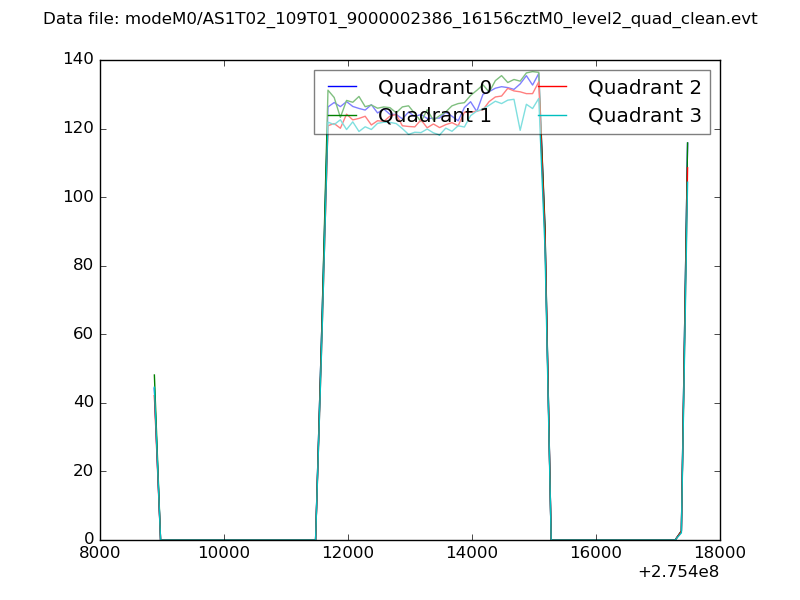 |
|
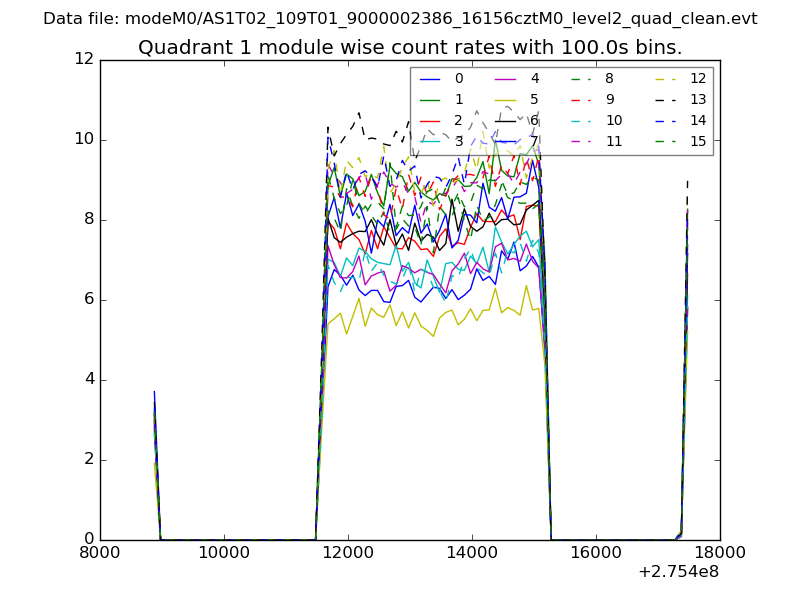
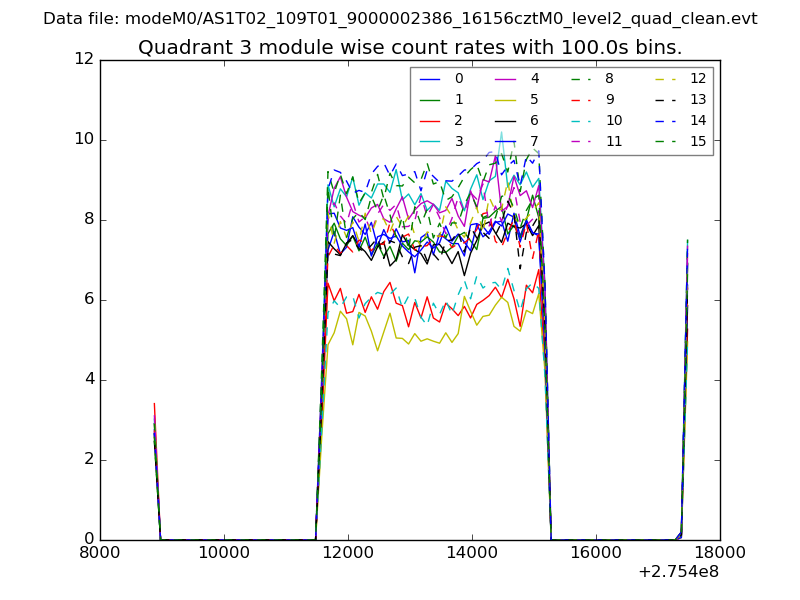
| Module-wise count rates for Quadrant A Data is divided into 100 sec bins |
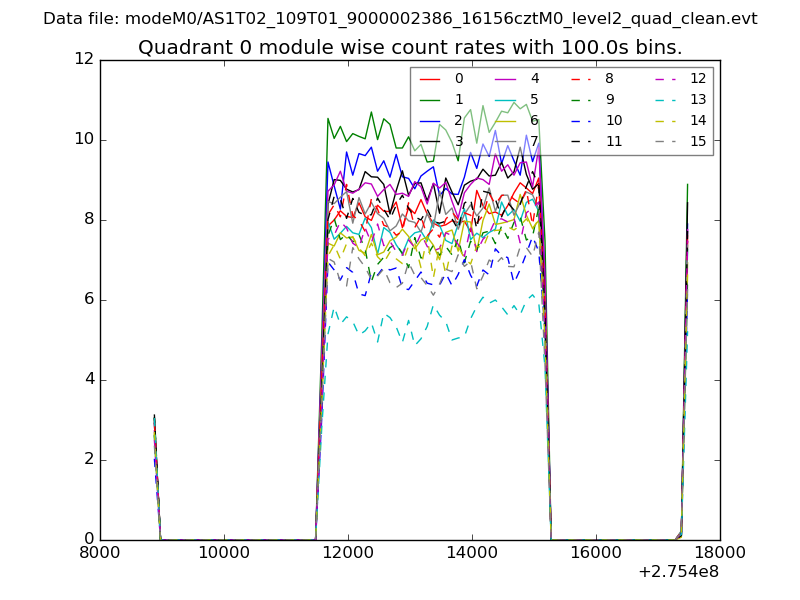 |
 |
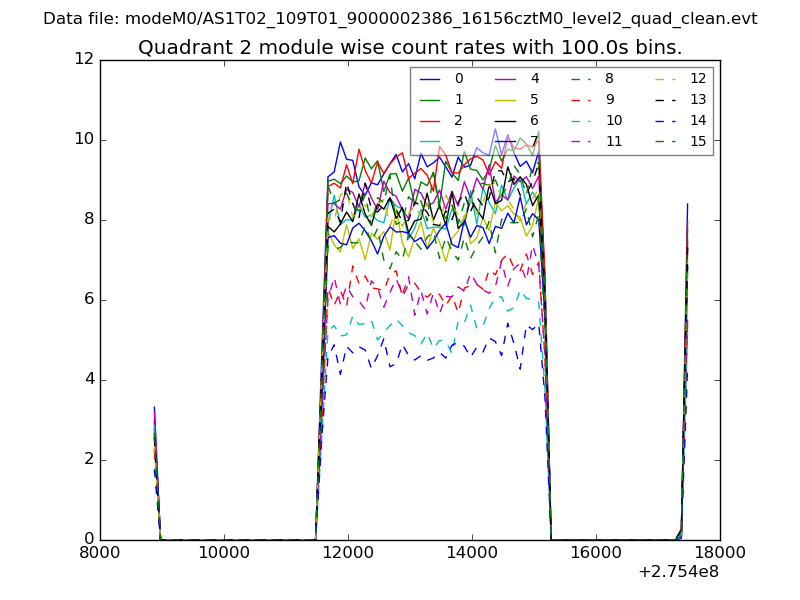
| Module-wise count rates for Quadrant B Data is divided into 100 sec bins |
 |
 |
| Module-wise count rates for Quadrant C Data is divided into 100 sec bins |
 |
 |
| Module-wise count rates for Quadrant D Data is divided into 100 sec bins |
 |
 |
| Parameter | Plot |
|---|---|
| CZT HV Monitor | 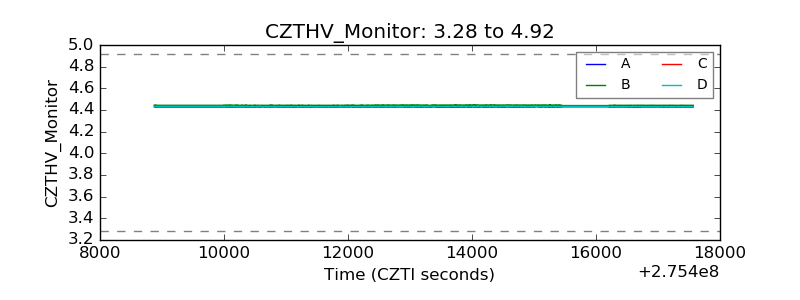 |
| D_VDD | 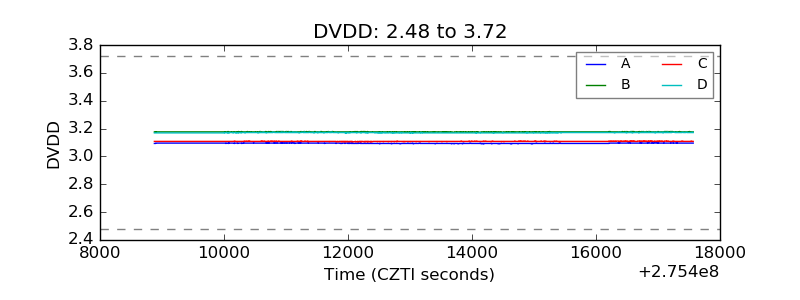 |
| Temperature 1 | 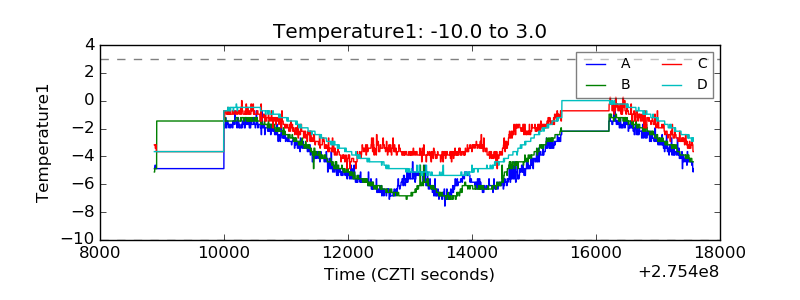 |
| Veto HV Monitor | 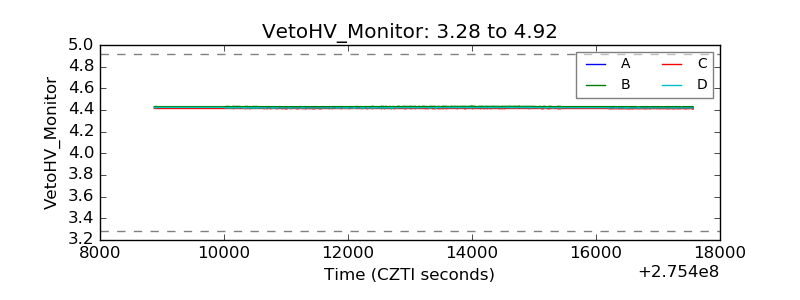 |
| Veto LLD | 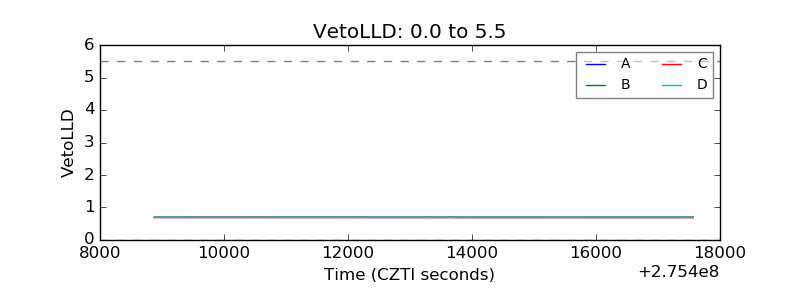 |
| Alpha Counter | 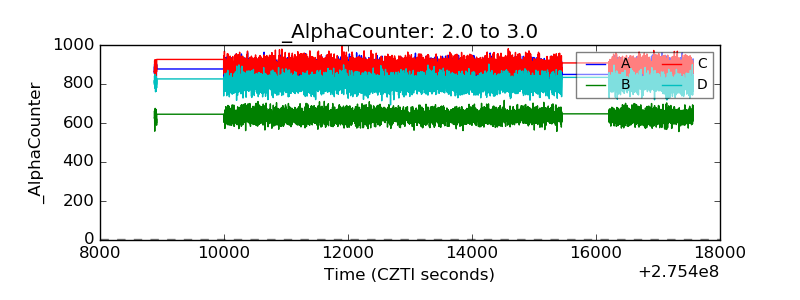 |
| _CPM_Rate | 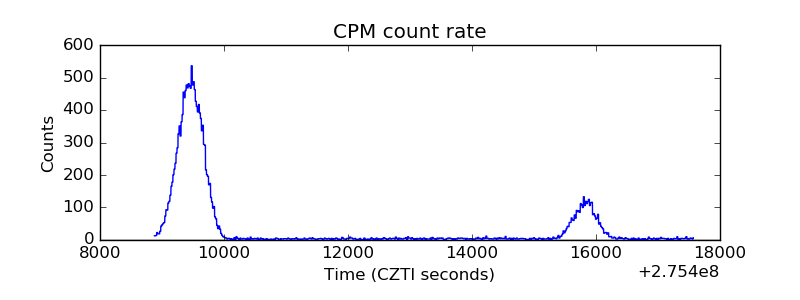 |
| CZT Counter | 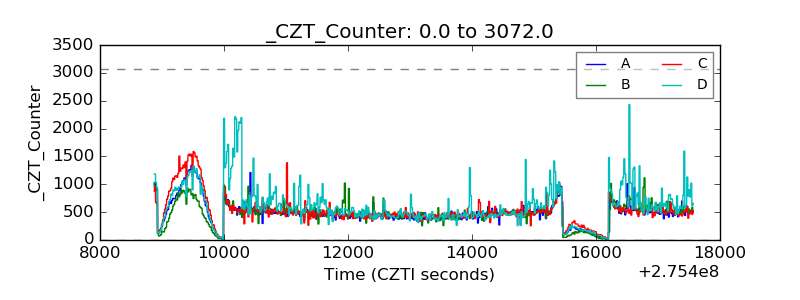 |
| +2.5 Volts monitor |  |
| +5 Volts monitor |  |
| _ROLL_ROT | 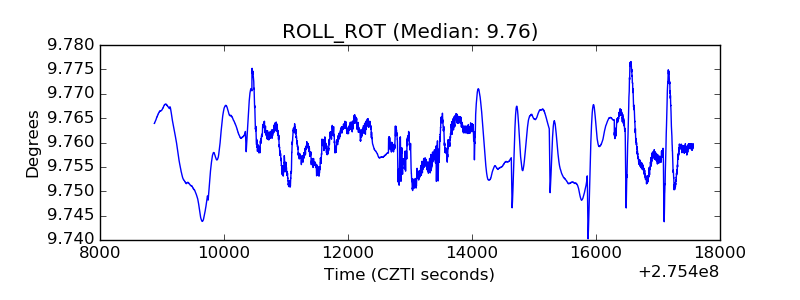 |
| _Roll_DEC | 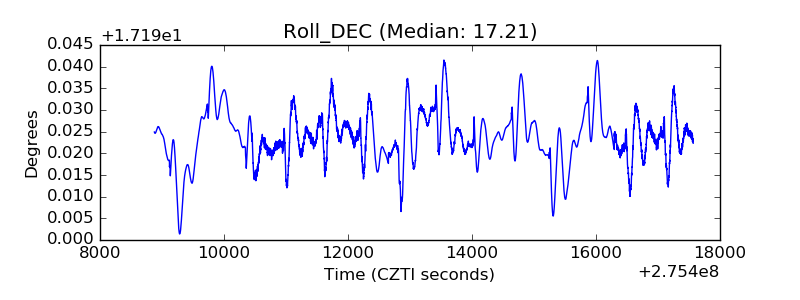 |
| _Roll_RA | 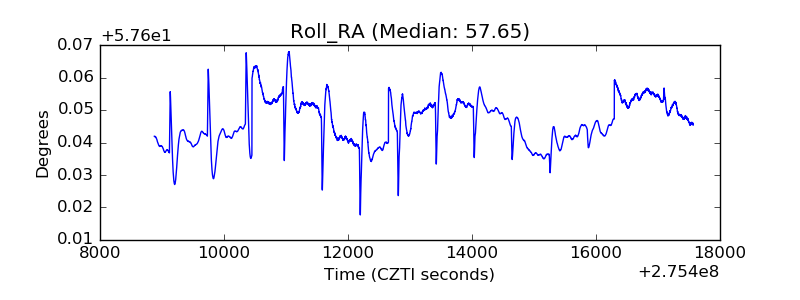 |
| Veto Counter | 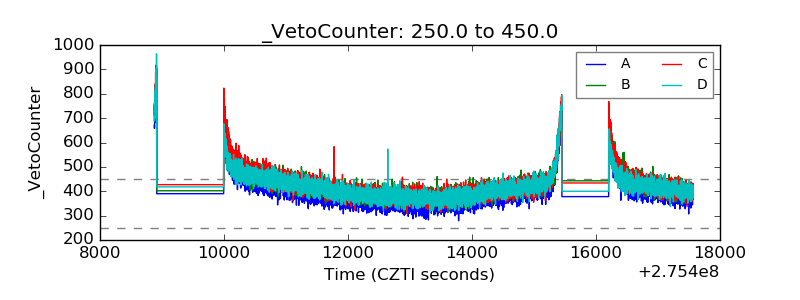 |