| Param | Original file | Final file |
|---|---|---|
| Filename | modeM0/AS1T02_109T01_9000002386_16158cztM0_level2.evt | modeM0/AS1T02_109T01_9000002386_16158cztM0_level2_quad_clean.evt |
| Size (bytes) | 586,005,120 | 86,817,600 |
| Size | 558.9 MB | 82.8 MB |
| Events in quadrant A | 3,366,974 | 567,378 |
| Events in quadrant B | 3,543,053 | 579,827 |
| Events in quadrant C | 3,461,094 | 555,932 |
| Events in quadrant D | 6,898,257 | 434,817 |
| Mode M0 | |||
|---|---|---|---|
| Quadrant | BADHDUFLAG | Total packets | Discarded packets |
| A | 0 | 14806 | 2 |
| B | 0 | 15052 | 1 |
| C | 0 | 14908 | 1 |
| D | 0 | 25470 | 1 |
| Mode SS | |||
|---|---|---|---|
| Quadrant | BADHDUFLAG | Total packets | Discarded packets |
| A | 0 | 142 | 0 |
| B | 0 | 142 | 0 |
| C | 0 | 142 | 0 |
| D | 0 | 142 | 0 |
| Mode M9 | |||
|---|---|---|---|
| Quadrant | BADHDUFLAG | Total packets | Discarded packets |
| A | 0 | 3 | 0 |
| B | 0 | 3 | 0 |
| C | 0 | 3 | 0 |
| D | 0 | 3 | 0 |
| Quadrant | Total seconds | Saturated seconds | Saturation percentage |
|---|---|---|---|
| A | 7046 | 45 | 0.638660% |
| B | 7046 | 91 | 1.291513% |
| C | 7046 | 104 | 1.476015% |
| D | 7046 | 1511 | 21.444791% |
Noise dominated data is calculated using 1-second bins in cleaned event files. If a bin has >2000 counts, and if more than 50% of those come from <1% of pixels, then it is considered to be noise-dominated and hence unusable.
| Quadrant | # 1 sec bins | Bins with >0 counts | Bins with >2000 counts | High rate bins dominated by noise | Noise dominated (total time) | Noise dominated (detector-on time) | Marked lightcurve |
|---|---|---|---|---|---|---|---|
| A | 7327 | 7048 | 2 | 2 | 0.03% | 0.03% | 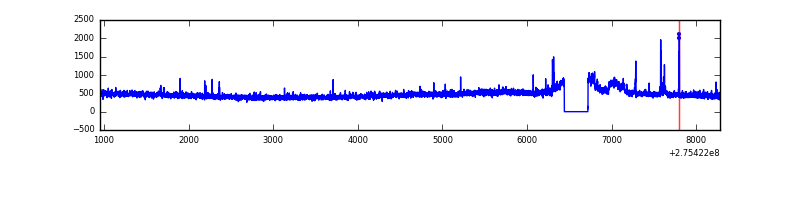 |
| B | 7327 | 7048 | 7 | 7 | 0.10% | 0.10% | 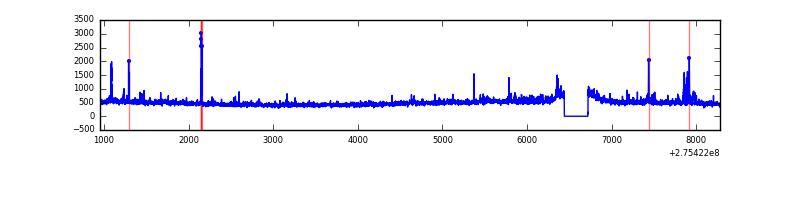 |
| C | 7327 | 7048 | 0 | 0 | 0.00% | 0.00% | 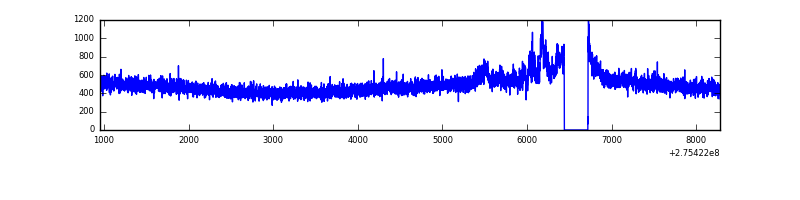 |
| D | 7327 | 7048 | 1275 | 1275 | 17.40% | 18.09% | 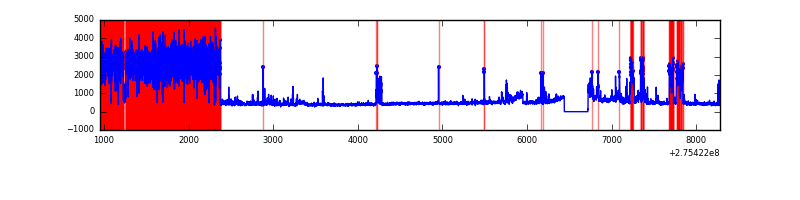 |
Top three noisy pixels from each quadrant. If the there are fewer than three noisy pixels in the level2.evt file, extra rows are filled as -1
| Pixel properties | Quadrant properties | ||||||
|---|---|---|---|---|---|---|---|
| Quadrant | DetID | PixID | Counts | Sigma | Mean | Median | Sigma |
| A | 15 | 174 | 57890 | 330.02 | 843 | 823 | 172.9 |
| A | 0 | 253 | 54632 | 311.18 | 843 | 823 | 172.9 |
| A | 8 | 247 | 8706 | 45.59 | 843 | 823 | 172.9 |
| B | 0 | 197 | 55423 | 337.14 | 846 | 826 | 161.9 |
| B | 4 | 142 | 26832 | 160.59 | 846 | 826 | 161.9 |
| B | 0 | 189 | 25218 | 150.62 | 846 | 826 | 161.9 |
| C | 3 | 233 | 159563 | 830.9 | 809 | 812 | 191.1 |
| C | 14 | 238 | 123212 | 640.64 | 809 | 812 | 191.1 |
| C | 8 | 128 | 10052 | 48.36 | 809 | 812 | 191.1 |
| D | 5 | 222 | 3631985 | 21547.5 | 683 | 662 | 168.5 |
| D | 1 | 52 | 570888 | 3383.6 | 683 | 662 | 168.5 |
| D | 10 | 70 | 86555 | 509.67 | 683 | 662 | 168.5 |
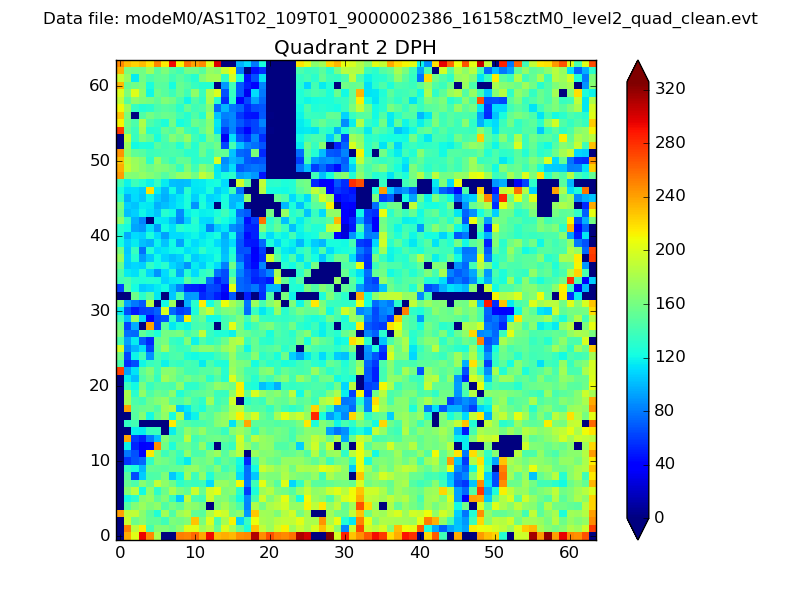
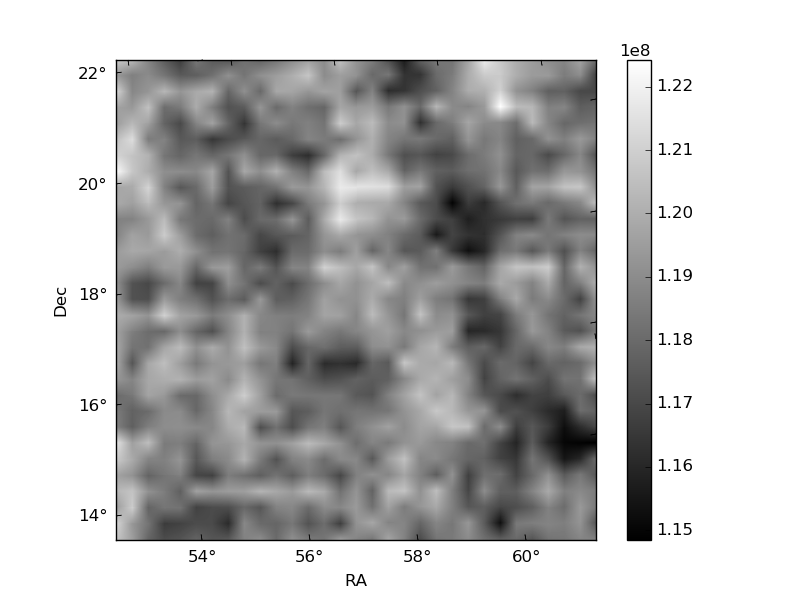
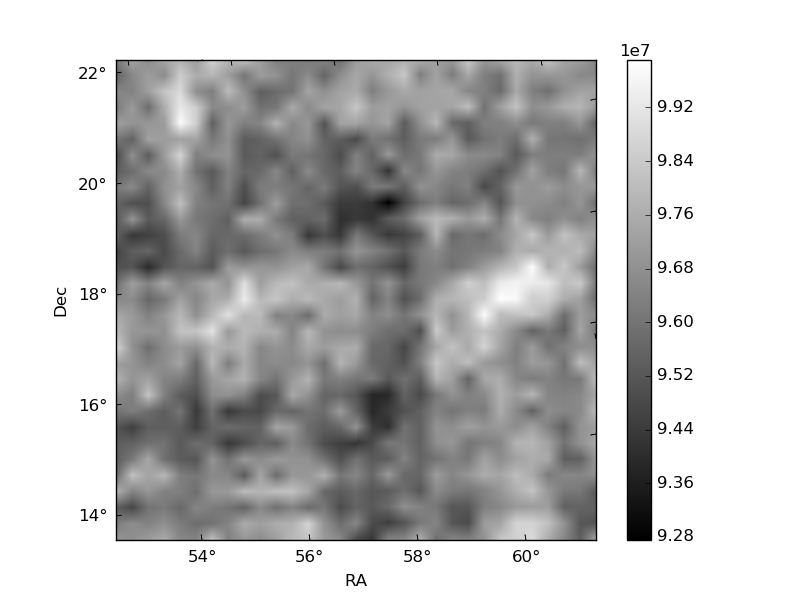
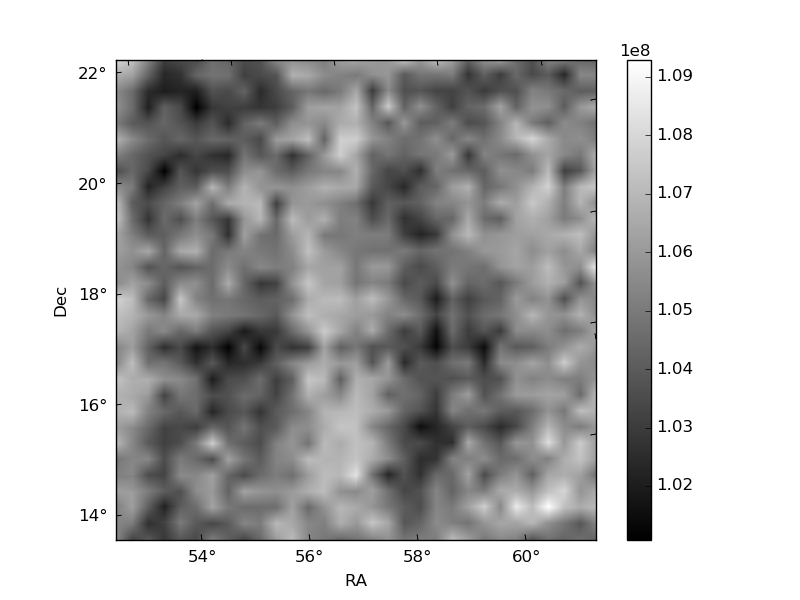
Histogram calculated using DETX and DETY for each event in the final _common_clean file
| Quadrant A | 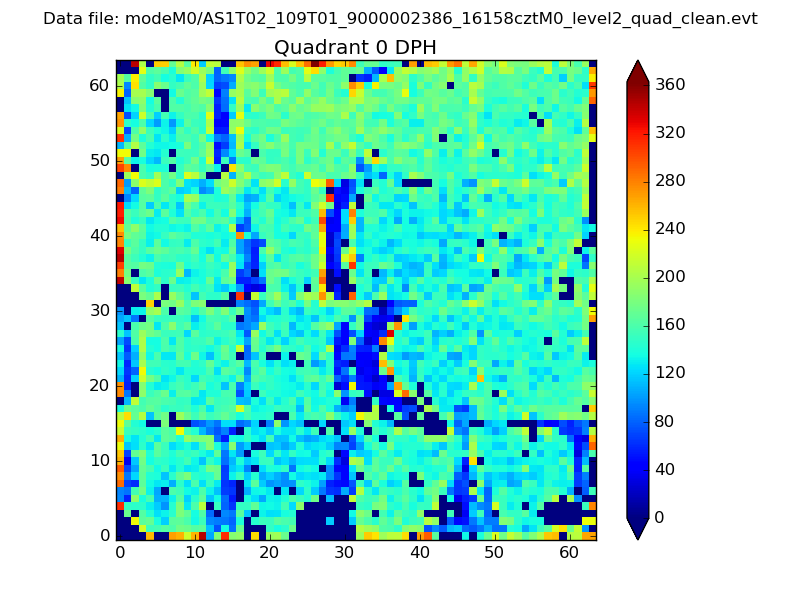 |
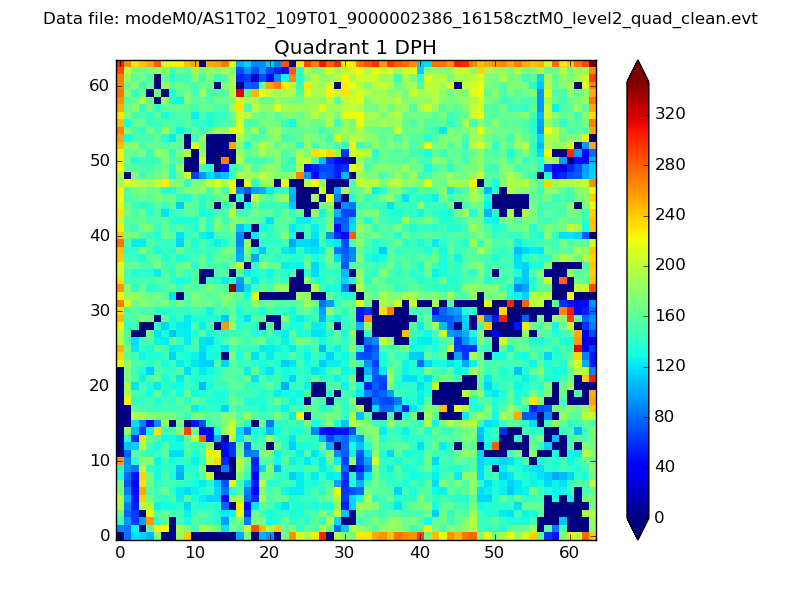 |
Quadrant B |
|---|---|---|---|
| Quadrant D | 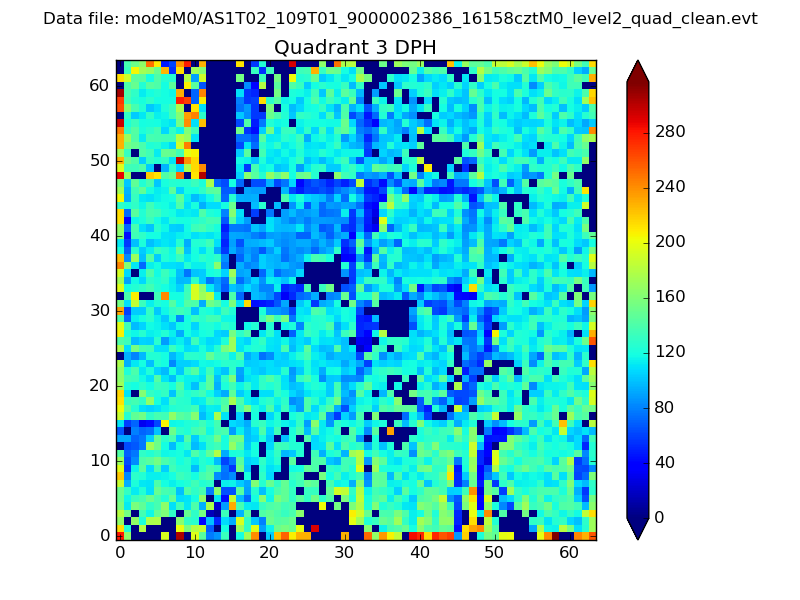 |
 |
Quadrant C |
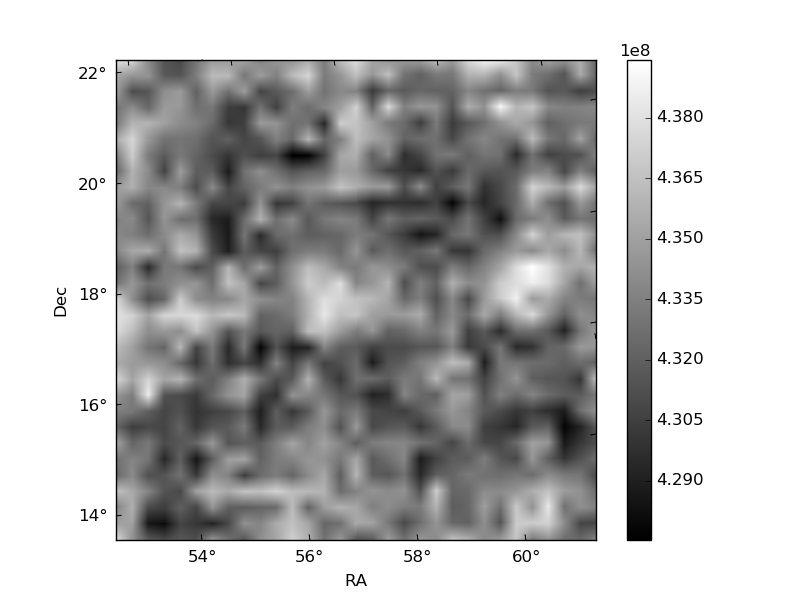
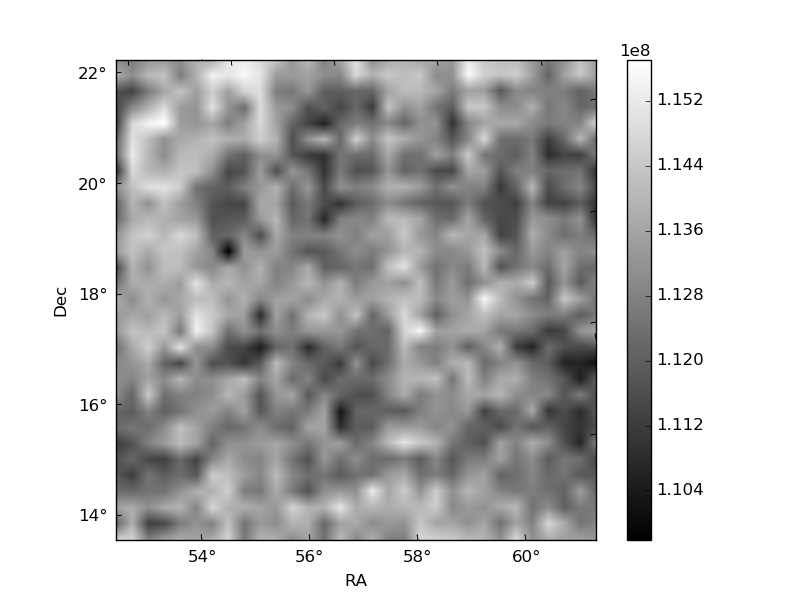
| Plot type | Count rate plots | Images |
|---|---|---|
| Comparison with Poisson distribution Blue bars denote a histogram of data divided into 1 sec bins. Red curve is a Poisson curve with rate = median count rate of data. |
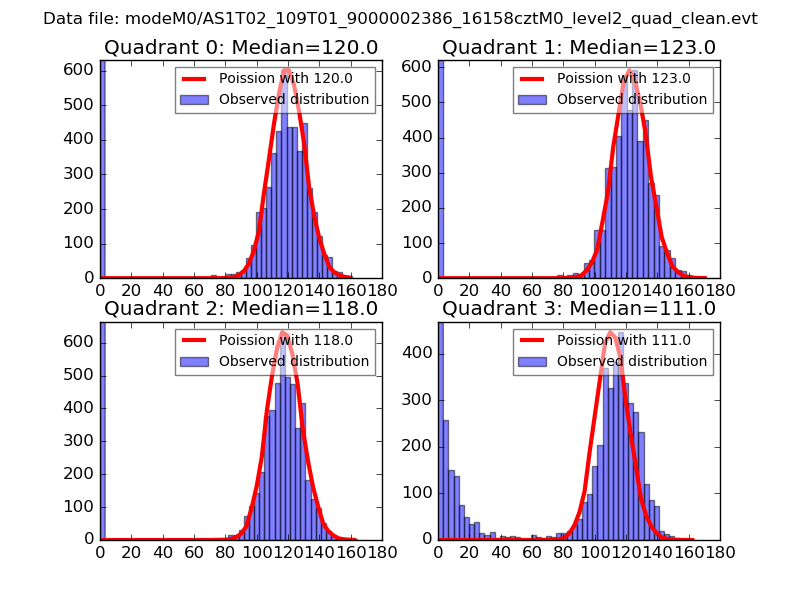 |
 |
| Quadrant-wise count rates Data is divided into 100 sec bins |
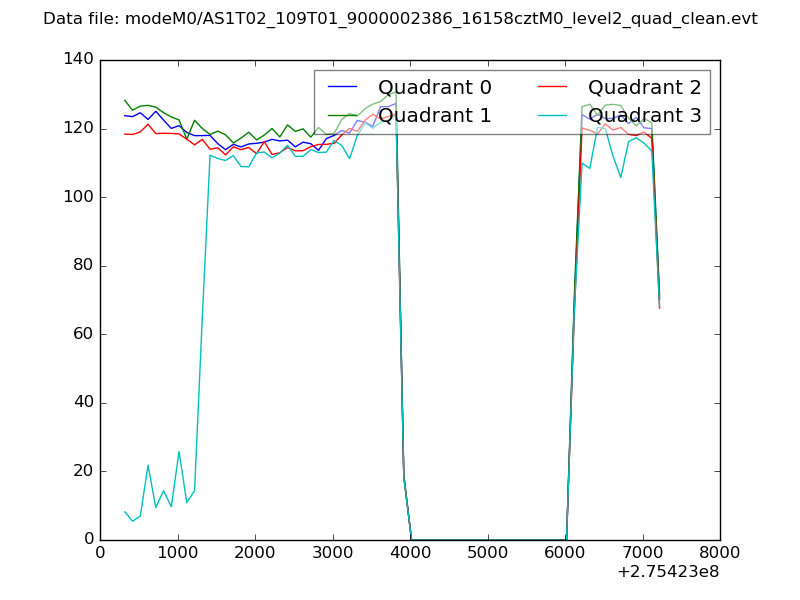 |
|
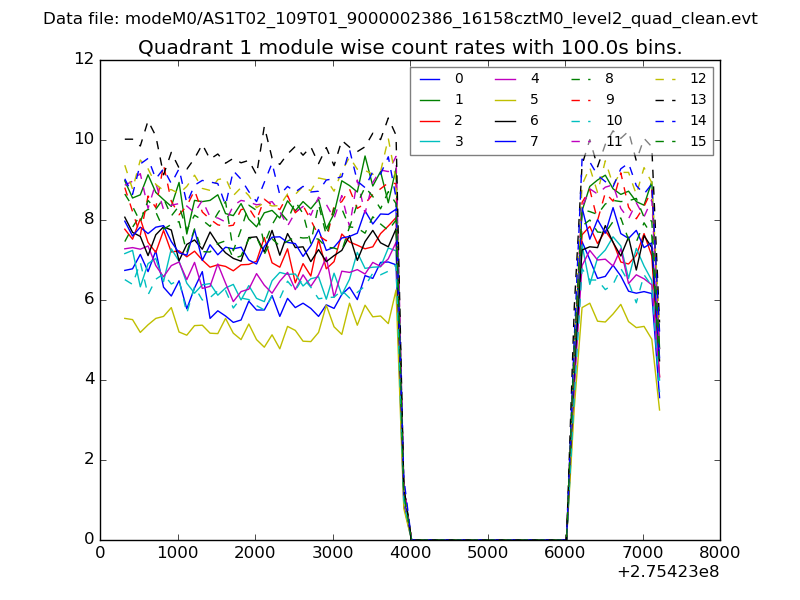
| Module-wise count rates for Quadrant A Data is divided into 100 sec bins |
 |
 |
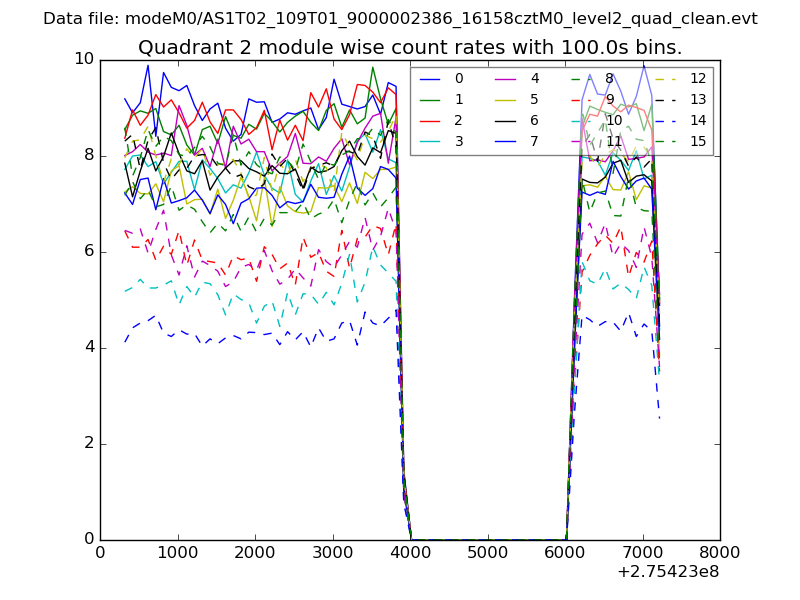
| Module-wise count rates for Quadrant B Data is divided into 100 sec bins |
 |
 |
| Module-wise count rates for Quadrant C Data is divided into 100 sec bins |
 |
 |
| Module-wise count rates for Quadrant D Data is divided into 100 sec bins |
 |
 |
| Parameter | Plot |
|---|---|
| CZT HV Monitor |  |
| D_VDD | 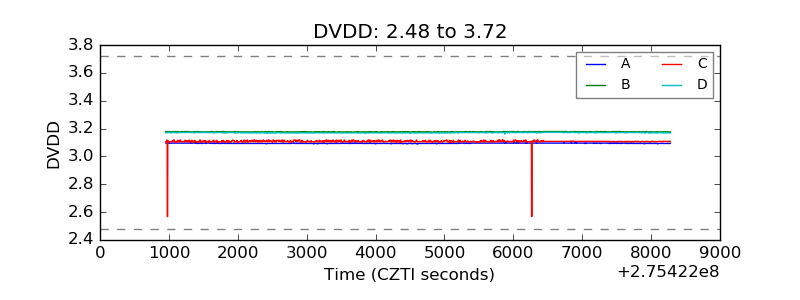 |
| Temperature 1 |  |
| Veto HV Monitor | 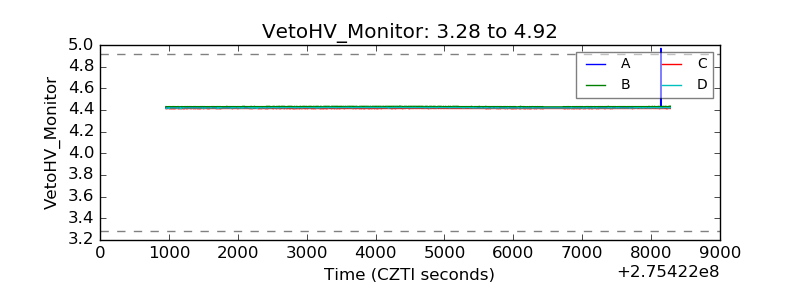 |
| Veto LLD | 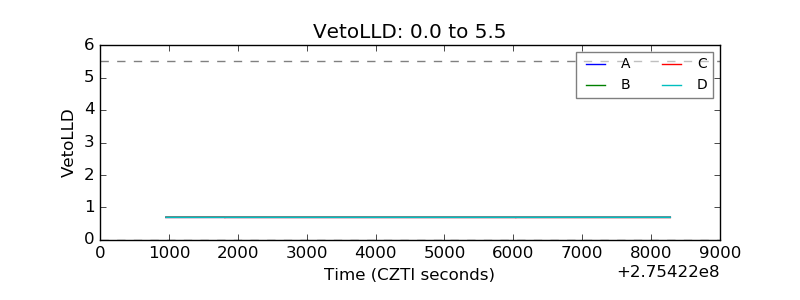 |
| Alpha Counter | 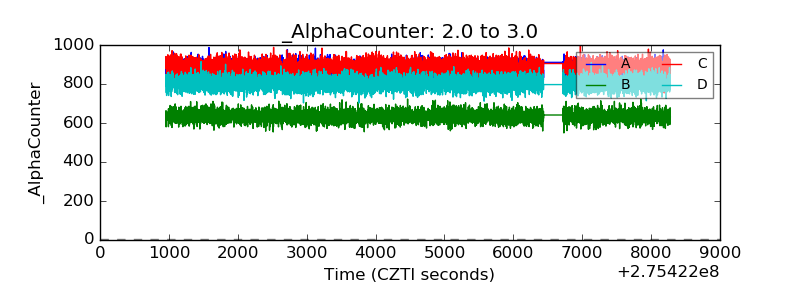 |
| _CPM_Rate | 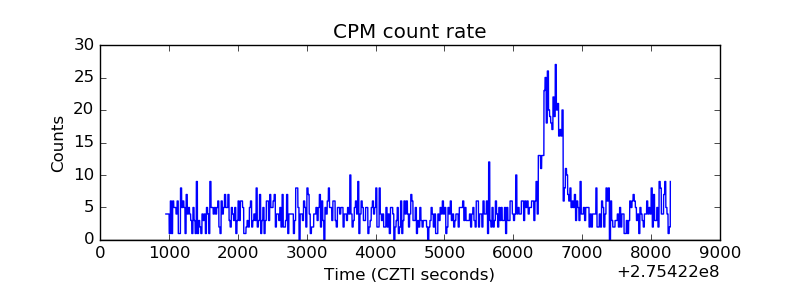 |
| CZT Counter | 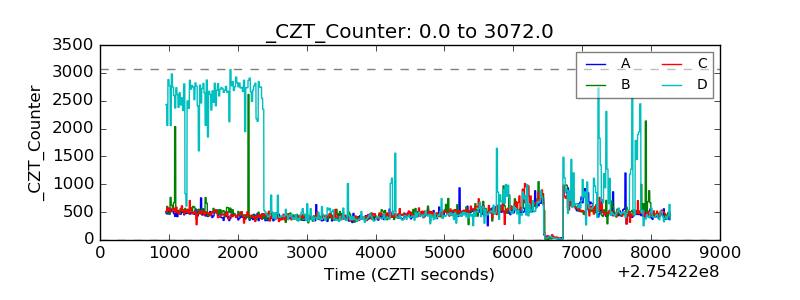 |
| +2.5 Volts monitor |  |
| +5 Volts monitor |  |
| _ROLL_ROT | 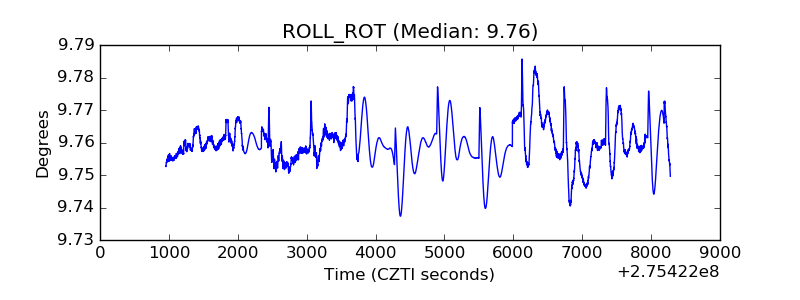 |
| _Roll_DEC | 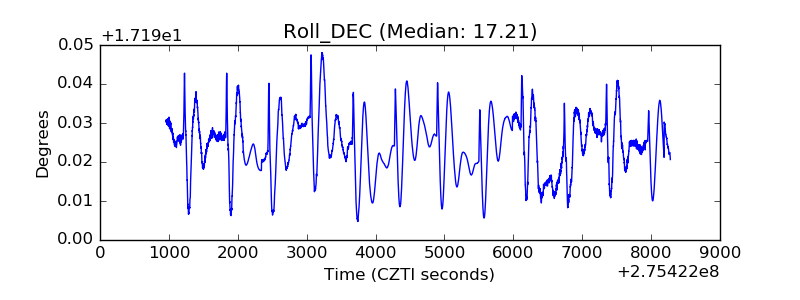 |
| _Roll_RA | 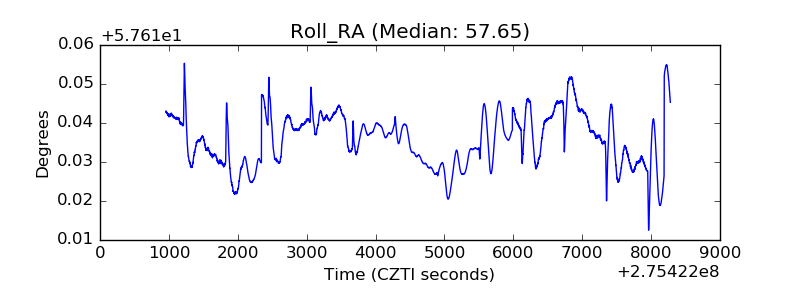 |
| Veto Counter | 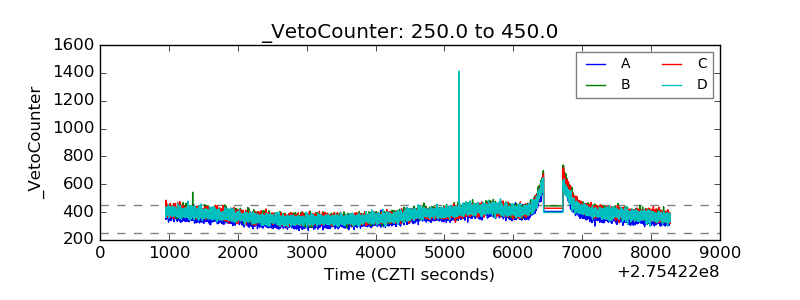 |