| Param | Original file | Final file |
|---|---|---|
| Filename | modeM0/AS1T02_109T01_9000002386_16163cztM0_level2.evt | modeM0/AS1T02_109T01_9000002386_16163cztM0_level2_quad_clean.evt |
| Size (bytes) | 1,646,061,120 | 303,013,440 |
| Size | 1.5 GB | 289.0 MB |
| Events in quadrant A | 13,033,037 | 1,884,169 |
| Events in quadrant B | 11,880,617 | 1,939,585 |
| Events in quadrant C | 11,440,541 | 1,851,902 |
| Events in quadrant D | 11,838,033 | 1,814,021 |
| Mode M0 | |||
|---|---|---|---|
| Quadrant | BADHDUFLAG | Total packets | Discarded packets |
| A | 0 | 69720 | 13877 |
| B | 0 | 61925 | 10308 |
| C | 0 | 60091 | 9921 |
| D | 0 | 62918 | 9926 |
| Mode SS | |||
|---|---|---|---|
| Quadrant | BADHDUFLAG | Total packets | Discarded packets |
| A | 0 | 597 | 105 |
| B | 0 | 597 | 96 |
| C | 0 | 600 | 98 |
| D | 0 | 601 | 89 |
| Mode M9 | |||
|---|---|---|---|
| Quadrant | BADHDUFLAG | Total packets | Discarded packets |
| A | 0 | 36 | 11 |
| B | 0 | 36 | 12 |
| C | 0 | 36 | 7 |
| D | 0 | 36 | 11 |
| Quadrant | Total seconds | Saturated seconds | Saturation percentage |
|---|---|---|---|
| A | 24506 | 548 | 2.236187% |
| B | 24545 | 234 | 0.953351% |
| C | 24471 | 202 | 0.825467% |
| D | 24528 | 223 | 0.909165% |
Noise dominated data is calculated using 1-second bins in cleaned event files. If a bin has >2000 counts, and if more than 50% of those come from <1% of pixels, then it is considered to be noise-dominated and hence unusable.
| Quadrant | # 1 sec bins | Bins with >0 counts | Bins with >2000 counts | High rate bins dominated by noise | Noise dominated (total time) | Noise dominated (detector-on time) | Marked lightcurve |
|---|---|---|---|---|---|---|---|
| A | 32928 | 25058 | 203 | 203 | 0.62% | 0.81% | 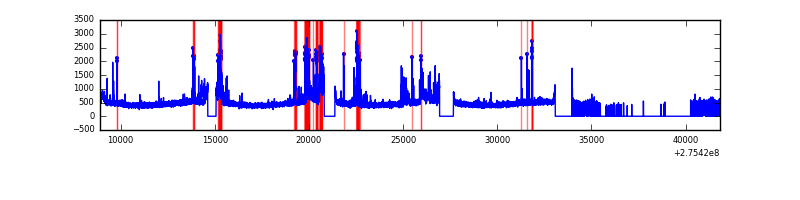 |
| B | 32928 | 25068 | 38 | 38 | 0.12% | 0.15% | 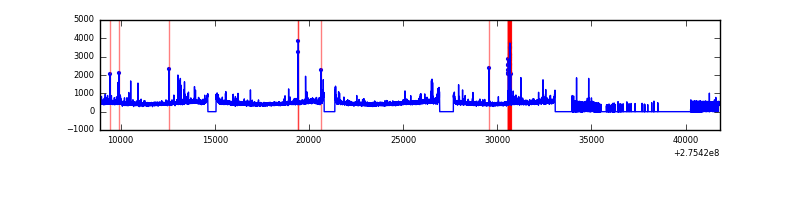 |
| C | 32928 | 25037 | 2 | 2 | 0.01% | 0.01% | 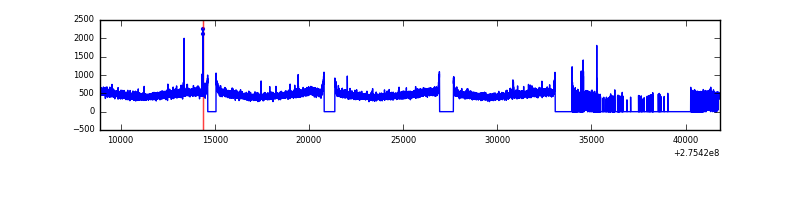 |
| D | 32928 | 25114 | 154 | 154 | 0.47% | 0.61% | 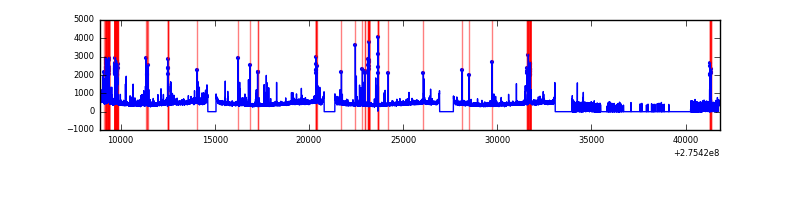 |
Top three noisy pixels from each quadrant. If the there are fewer than three noisy pixels in the level2.evt file, extra rows are filled as -1
| Pixel properties | Quadrant properties | ||||||
|---|---|---|---|---|---|---|---|
| Quadrant | DetID | PixID | Counts | Sigma | Mean | Median | Sigma |
| A | 15 | 174 | 1826743 | 3165.01 | 2867 | 2804 | 576.3 |
| A | 0 | 253 | 73566 | 122.79 | 2867 | 2804 | 576.3 |
| A | 8 | 247 | 61471 | 101.8 | 2867 | 2804 | 576.3 |
| B | 4 | 142 | 180623 | 323.16 | 2899 | 2830 | 550.2 |
| B | 0 | 229 | 86503 | 152.09 | 2899 | 2830 | 550.2 |
| B | 0 | 189 | 72151 | 126.0 | 2899 | 2830 | 550.2 |
| C | 14 | 238 | 424093 | 651.68 | 2763 | 2777 | 646.5 |
| C | 3 | 233 | 222993 | 340.63 | 2763 | 2777 | 646.5 |
| C | 0 | 207 | 27832 | 38.75 | 2763 | 2777 | 646.5 |
| D | 1 | 52 | 688843 | 1000.39 | 2802 | 2719 | 685.9 |
| D | 10 | 70 | 260099 | 375.27 | 2802 | 2719 | 685.9 |
| D | 7 | 38 | 184108 | 264.47 | 2802 | 2719 | 685.9 |
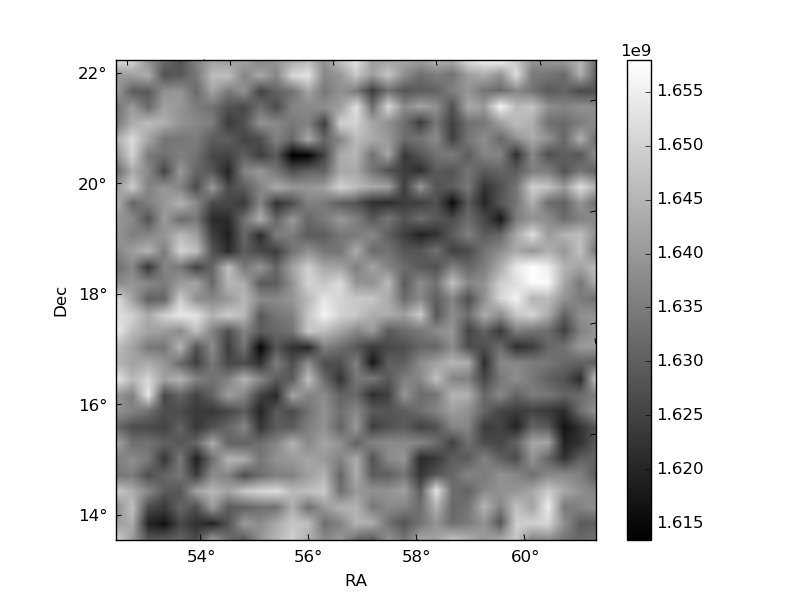
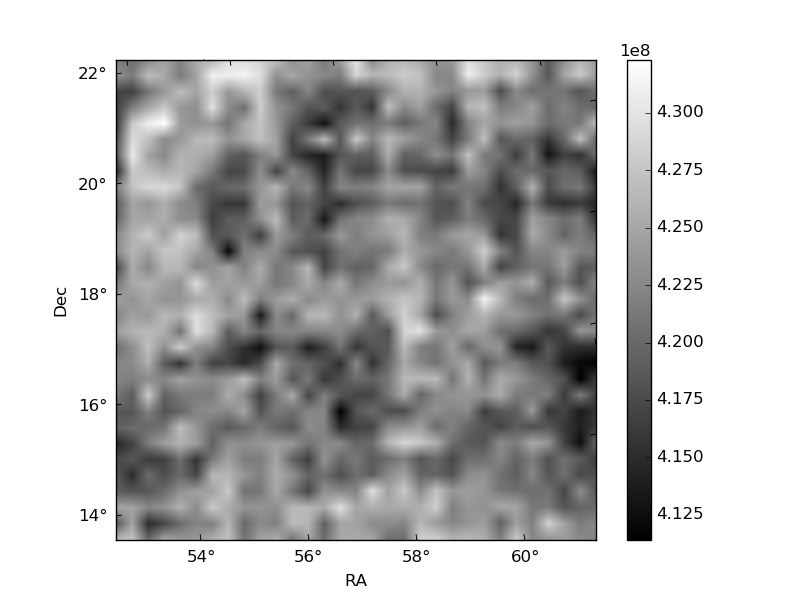
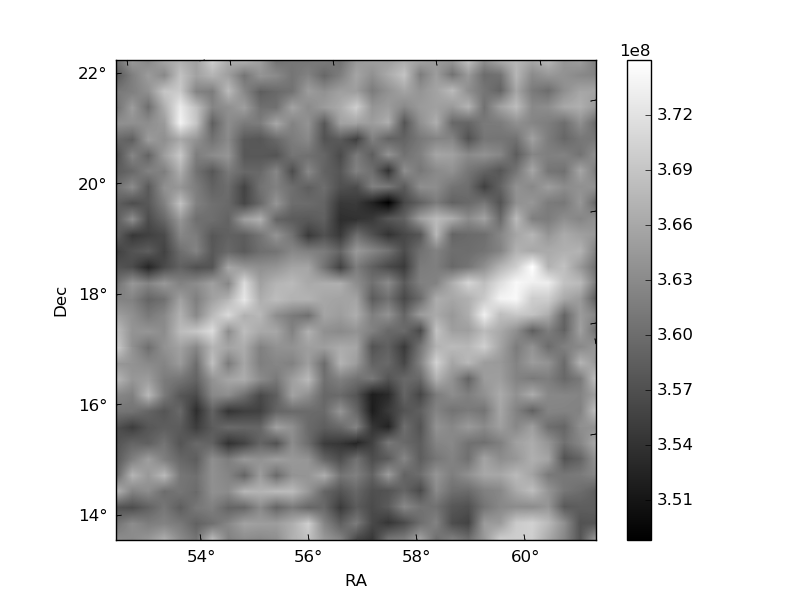
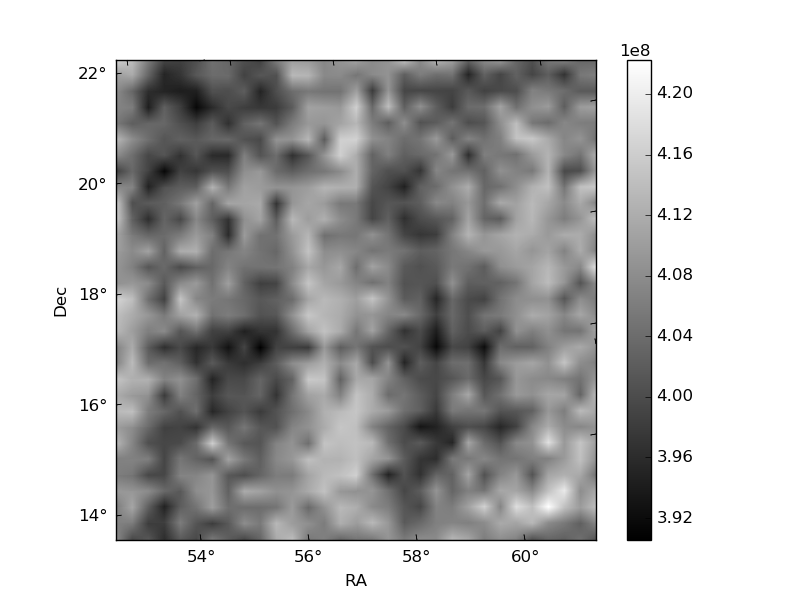
Histogram calculated using DETX and DETY for each event in the final _common_clean file
| Quadrant A | 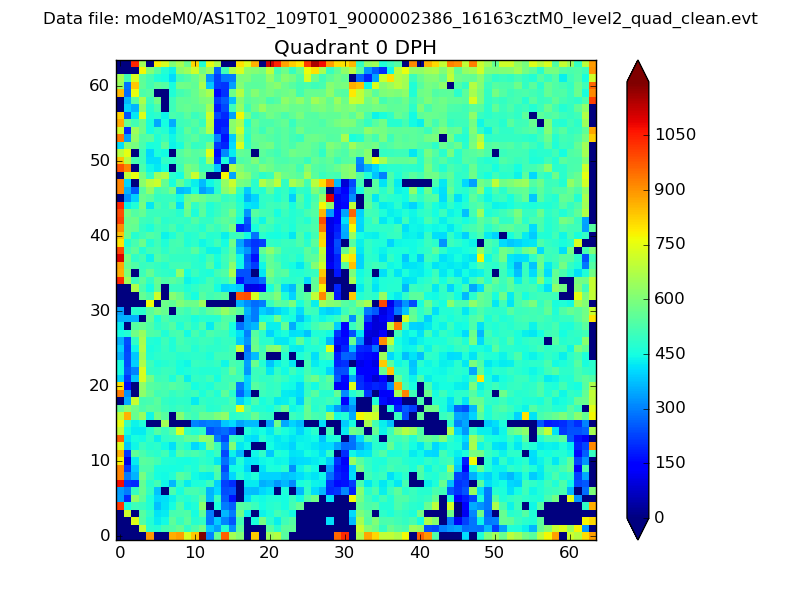 |
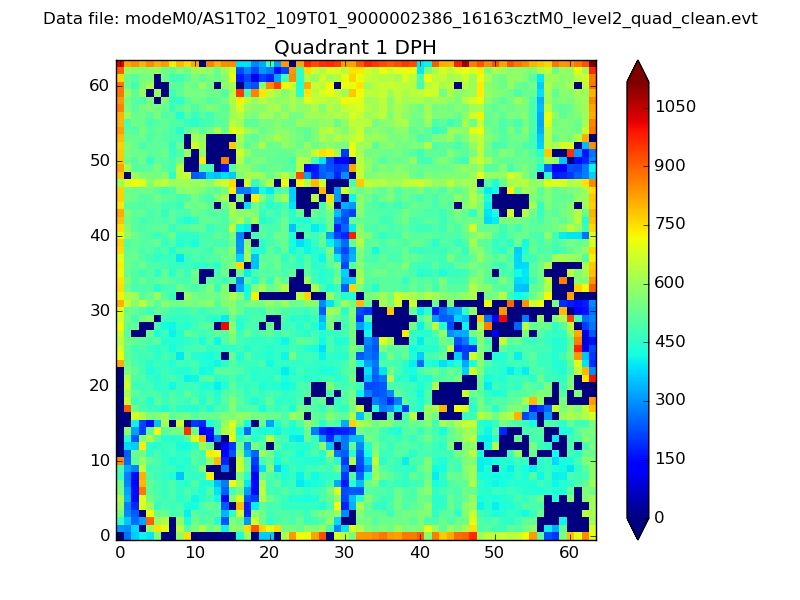 |
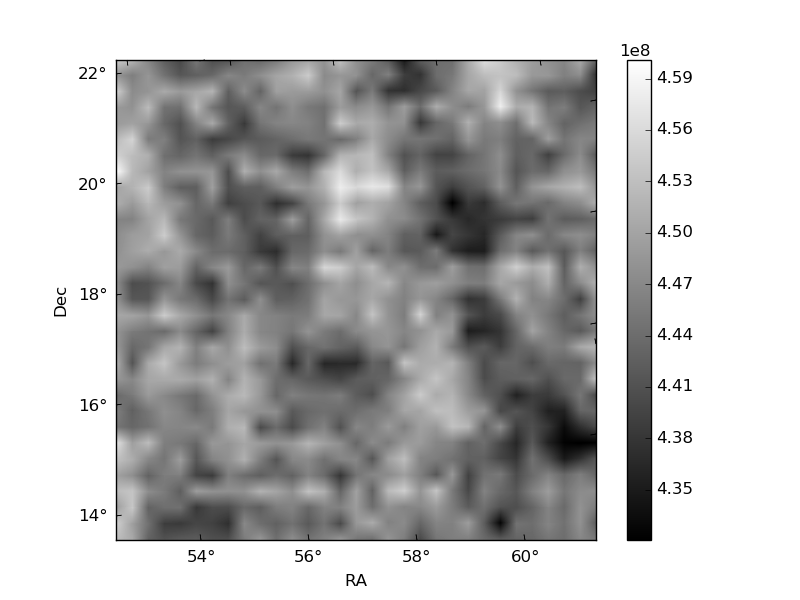
Quadrant B |
|---|---|---|---|
| Quadrant D | 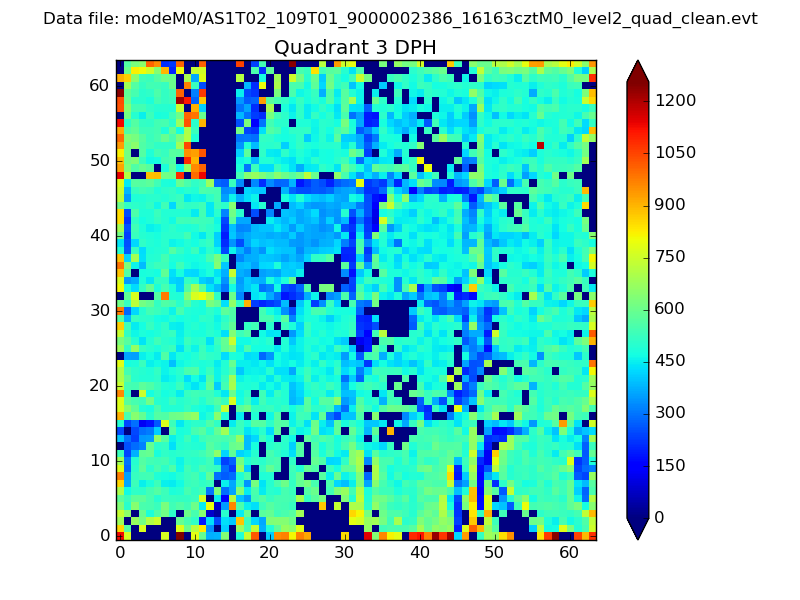 |
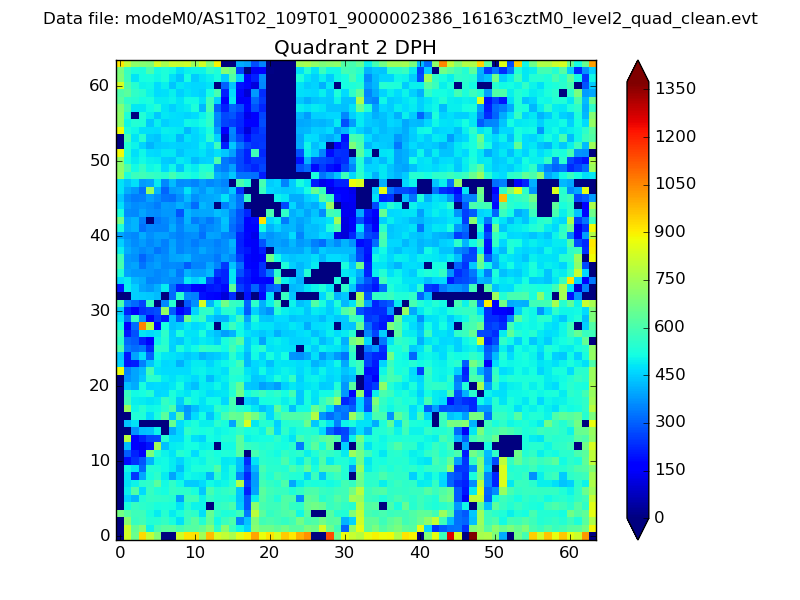 |
Quadrant C |
| Plot type | Count rate plots | Images |
|---|---|---|
| Comparison with Poisson distribution Blue bars denote a histogram of data divided into 1 sec bins. Red curve is a Poisson curve with rate = median count rate of data. |
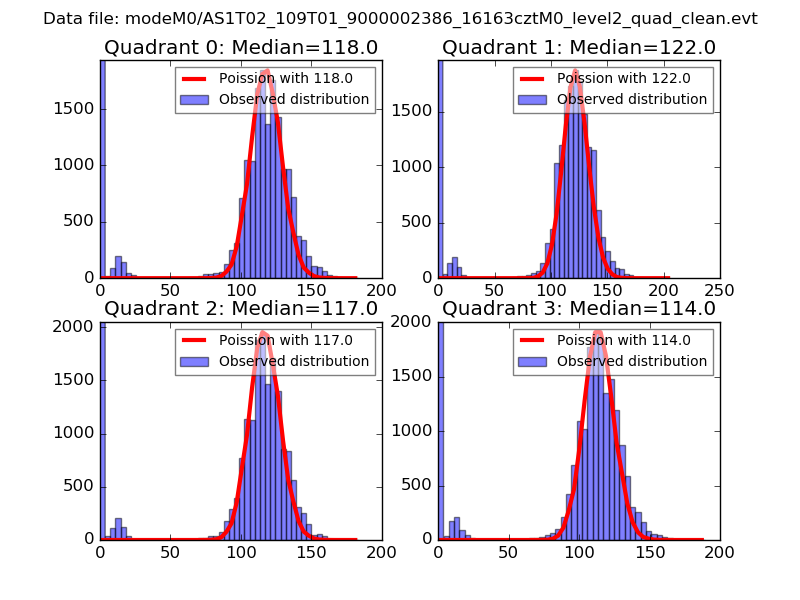 |
 |
| Quadrant-wise count rates Data is divided into 100 sec bins |
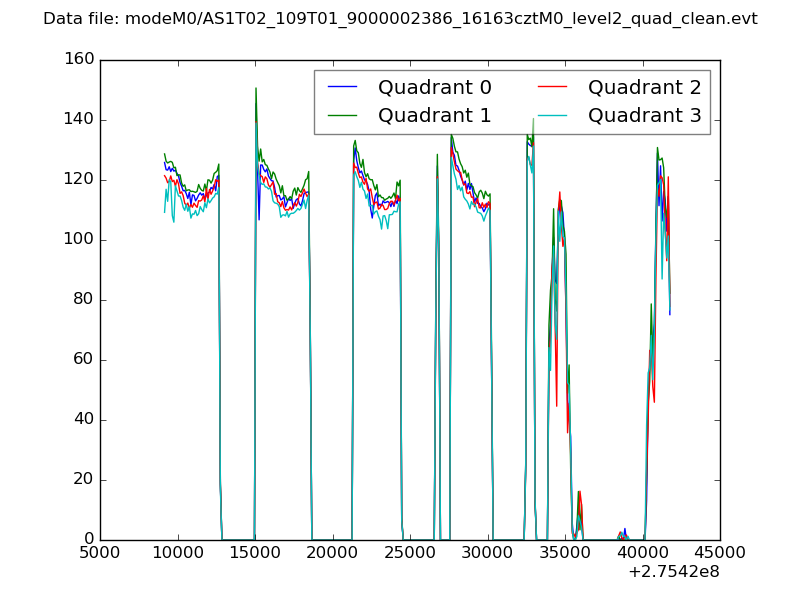 |
|
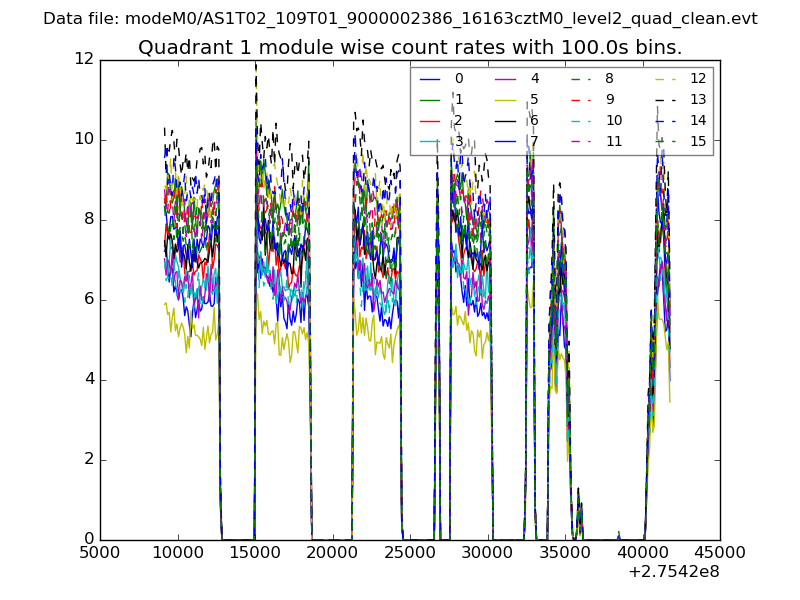
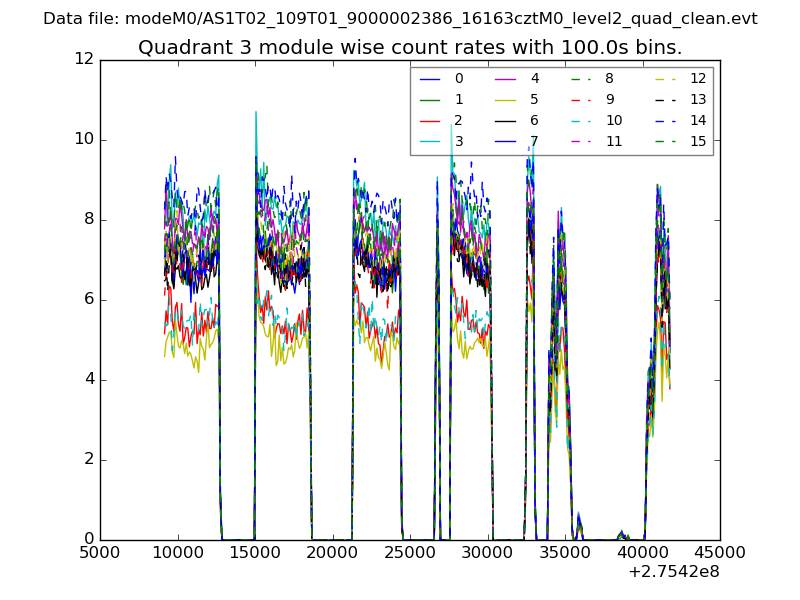
| Module-wise count rates for Quadrant A Data is divided into 100 sec bins |
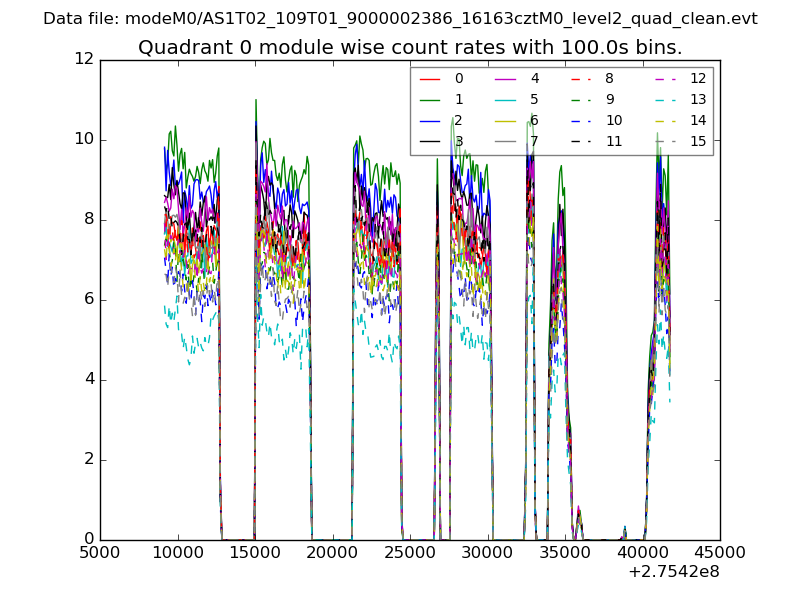 |
 |
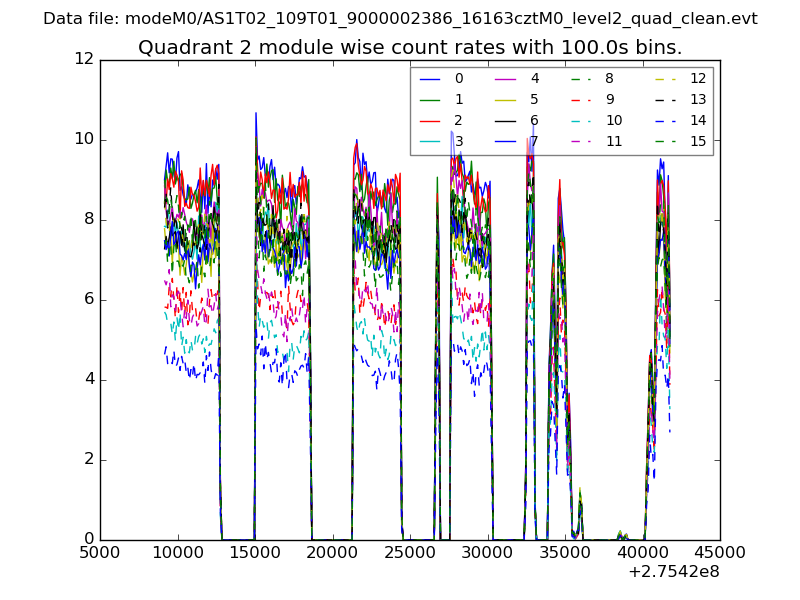
| Module-wise count rates for Quadrant B Data is divided into 100 sec bins |
 |
 |
| Module-wise count rates for Quadrant C Data is divided into 100 sec bins |
 |
 |
| Module-wise count rates for Quadrant D Data is divided into 100 sec bins |
 |
 |
| Parameter | Plot |
|---|---|
| CZT HV Monitor | 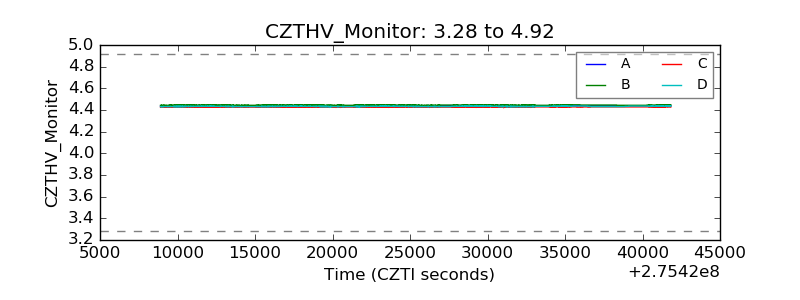 |
| D_VDD | 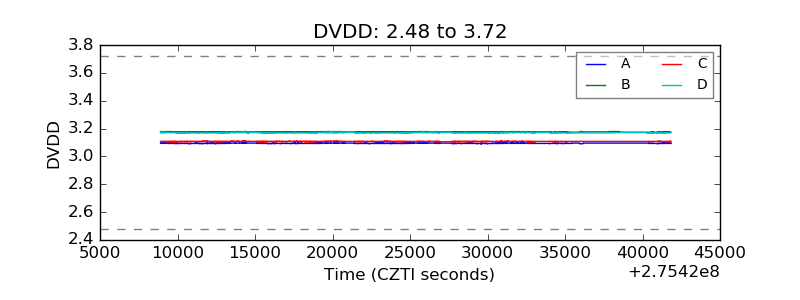 |
| Temperature 1 | 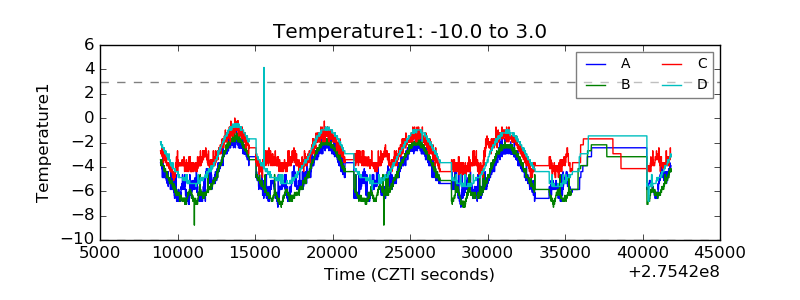 |
| Veto HV Monitor | 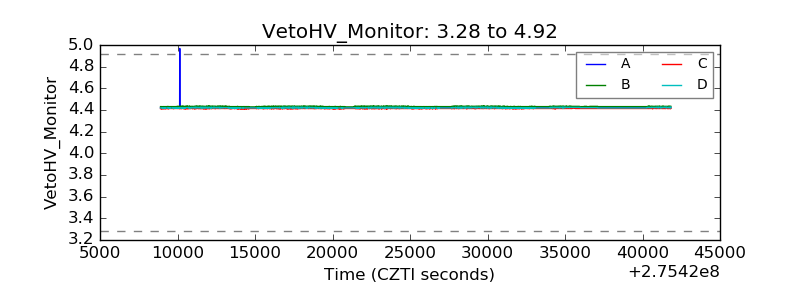 |
| Veto LLD | 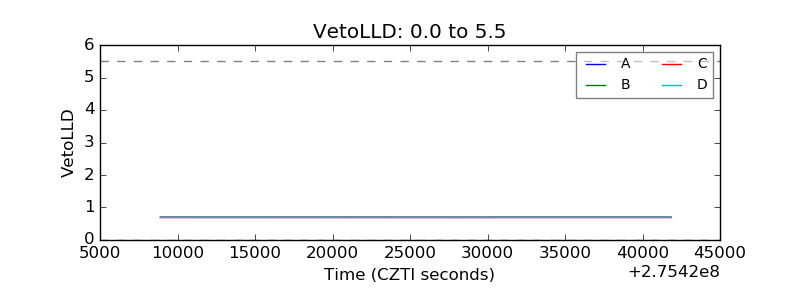 |
| Alpha Counter | 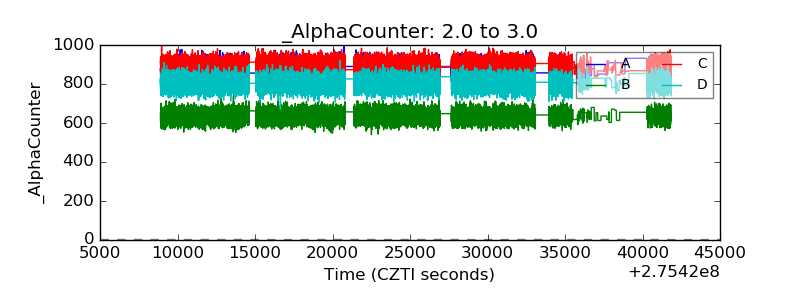 |
| _CPM_Rate | 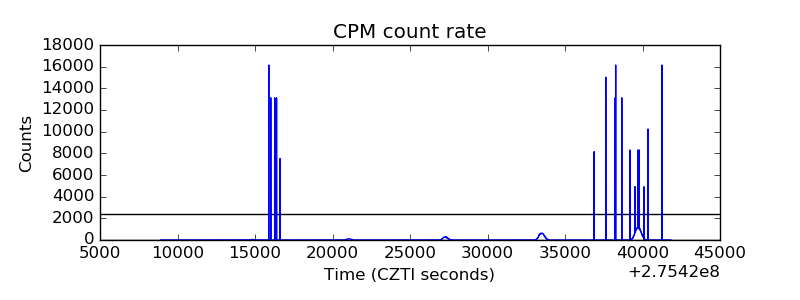 |
| CZT Counter | 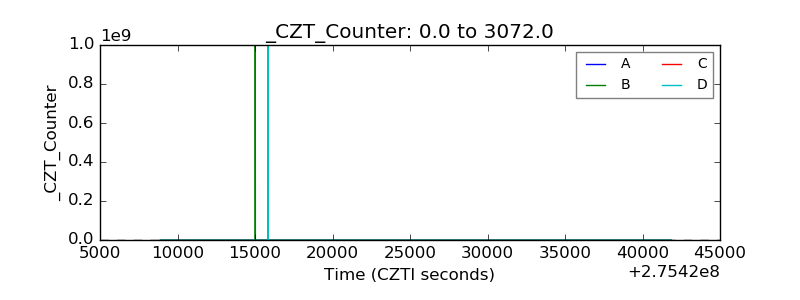 |
| +2.5 Volts monitor |  |
| +5 Volts monitor |  |
| _ROLL_ROT | 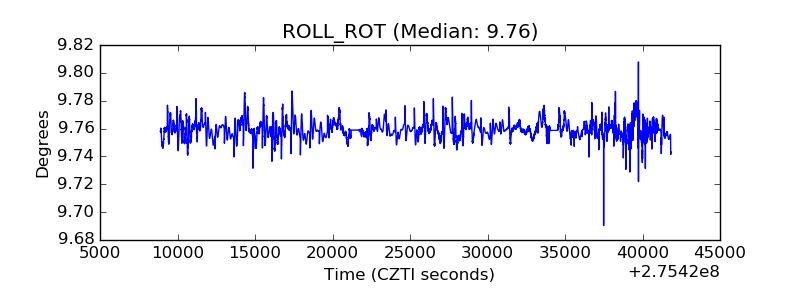 |
| _Roll_DEC | 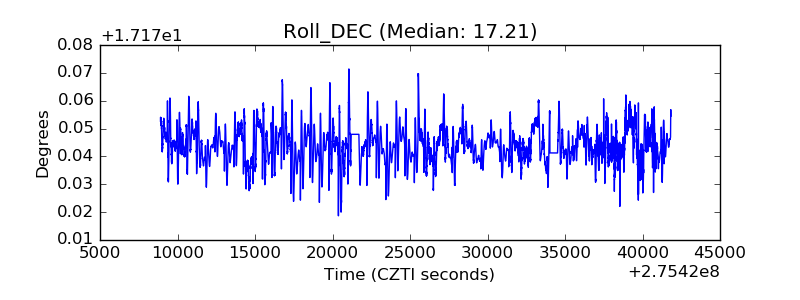 |
| _Roll_RA | 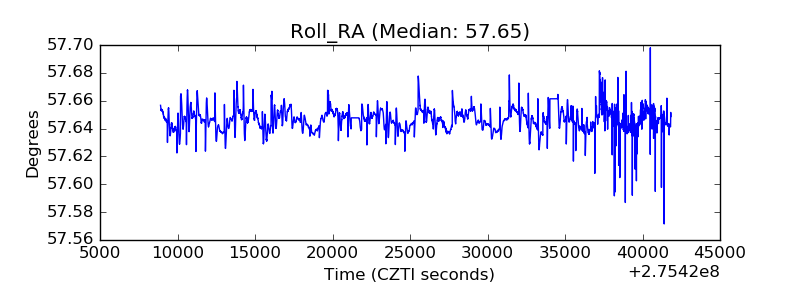 |
| Veto Counter | 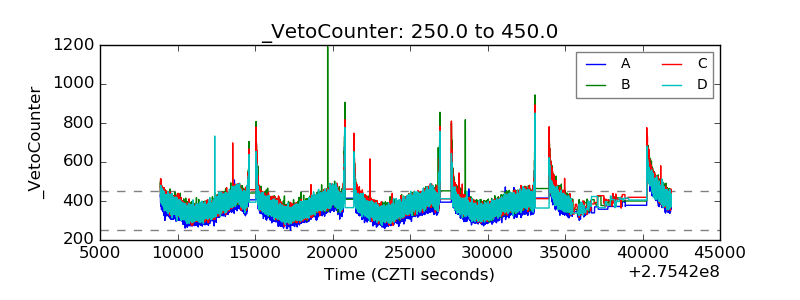 |