| Param | Original file | Final file |
|---|---|---|
| Filename | modeM0/AS1T02_109T01_9000002386_16168cztM0_level2.evt | modeM0/AS1T02_109T01_9000002386_16168cztM0_level2_quad_clean.evt |
| Size (bytes) | 546,932,160 | 69,491,520 |
| Size | 521.6 MB | 66.3 MB |
| Events in quadrant A | 4,426,811 | 423,742 |
| Events in quadrant B | 3,590,532 | 430,300 |
| Events in quadrant C | 4,737,028 | 399,269 |
| Events in quadrant D | 3,378,975 | 407,386 |
| Mode M0 | |||
|---|---|---|---|
| Quadrant | BADHDUFLAG | Total packets | Discarded packets |
| A | 0 | 17087 | 3 |
| B | 0 | 14400 | 2 |
| C | 0 | 17996 | 2 |
| D | 0 | 13791 | 2 |
| Mode SS | |||
|---|---|---|---|
| Quadrant | BADHDUFLAG | Total packets | Discarded packets |
| A | 0 | 128 | 0 |
| B | 0 | 128 | 0 |
| C | 0 | 128 | 0 |
| D | 0 | 128 | 0 |
| Mode M9 | |||
|---|---|---|---|
| Quadrant | BADHDUFLAG | Total packets | Discarded packets |
| A | 0 | 14 | 0 |
| B | 0 | 14 | 0 |
| C | 0 | 14 | 0 |
| D | 0 | 15 | 0 |
| Quadrant | Total seconds | Saturated seconds | Saturation percentage |
|---|---|---|---|
| A | 6357 | 437 | 6.874312% |
| B | 6357 | 113 | 1.777568% |
| C | 6357 | 426 | 6.701274% |
| D | 6357 | 67 | 1.053956% |
Noise dominated data is calculated using 1-second bins in cleaned event files. If a bin has >2000 counts, and if more than 50% of those come from <1% of pixels, then it is considered to be noise-dominated and hence unusable.
| Quadrant | # 1 sec bins | Bins with >0 counts | Bins with >2000 counts | High rate bins dominated by noise | Noise dominated (total time) | Noise dominated (detector-on time) | Marked lightcurve |
|---|---|---|---|---|---|---|---|
| A | 7668 | 6359 | 301 | 301 | 3.93% | 4.73% | 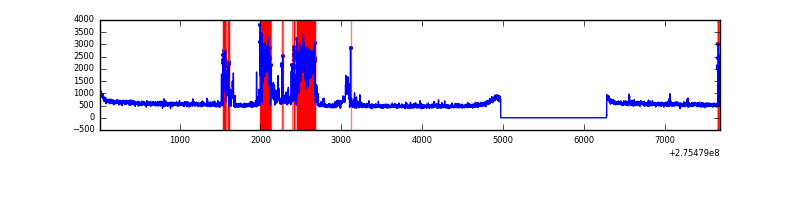 |
| B | 7668 | 6359 | 23 | 23 | 0.30% | 0.36% | 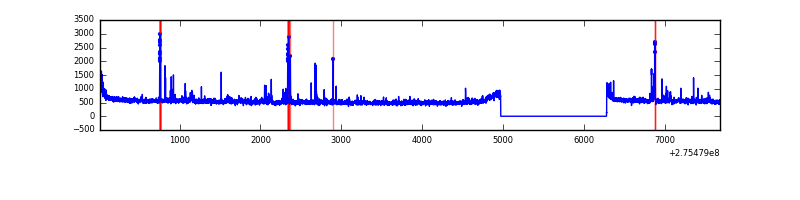 |
| C | 7668 | 6359 | 207 | 207 | 2.70% | 3.26% | 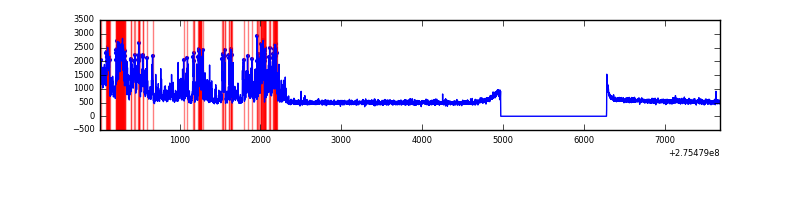 |
| D | 7668 | 6359 | 8 | 8 | 0.10% | 0.13% | 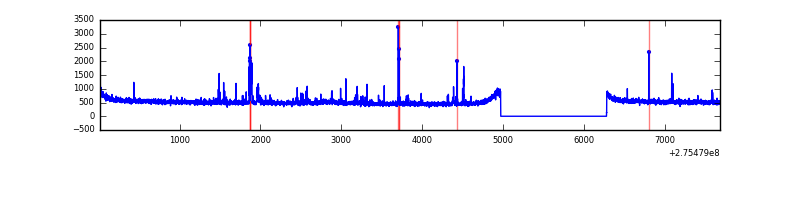 |
Top three noisy pixels from each quadrant. If the there are fewer than three noisy pixels in the level2.evt file, extra rows are filled as -1
| Pixel properties | Quadrant properties | ||||||
|---|---|---|---|---|---|---|---|
| Quadrant | DetID | PixID | Counts | Sigma | Mean | Median | Sigma |
| A | 15 | 174 | 1091755 | 6408.49 | 853 | 837 | 170.2 |
| A | 0 | 253 | 42506 | 244.78 | 853 | 837 | 170.2 |
| A | 9 | 143 | 8932 | 47.55 | 853 | 837 | 170.2 |
| B | 0 | 197 | 53507 | 325.86 | 861 | 845 | 161.6 |
| B | 0 | 189 | 34116 | 205.87 | 861 | 845 | 161.6 |
| B | 4 | 142 | 32214 | 194.11 | 861 | 845 | 161.6 |
| C | 3 | 233 | 1396279 | 7447.05 | 816 | 823 | 187.4 |
| C | 14 | 238 | 128779 | 682.86 | 816 | 823 | 187.4 |
| C | 0 | 207 | 18040 | 91.88 | 816 | 823 | 187.4 |
| D | 7 | 38 | 103444 | 493.9 | 850 | 825 | 207.8 |
| D | 2 | 234 | 24773 | 115.26 | 850 | 825 | 207.8 |
| D | 10 | 70 | 21045 | 97.32 | 850 | 825 | 207.8 |
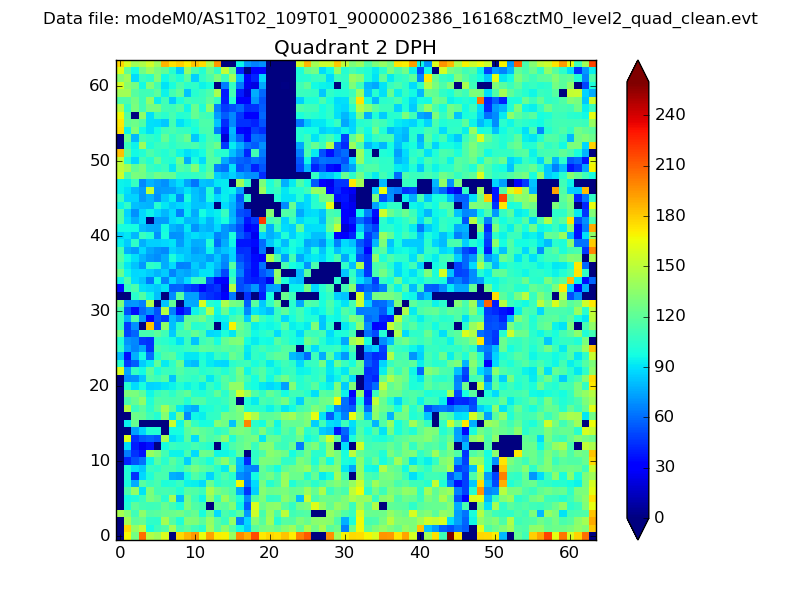
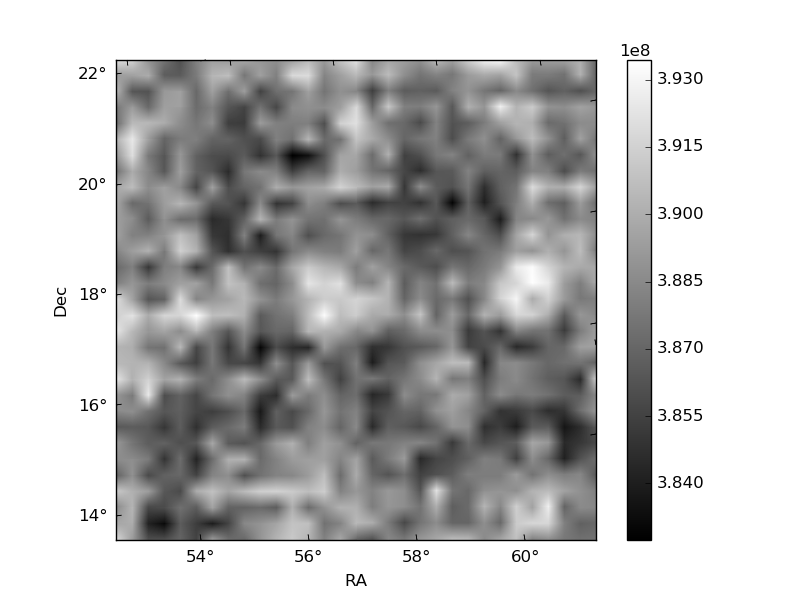
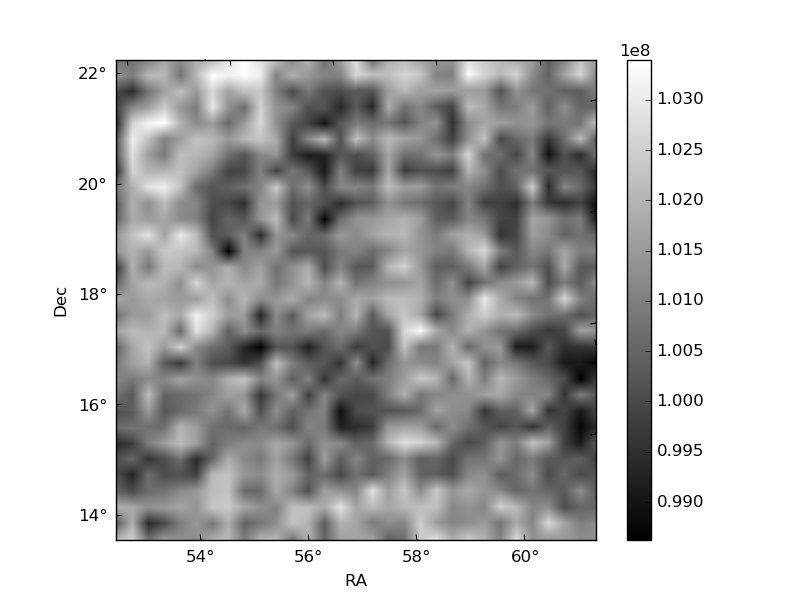
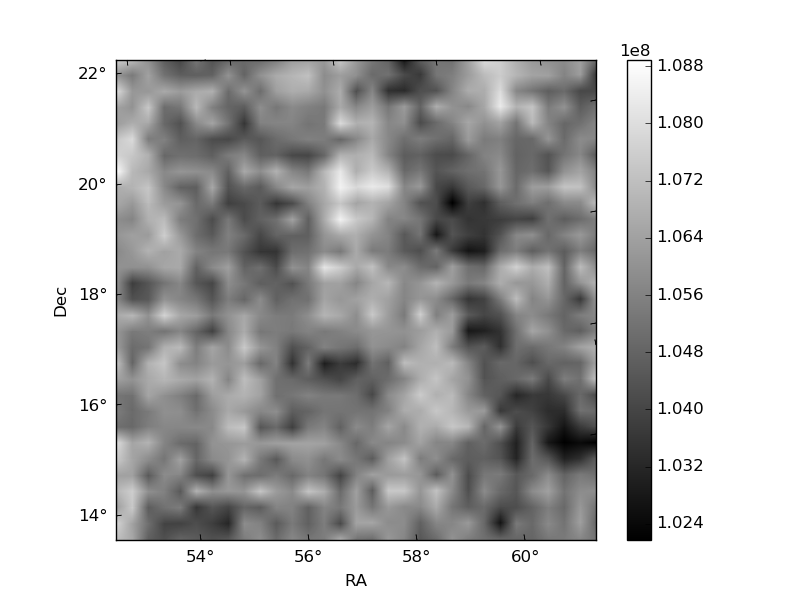
Histogram calculated using DETX and DETY for each event in the final _common_clean file
| Quadrant A | 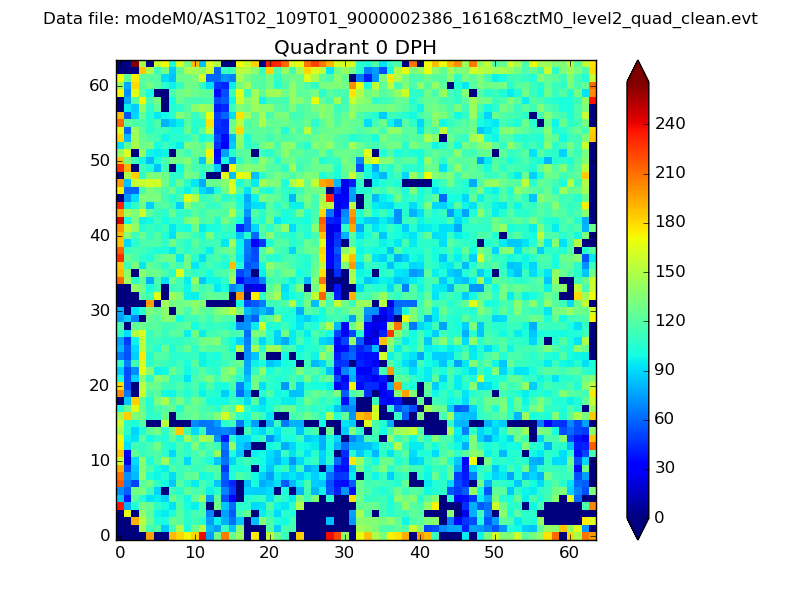 |
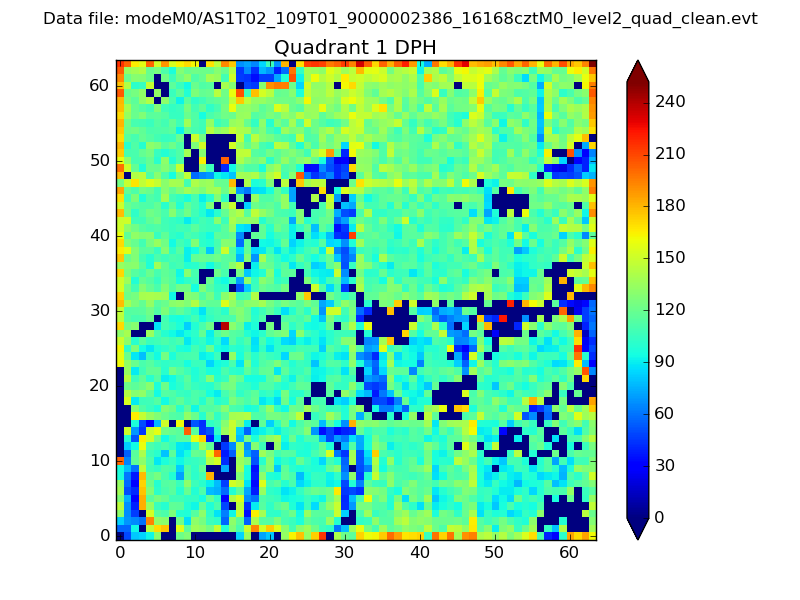 |
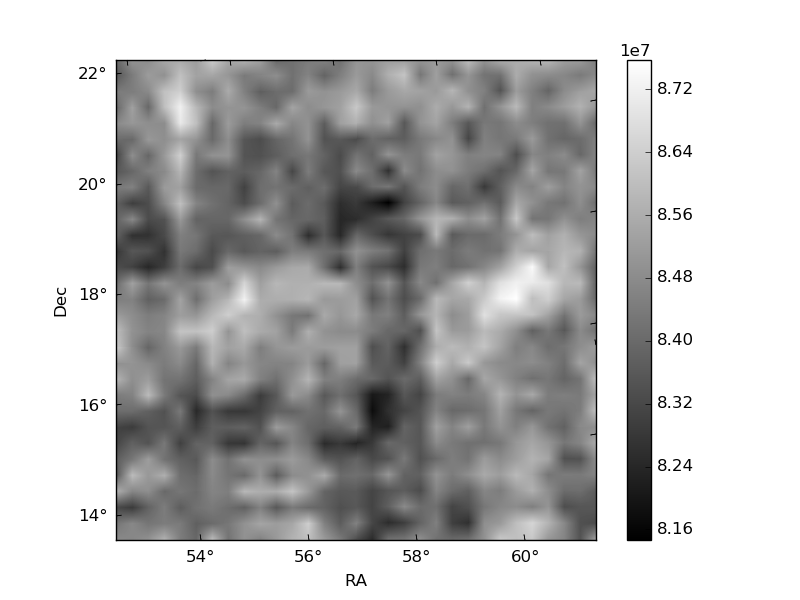
Quadrant B |
|---|---|---|---|
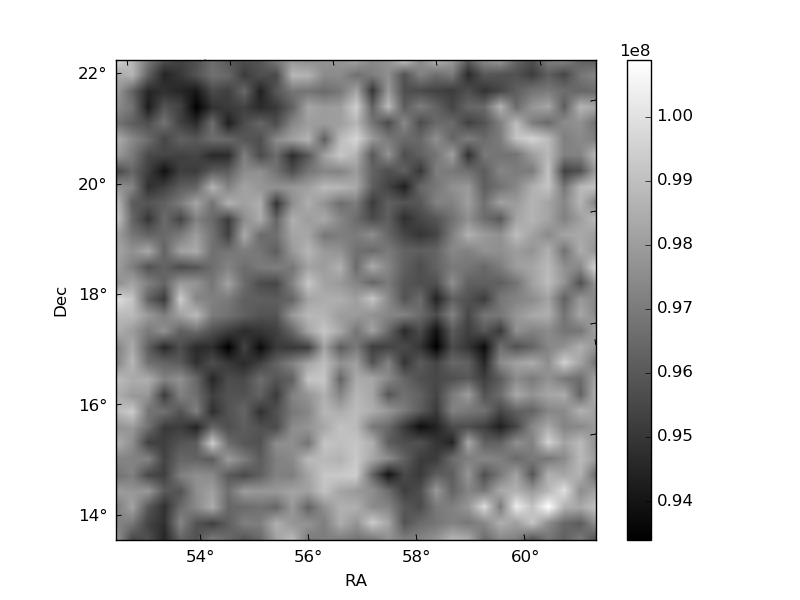
| Quadrant D | 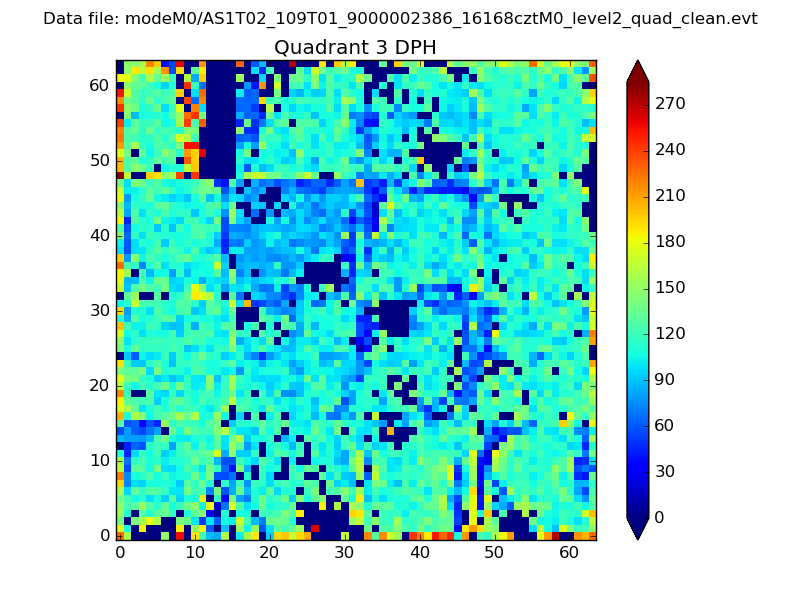 |
 |
Quadrant C |
| Plot type | Count rate plots | Images |
|---|---|---|
| Comparison with Poisson distribution Blue bars denote a histogram of data divided into 1 sec bins. Red curve is a Poisson curve with rate = median count rate of data. |
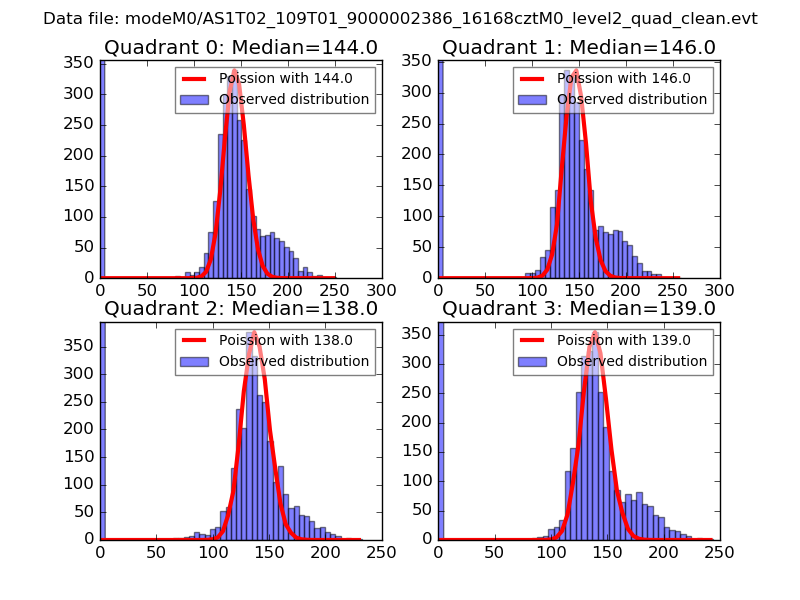 |
 |
| Quadrant-wise count rates Data is divided into 100 sec bins |
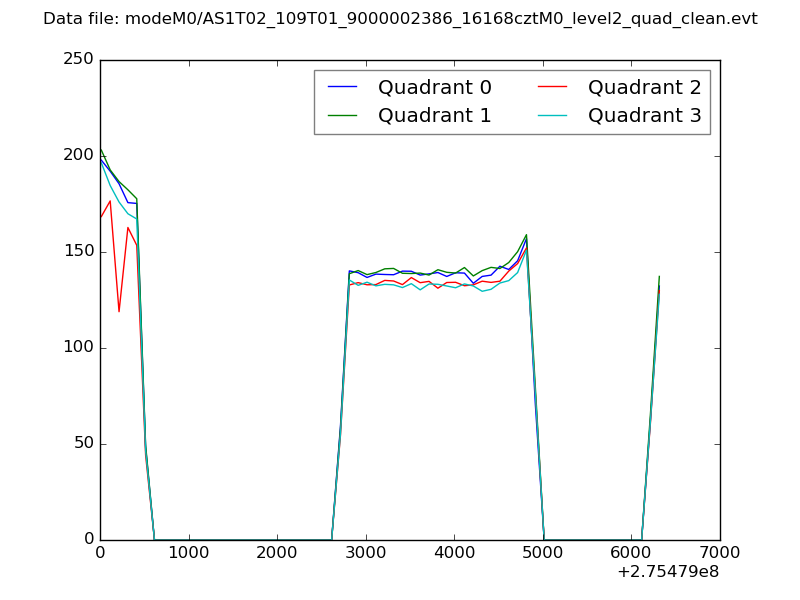 |
|
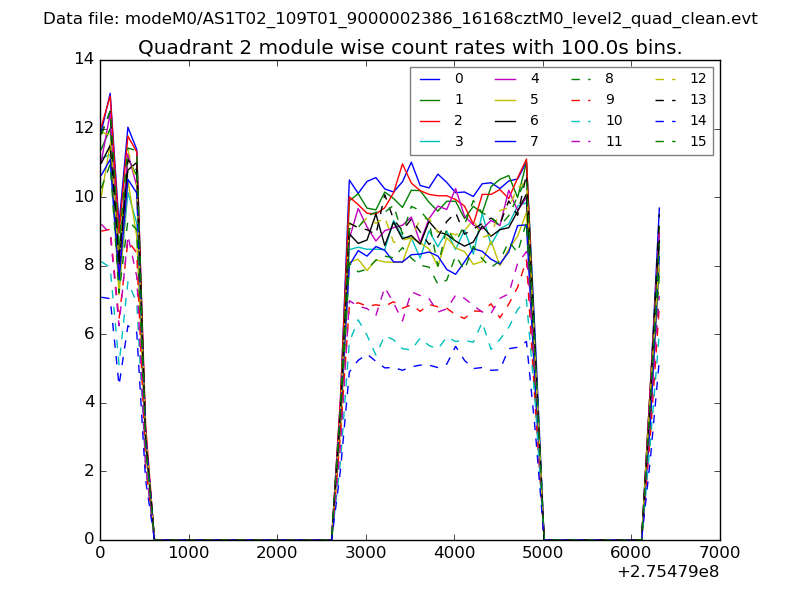
| Module-wise count rates for Quadrant A Data is divided into 100 sec bins |
 |
 |
| Module-wise count rates for Quadrant B Data is divided into 100 sec bins |
 |
 |
| Module-wise count rates for Quadrant C Data is divided into 100 sec bins |
 |
 |
| Module-wise count rates for Quadrant D Data is divided into 100 sec bins |
 |
 |
| Parameter | Plot |
|---|---|
| CZT HV Monitor | 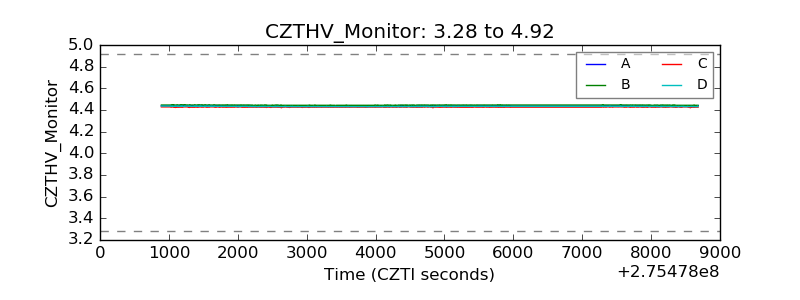 |
| D_VDD | 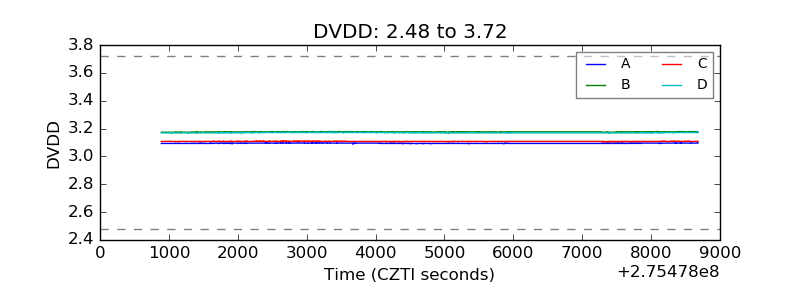 |
| Temperature 1 | 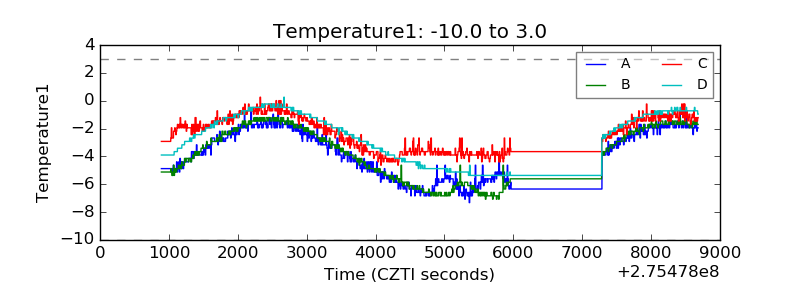 |
| Veto HV Monitor |  |
| Veto LLD | 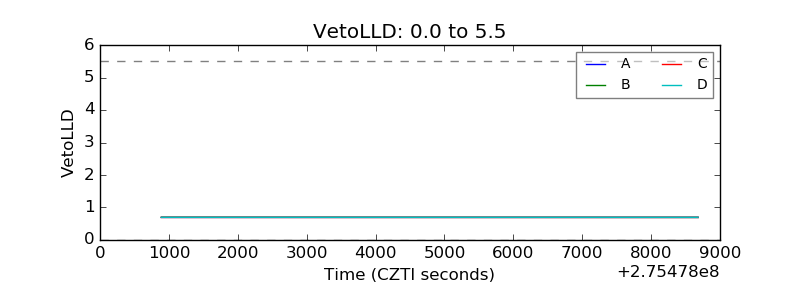 |
| Alpha Counter | 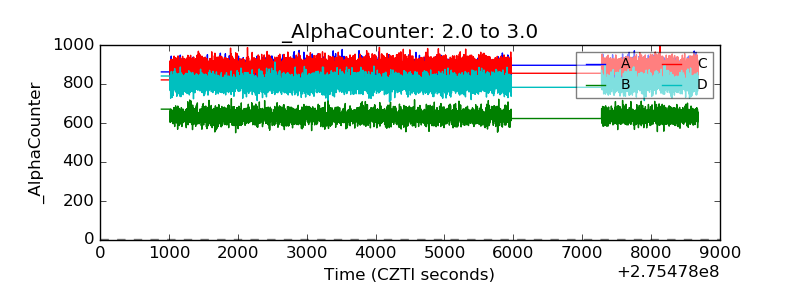 |
| _CPM_Rate | 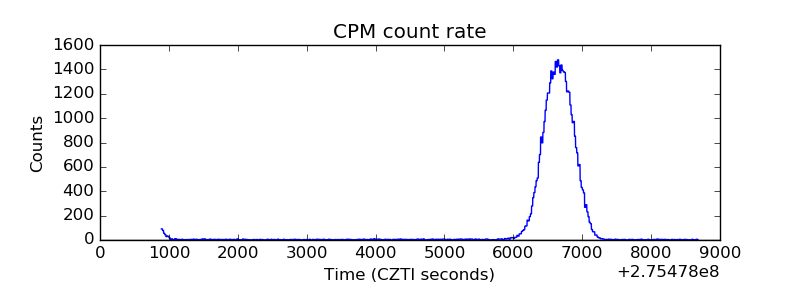 |
| CZT Counter | 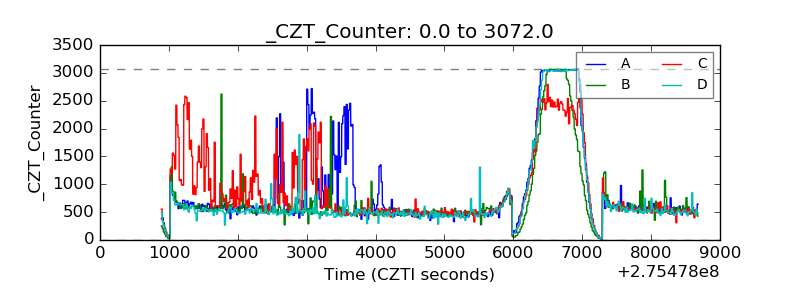 |
| +2.5 Volts monitor | 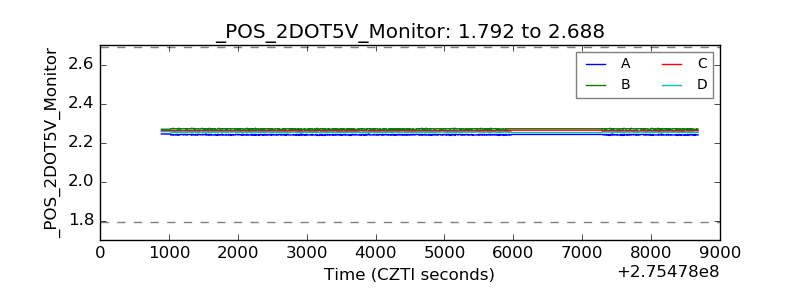 |
| +5 Volts monitor |  |
| _ROLL_ROT | 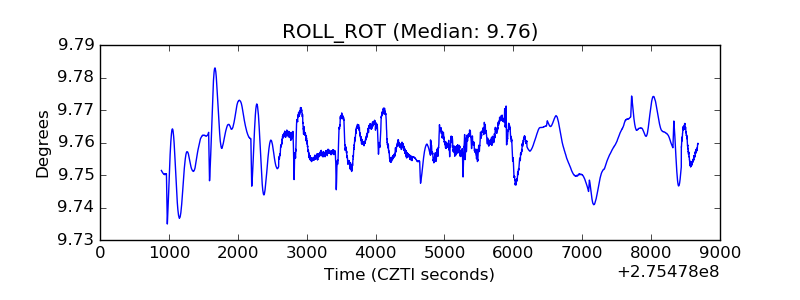 |
| _Roll_DEC | 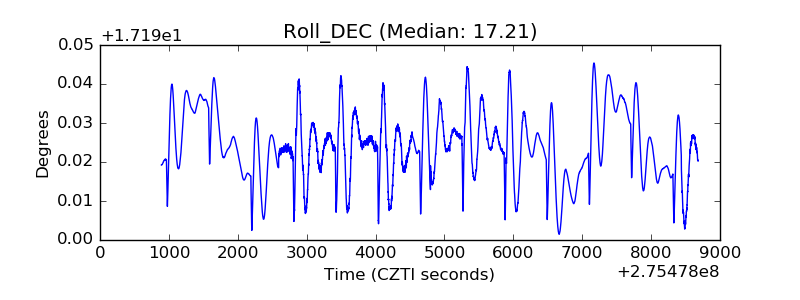 |
| _Roll_RA |  |
| Veto Counter | 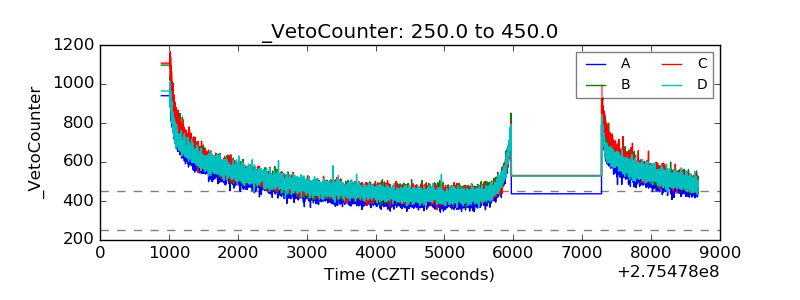 |