| Param | Original file | Final file |
|---|---|---|
| Filename | modeM0/AS1T02_109T01_9000002386_16172cztM0_level2.evt | modeM0/AS1T02_109T01_9000002386_16172cztM0_level2_quad_clean.evt |
| Size (bytes) | 661,371,840 | 83,162,880 |
| Size | 630.7 MB | 79.3 MB |
| Events in quadrant A | 6,797,802 | 451,002 |
| Events in quadrant B | 3,865,734 | 539,118 |
| Events in quadrant C | 3,570,434 | 519,564 |
| Events in quadrant D | 5,300,048 | 498,651 |
| Mode M0 | |||
|---|---|---|---|
| Quadrant | BADHDUFLAG | Total packets | Discarded packets |
| A | 0 | 25161 | 2 |
| B | 0 | 16282 | 1 |
| C | 0 | 15165 | 1 |
| D | 0 | 20905 | 1 |
| Mode SS | |||
|---|---|---|---|
| Quadrant | BADHDUFLAG | Total packets | Discarded packets |
| A | 0 | 148 | 0 |
| B | 0 | 148 | 0 |
| C | 0 | 148 | 0 |
| D | 0 | 148 | 0 |
| Mode M9 | |||
|---|---|---|---|
| Quadrant | BADHDUFLAG | Total packets | Discarded packets |
| A | 0 | 3 | 0 |
| B | 0 | 3 | 0 |
| C | 0 | 3 | 0 |
| D | 0 | 3 | 0 |
| Quadrant | Total seconds | Saturated seconds | Saturation percentage |
|---|---|---|---|
| A | 7318 | 1386 | 18.939601% |
| B | 7318 | 93 | 1.270839% |
| C | 7318 | 106 | 1.448483% |
| D | 7318 | 523 | 7.146761% |
Noise dominated data is calculated using 1-second bins in cleaned event files. If a bin has >2000 counts, and if more than 50% of those come from <1% of pixels, then it is considered to be noise-dominated and hence unusable.
| Quadrant | # 1 sec bins | Bins with >0 counts | Bins with >2000 counts | High rate bins dominated by noise | Noise dominated (total time) | Noise dominated (detector-on time) | Marked lightcurve |
|---|---|---|---|---|---|---|---|
| A | 7614 | 7320 | 1100 | 1100 | 14.45% | 15.03% | 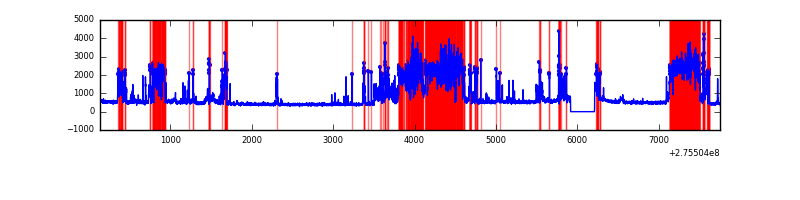 |
| B | 7614 | 7320 | 10 | 10 | 0.13% | 0.14% | 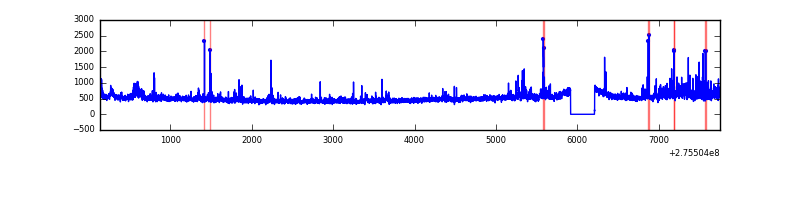 |
| C | 7614 | 7320 | 1 | 1 | 0.01% | 0.01% | 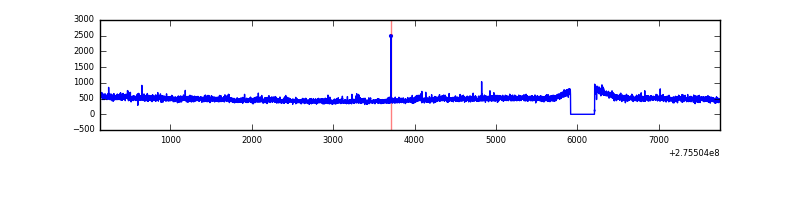 |
| D | 7614 | 7320 | 452 | 452 | 5.94% | 6.17% | 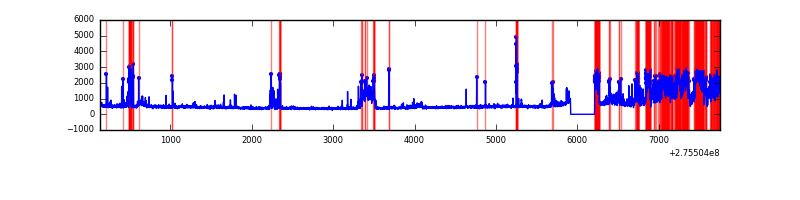 |
Top three noisy pixels from each quadrant. If the there are fewer than three noisy pixels in the level2.evt file, extra rows are filled as -1
| Pixel properties | Quadrant properties | ||||||
|---|---|---|---|---|---|---|---|
| Quadrant | DetID | PixID | Counts | Sigma | Mean | Median | Sigma |
| A | 15 | 174 | 3648577 | 21951.17 | 812 | 794 | 166.2 |
| A | 0 | 253 | 23154 | 134.56 | 812 | 794 | 166.2 |
| A | 0 | 226 | 7190 | 38.49 | 812 | 794 | 166.2 |
| B | 0 | 244 | 201111 | 1166.13 | 889 | 866 | 171.7 |
| B | 4 | 216 | 51154 | 292.85 | 889 | 866 | 171.7 |
| B | 0 | 189 | 39639 | 225.79 | 889 | 866 | 171.7 |
| C | 14 | 238 | 130617 | 648.11 | 850 | 856 | 200.2 |
| C | 3 | 233 | 66284 | 326.79 | 850 | 856 | 200.2 |
| C | 7 | 247 | 41971 | 205.35 | 850 | 856 | 200.2 |
| D | 1 | 52 | 1752713 | 8383.53 | 843 | 815 | 209.0 |
| D | 2 | 33 | 268922 | 1283.0 | 843 | 815 | 209.0 |
| D | 2 | 234 | 31519 | 146.93 | 843 | 815 | 209.0 |
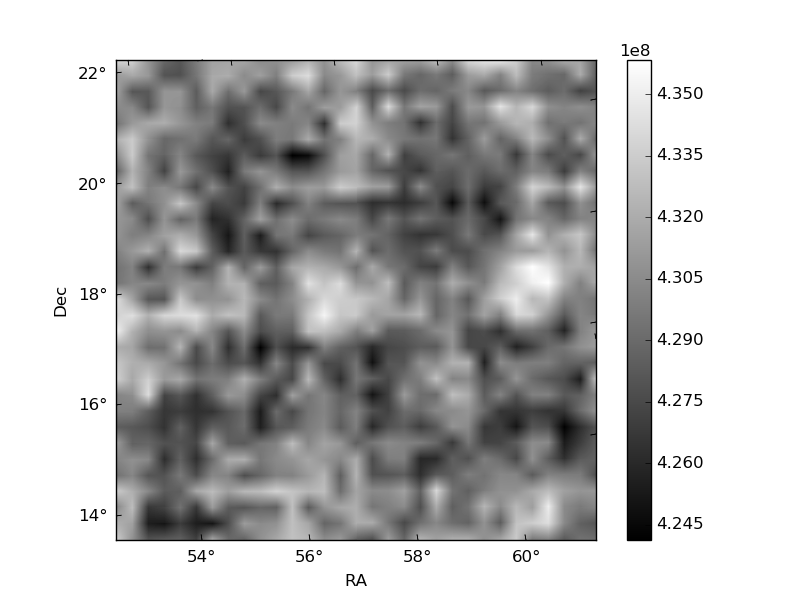
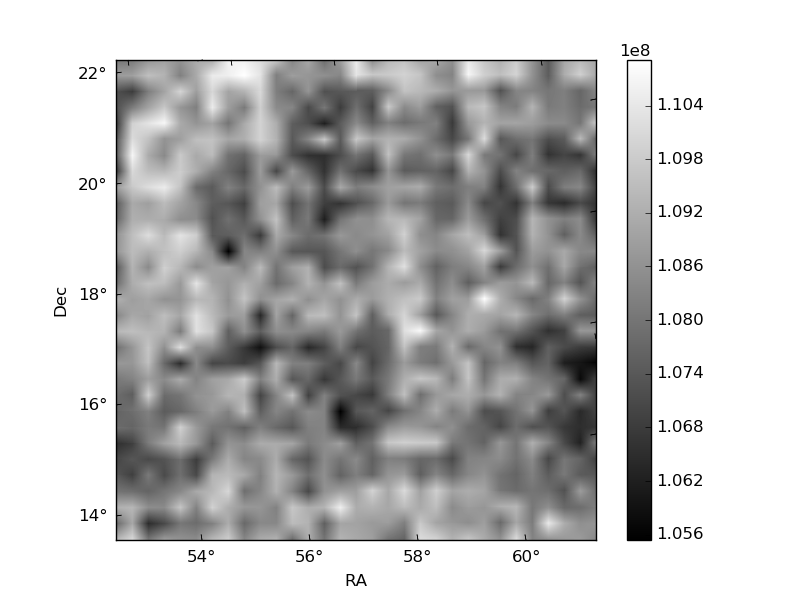
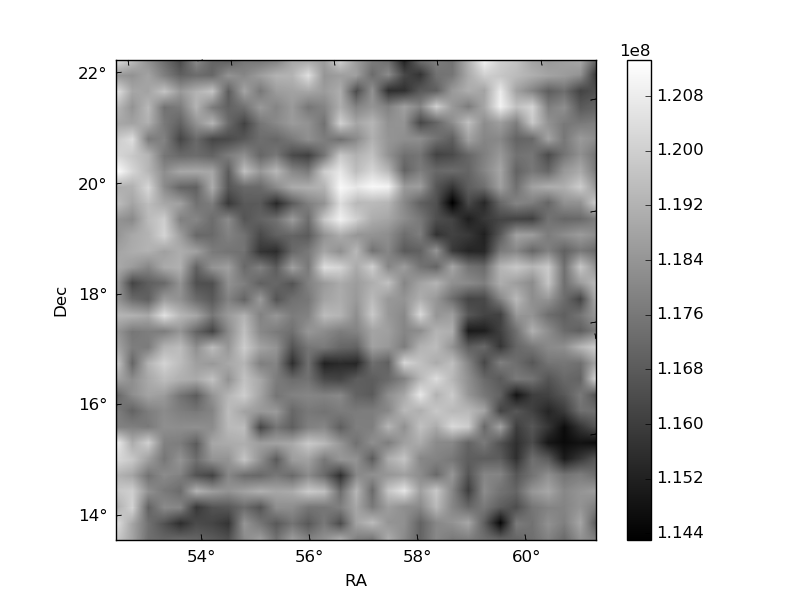
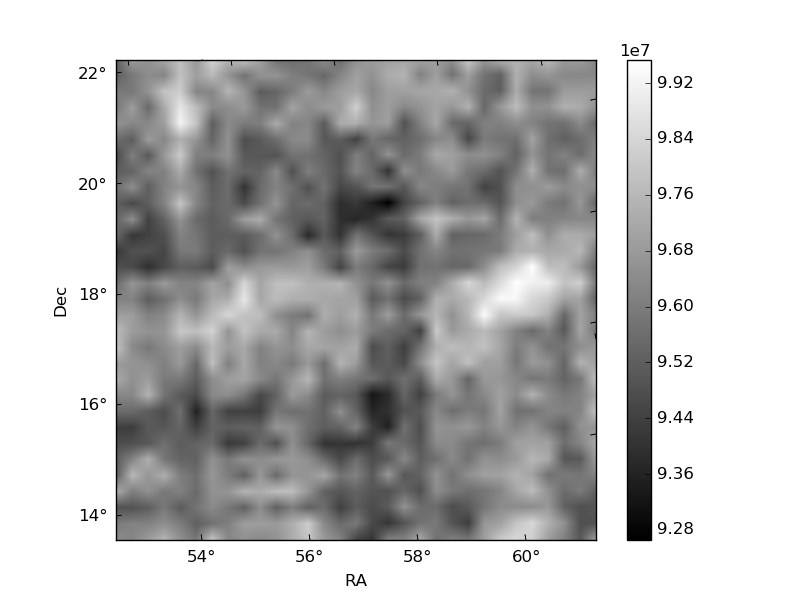
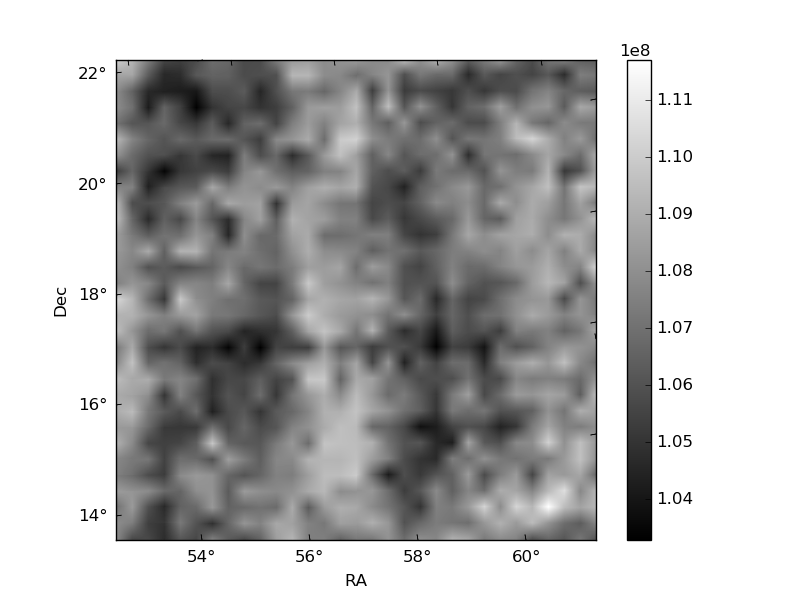
Histogram calculated using DETX and DETY for each event in the final _common_clean file
| Quadrant A | 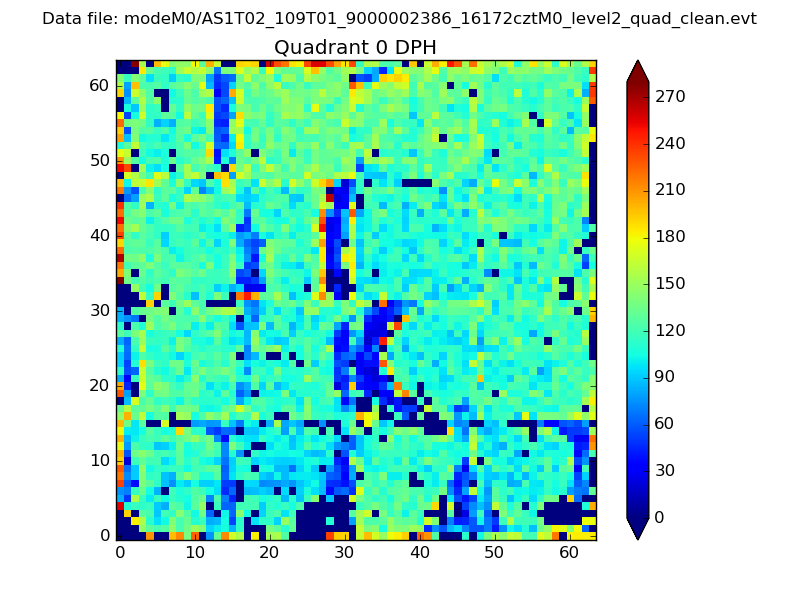 |
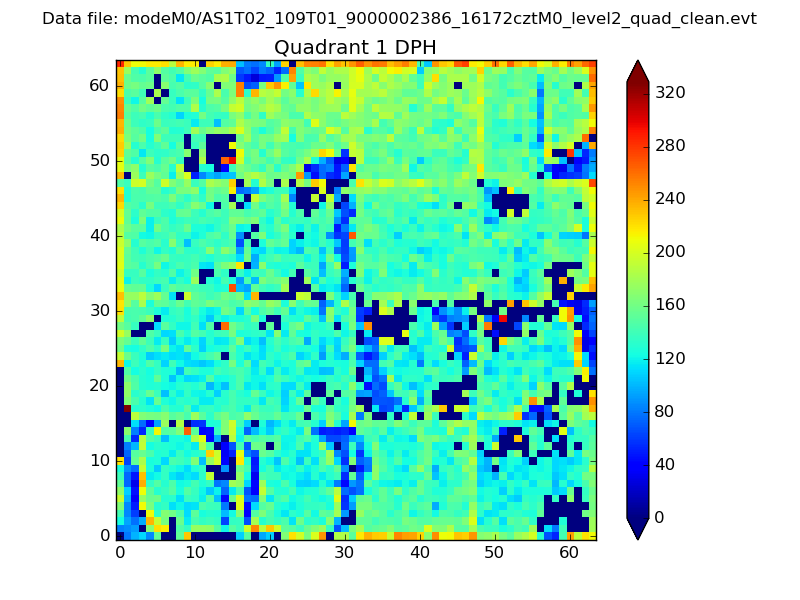 |
Quadrant B |
|---|---|---|---|
| Quadrant D | 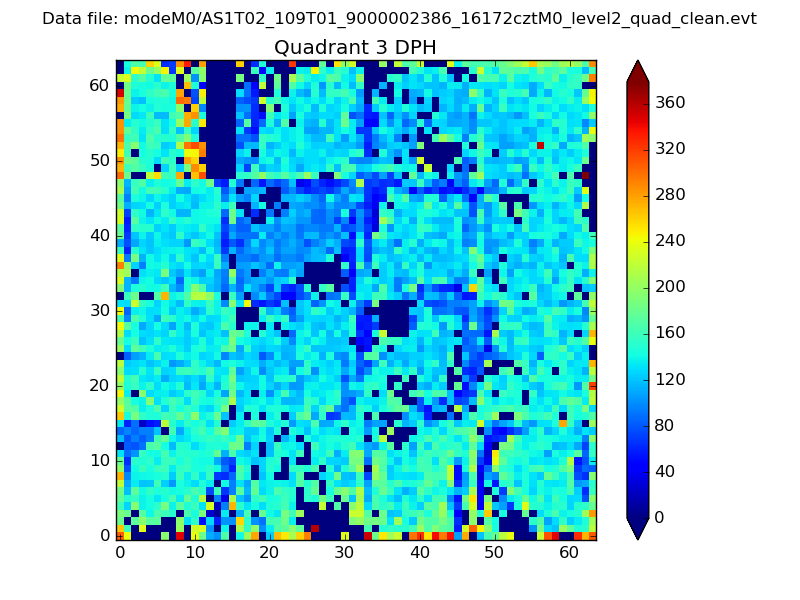 |
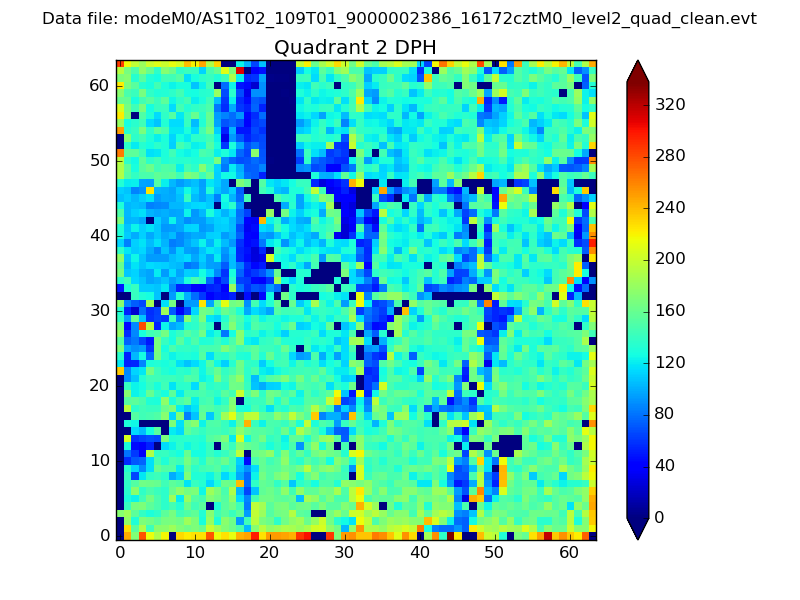 |
Quadrant C |
| Plot type | Count rate plots | Images |
|---|---|---|
| Comparison with Poisson distribution Blue bars denote a histogram of data divided into 1 sec bins. Red curve is a Poisson curve with rate = median count rate of data. |
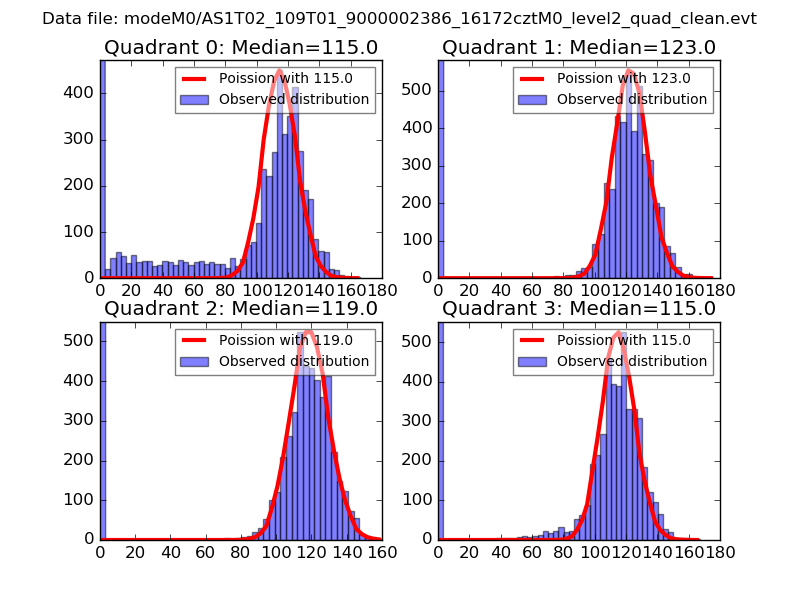 |
 |
| Quadrant-wise count rates Data is divided into 100 sec bins |
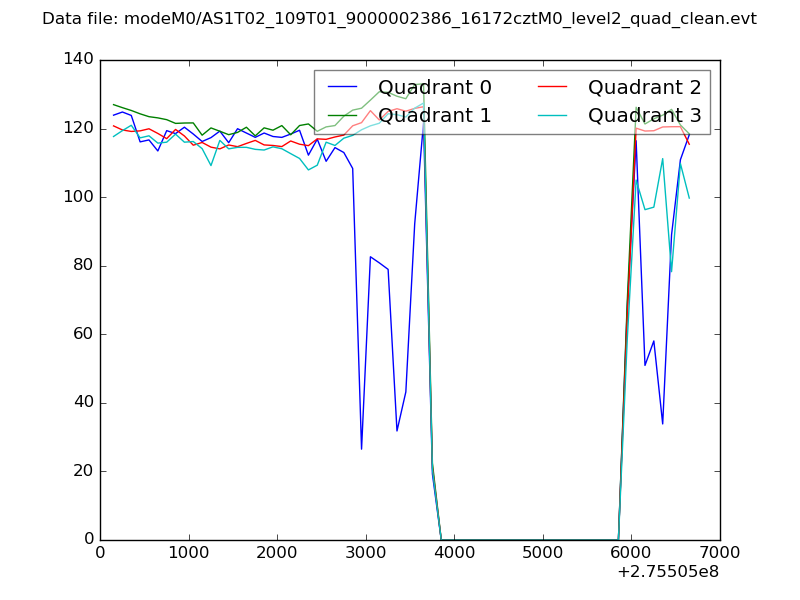 |
|
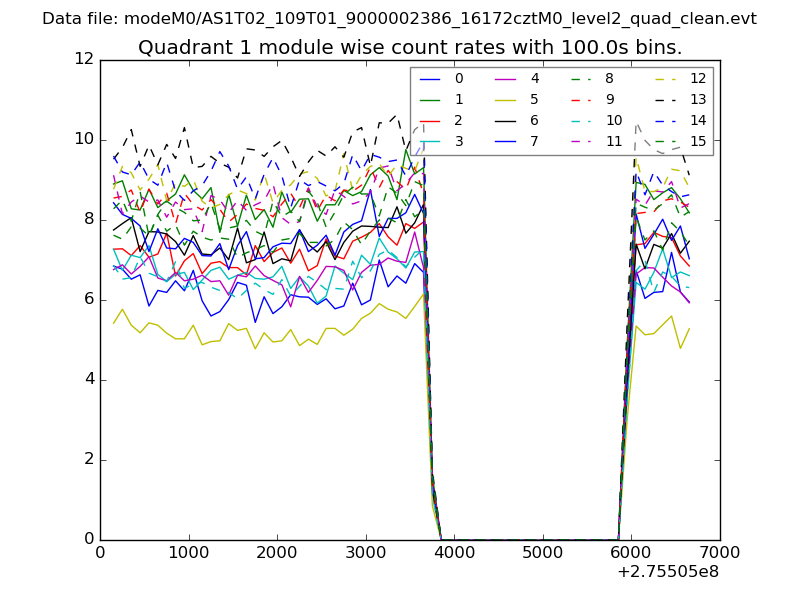
| Module-wise count rates for Quadrant A Data is divided into 100 sec bins |
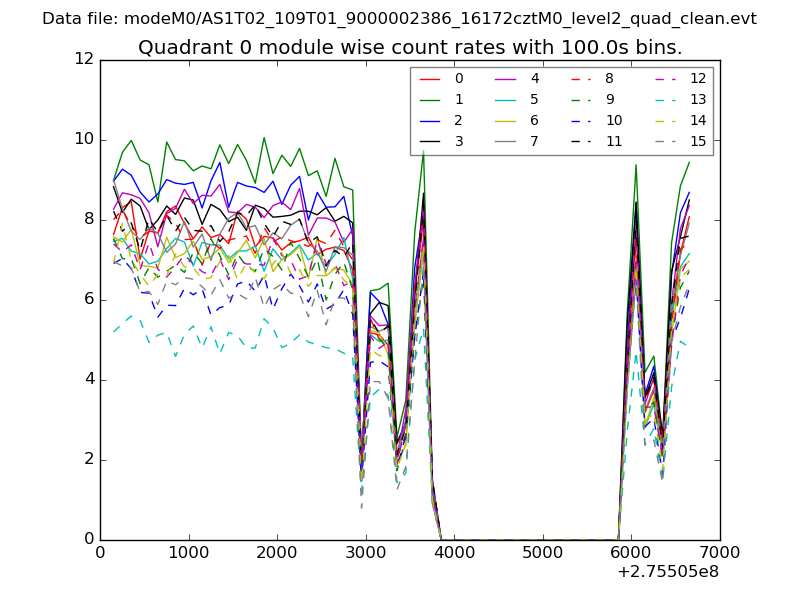 |
 |
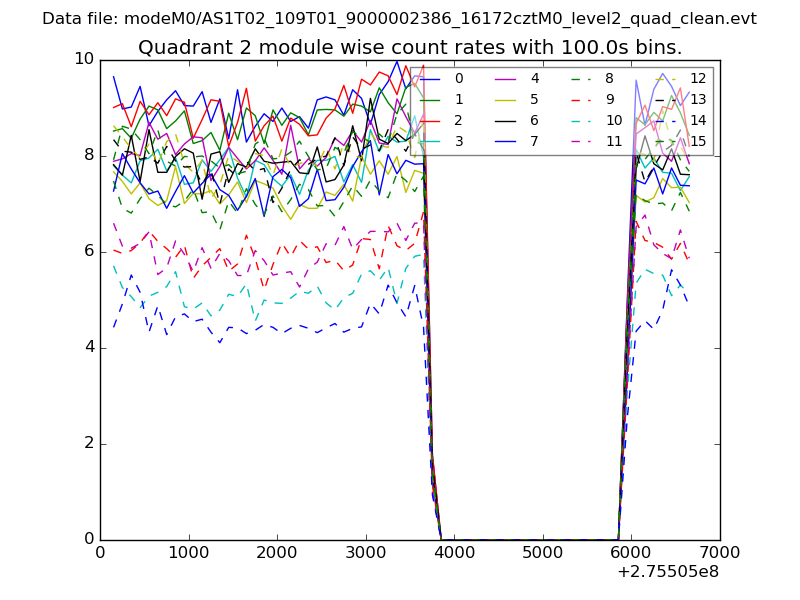
| Module-wise count rates for Quadrant B Data is divided into 100 sec bins |
 |
 |
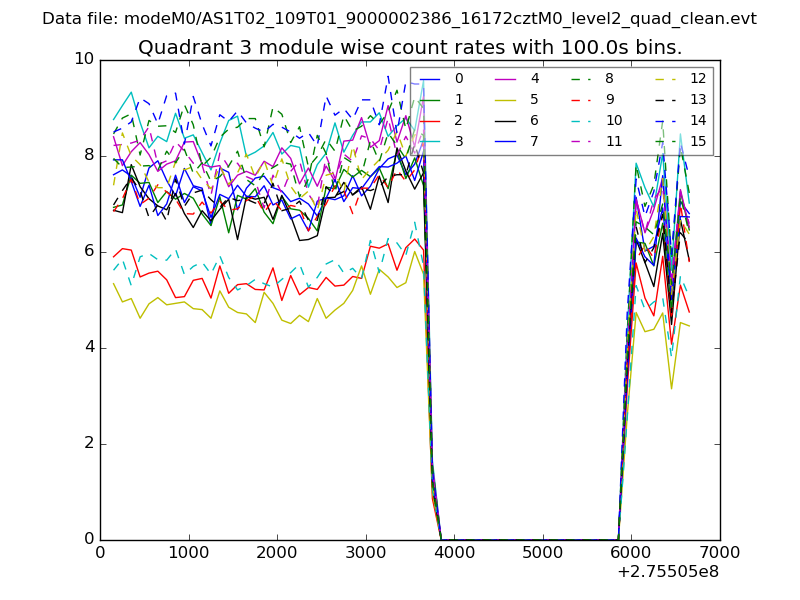
| Module-wise count rates for Quadrant C Data is divided into 100 sec bins |
 |
 |
| Module-wise count rates for Quadrant D Data is divided into 100 sec bins |
 |
 |
| Parameter | Plot |
|---|---|
| CZT HV Monitor | 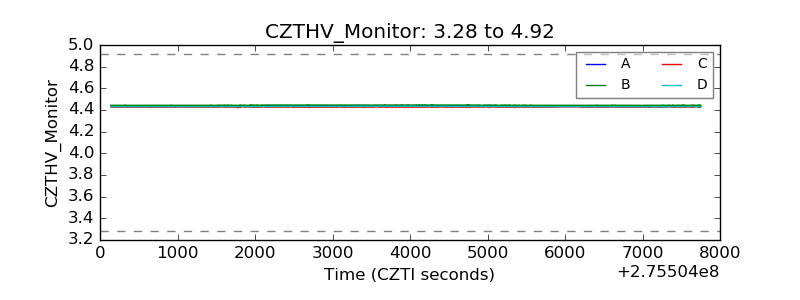 |
| D_VDD | 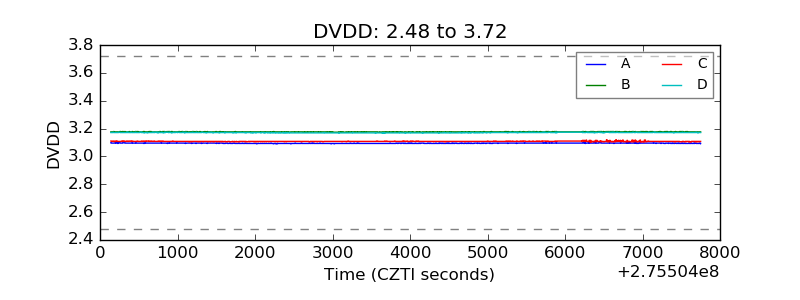 |
| Temperature 1 | 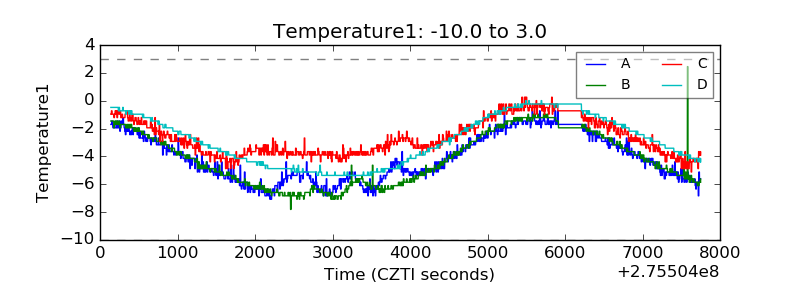 |
| Veto HV Monitor |  |
| Veto LLD | 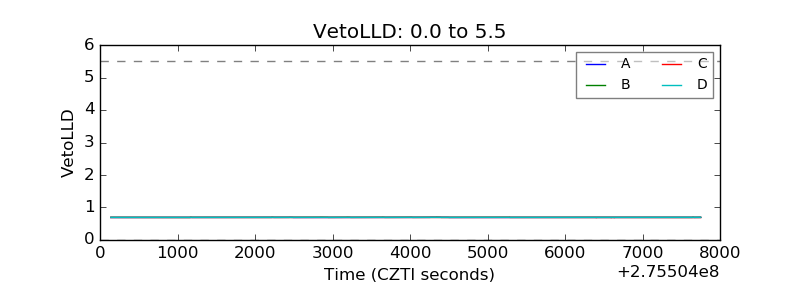 |
| Alpha Counter | 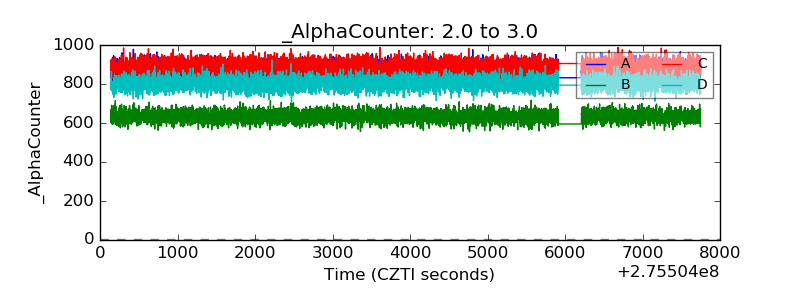 |
| _CPM_Rate | 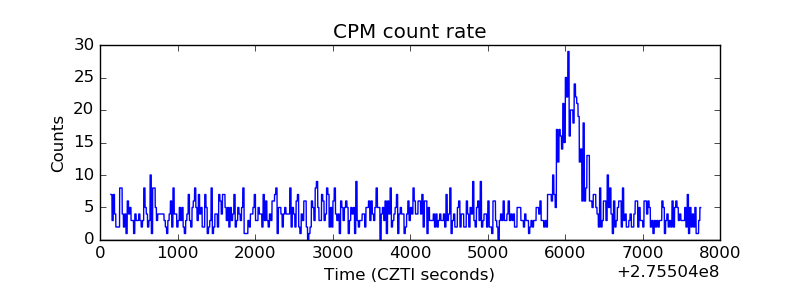 |
| CZT Counter | 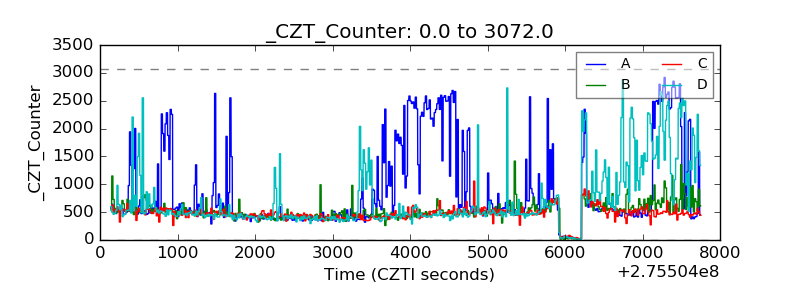 |
| +2.5 Volts monitor |  |
| +5 Volts monitor | 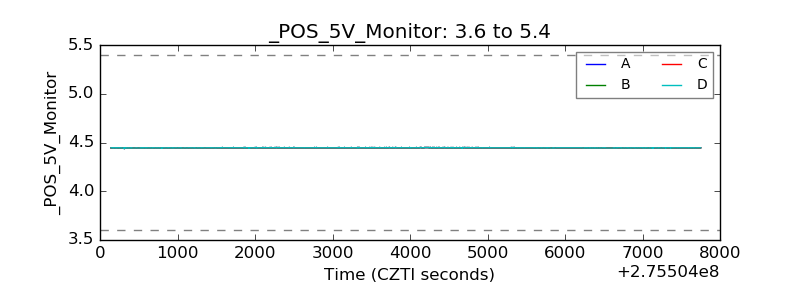 |
| _ROLL_ROT | 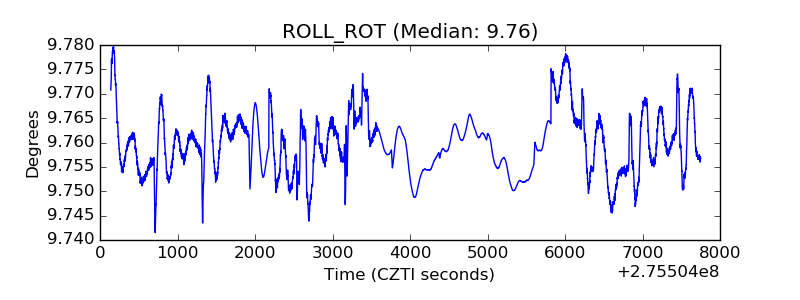 |
| _Roll_DEC | 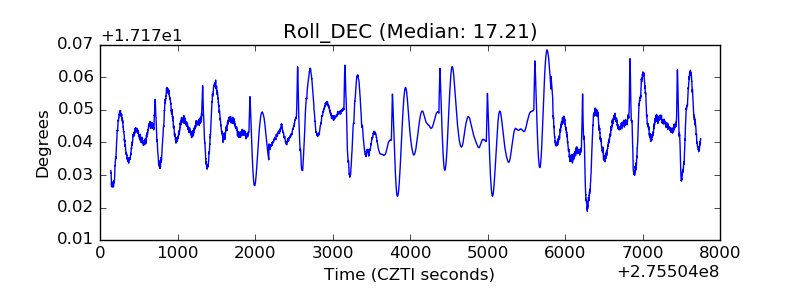 |
| _Roll_RA | 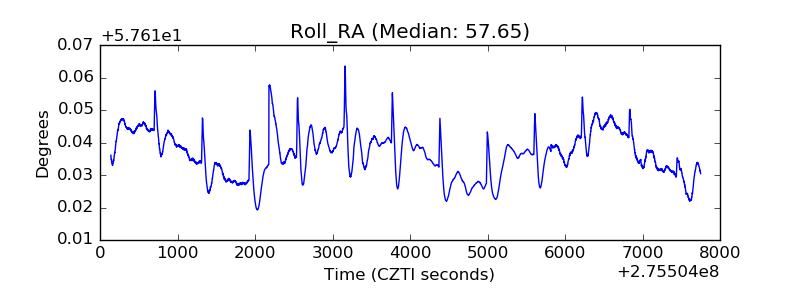 |
| Veto Counter | 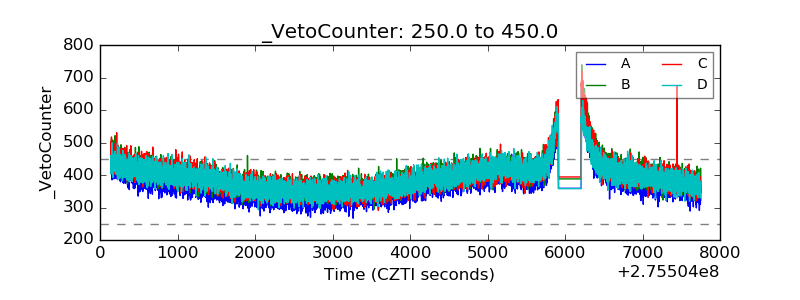 |