| Param | Original file | Final file |
|---|---|---|
| Filename | modeM0/AS1T02_109T01_9000002386_16173cztM0_level2.evt | modeM0/AS1T02_109T01_9000002386_16173cztM0_level2_quad_clean.evt |
| Size (bytes) | 1,444,406,400 | 231,232,320 |
| Size | 1.3 GB | 220.5 MB |
| Events in quadrant A | 11,915,948 | 1,403,426 |
| Events in quadrant B | 9,067,023 | 1,509,150 |
| Events in quadrant C | 9,776,087 | 1,446,067 |
| Events in quadrant D | 11,768,179 | 1,402,236 |
| Mode M0 | |||
|---|---|---|---|
| Quadrant | BADHDUFLAG | Total packets | Discarded packets |
| A | 0 | 47811 | 5 |
| B | 0 | 38842 | 4 |
| C | 0 | 40577 | 4 |
| D | 0 | 47684 | 4 |
| Mode SS | |||
|---|---|---|---|
| Quadrant | BADHDUFLAG | Total packets | Discarded packets |
| A | 0 | 366 | 0 |
| B | 0 | 366 | 0 |
| C | 0 | 366 | 0 |
| D | 0 | 366 | 0 |
| Mode M9 | |||
|---|---|---|---|
| Quadrant | BADHDUFLAG | Total packets | Discarded packets |
| A | 0 | 12 | 0 |
| B | 0 | 12 | 0 |
| C | 0 | 12 | 0 |
| D | 0 | 12 | 0 |
| Quadrant | Total seconds | Saturated seconds | Saturation percentage |
|---|---|---|---|
| A | 18022 | 1497 | 8.306514% |
| B | 18022 | 235 | 1.303962% |
| C | 18022 | 448 | 2.485851% |
| D | 18022 | 863 | 4.788592% |
Noise dominated data is calculated using 1-second bins in cleaned event files. If a bin has >2000 counts, and if more than 50% of those come from <1% of pixels, then it is considered to be noise-dominated and hence unusable.
| Quadrant | # 1 sec bins | Bins with >0 counts | Bins with >2000 counts | High rate bins dominated by noise | Noise dominated (total time) | Noise dominated (detector-on time) | Marked lightcurve |
|---|---|---|---|---|---|---|---|
| A | 19263 | 18027 | 1119 | 1119 | 5.81% | 6.21% | 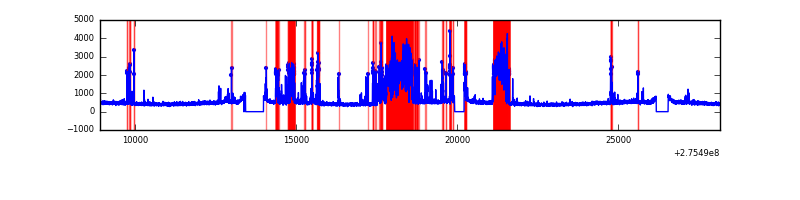 |
| B | 19263 | 18027 | 16 | 16 | 0.08% | 0.09% | 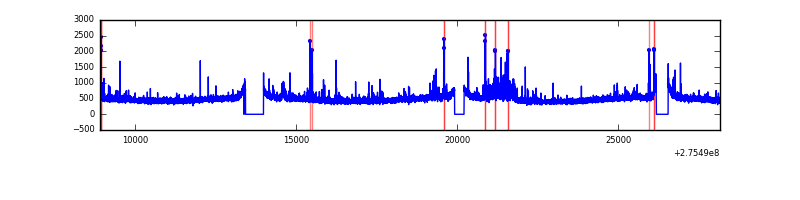 |
| C | 19263 | 18027 | 94 | 94 | 0.49% | 0.52% | 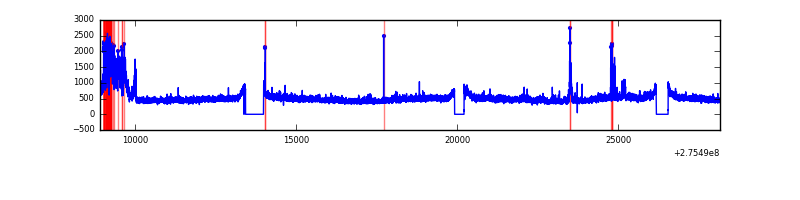 |
| D | 19263 | 18027 | 702 | 702 | 3.64% | 3.89% | 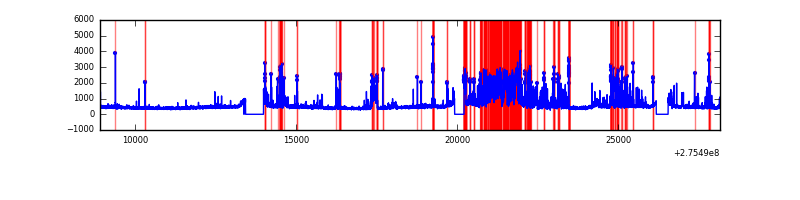 |
Top three noisy pixels from each quadrant. If the there are fewer than three noisy pixels in the level2.evt file, extra rows are filled as -1
| Pixel properties | Quadrant properties | ||||||
|---|---|---|---|---|---|---|---|
| Quadrant | DetID | PixID | Counts | Sigma | Mean | Median | Sigma |
| A | 15 | 174 | 3882692 | 9177.32 | 2082 | 2037 | 422.9 |
| A | 0 | 253 | 31287 | 69.17 | 2082 | 2037 | 422.9 |
| A | 0 | 226 | 18390 | 38.67 | 2082 | 2037 | 422.9 |
| B | 0 | 244 | 232172 | 562.4 | 2162 | 2110 | 409.1 |
| B | 4 | 216 | 72426 | 171.89 | 2162 | 2110 | 409.1 |
| B | 0 | 189 | 69644 | 165.09 | 2162 | 2110 | 409.1 |
| C | 3 | 233 | 1158477 | 2404.23 | 2065 | 2075 | 481.0 |
| C | 14 | 238 | 315989 | 652.65 | 2065 | 2075 | 481.0 |
| C | 7 | 247 | 171844 | 352.96 | 2065 | 2075 | 481.0 |
| D | 1 | 52 | 2551268 | 5022.33 | 2071 | 2011 | 507.6 |
| D | 2 | 33 | 1081766 | 2127.24 | 2071 | 2011 | 507.6 |
| D | 15 | 0 | 90135 | 173.61 | 2071 | 2011 | 507.6 |
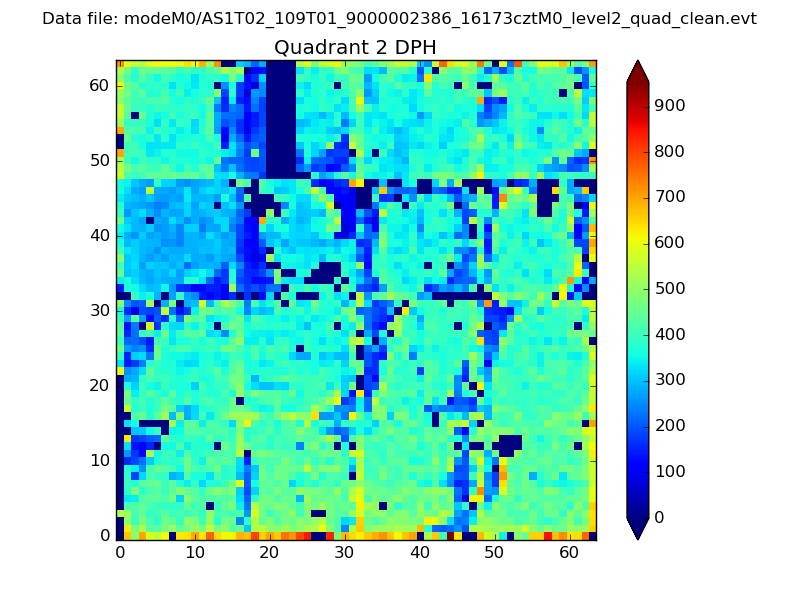
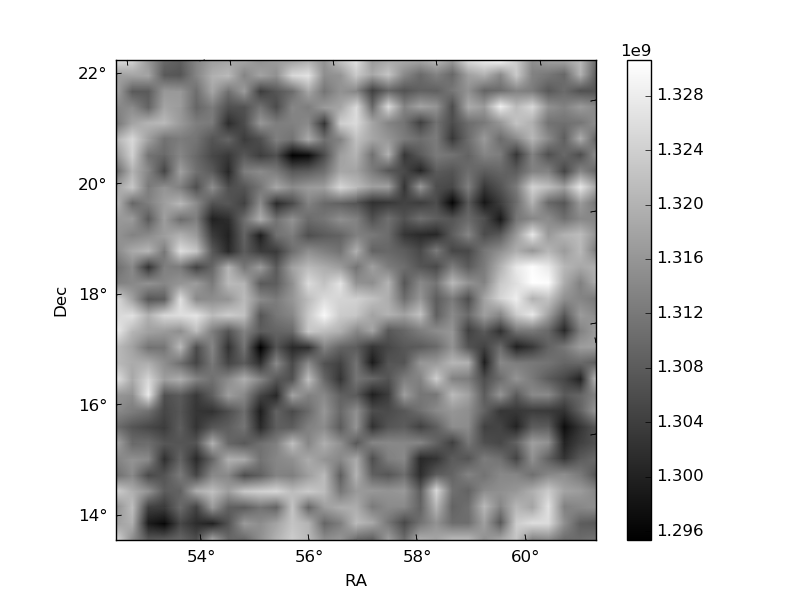
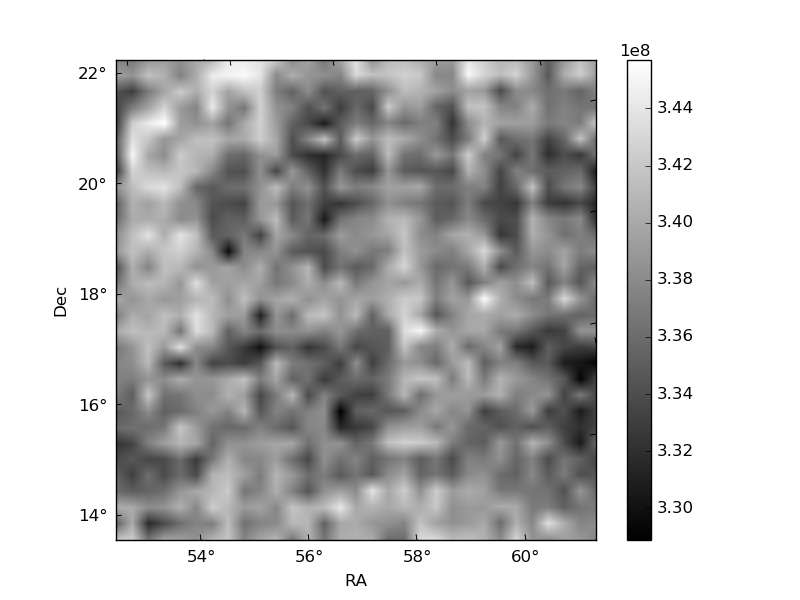
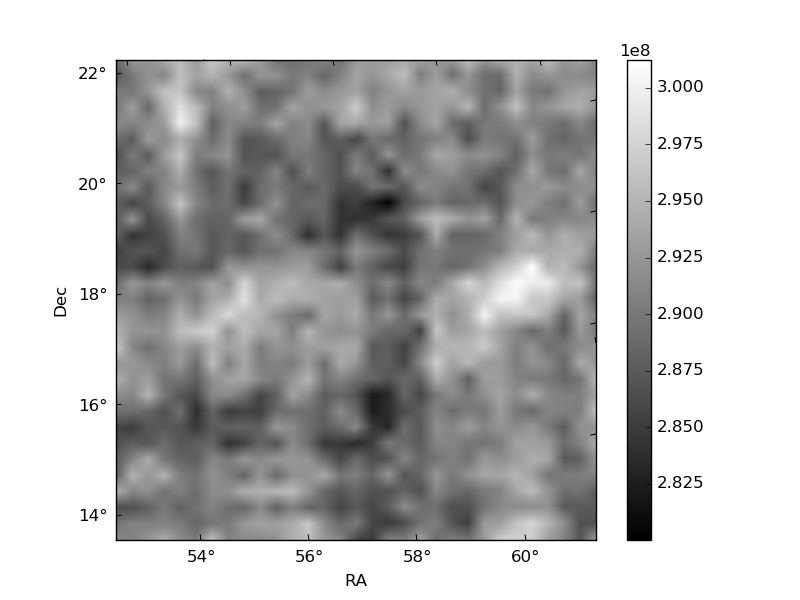
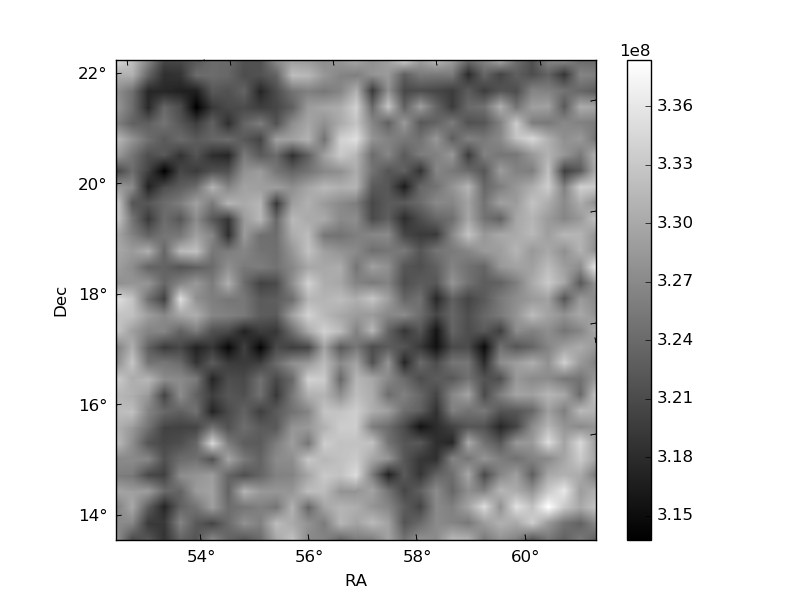
Histogram calculated using DETX and DETY for each event in the final _common_clean file
| Quadrant A | 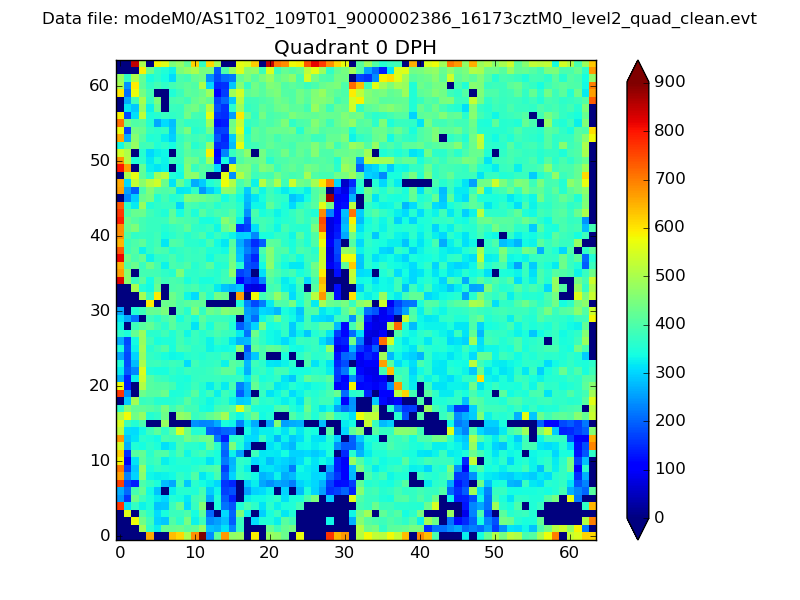 |
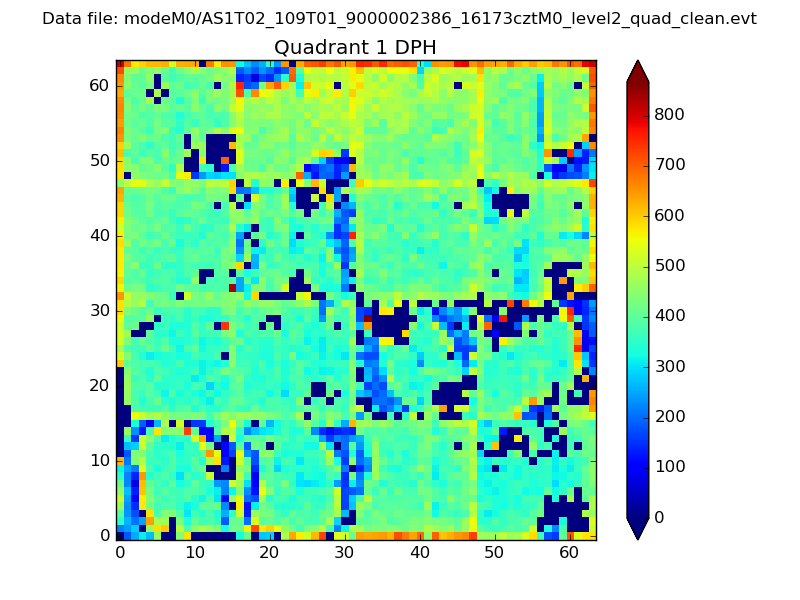 |
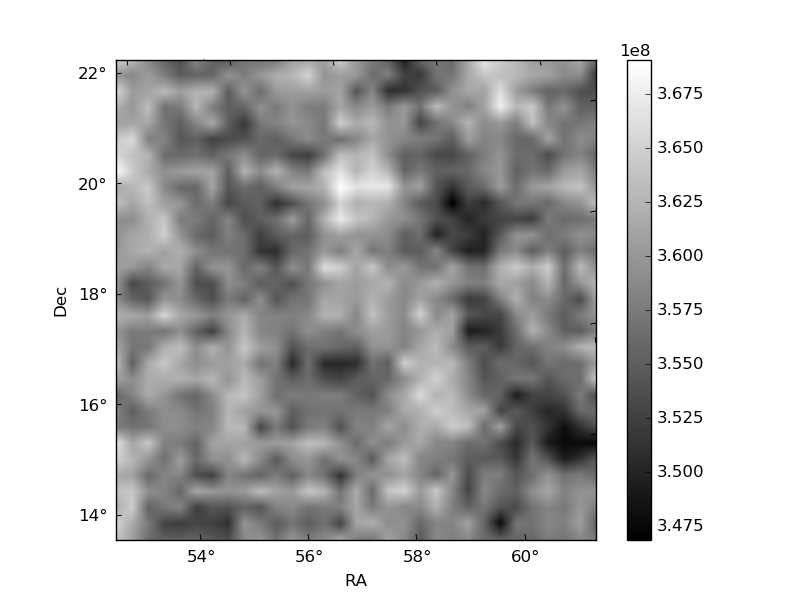
Quadrant B |
|---|---|---|---|
| Quadrant D | 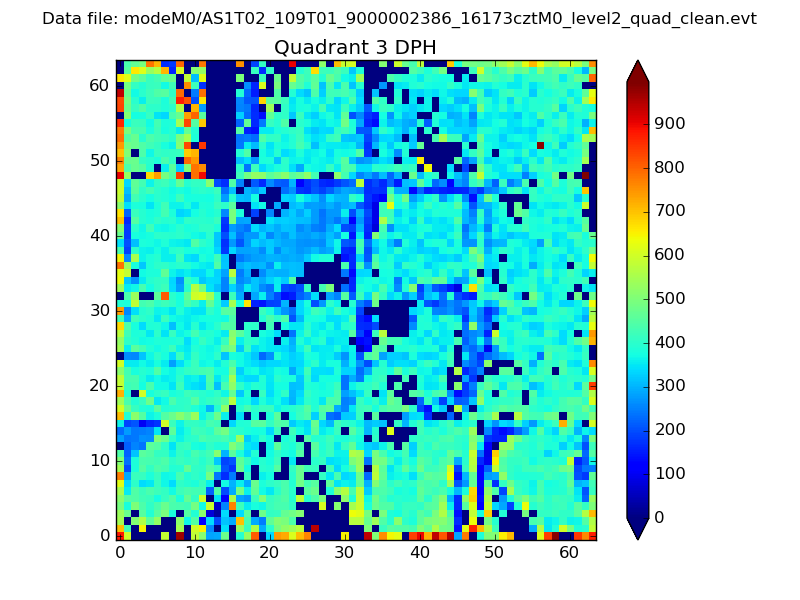 |
 |
Quadrant C |
| Plot type | Count rate plots | Images |
|---|---|---|
| Comparison with Poisson distribution Blue bars denote a histogram of data divided into 1 sec bins. Red curve is a Poisson curve with rate = median count rate of data. |
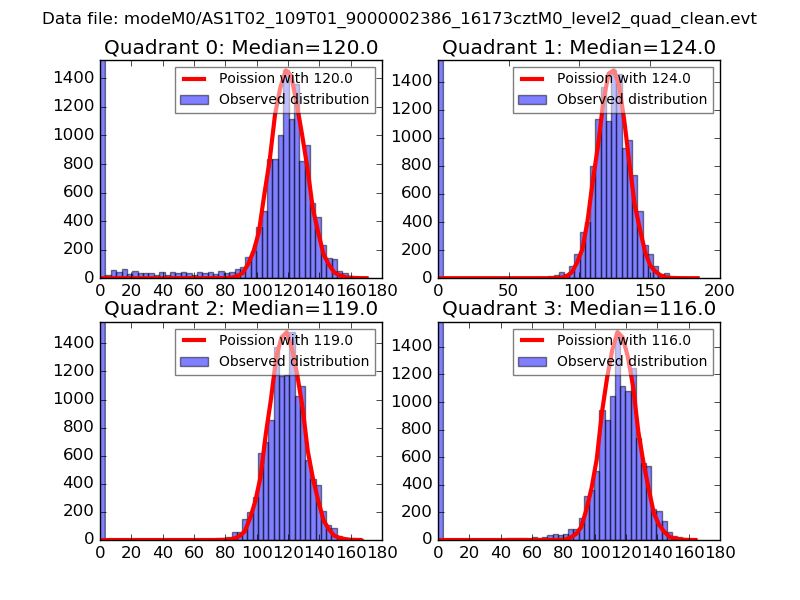 |
 |
| Quadrant-wise count rates Data is divided into 100 sec bins |
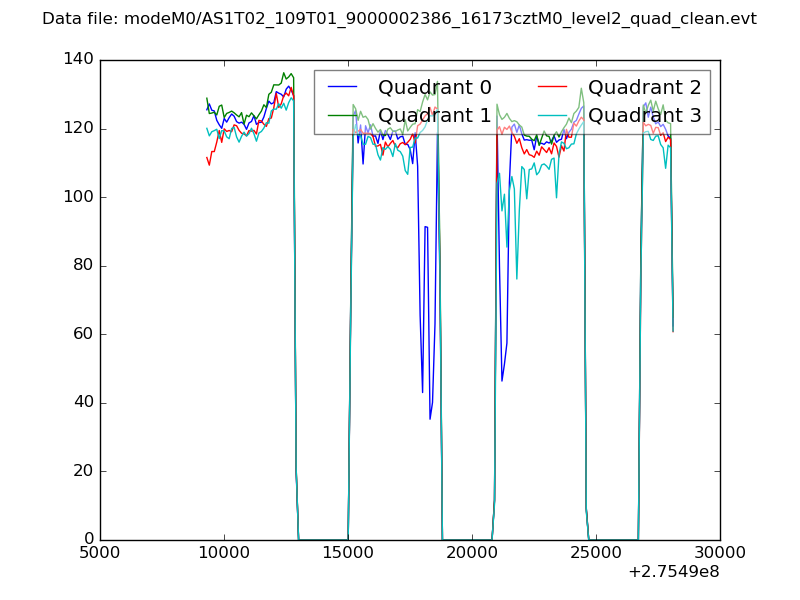 |
|
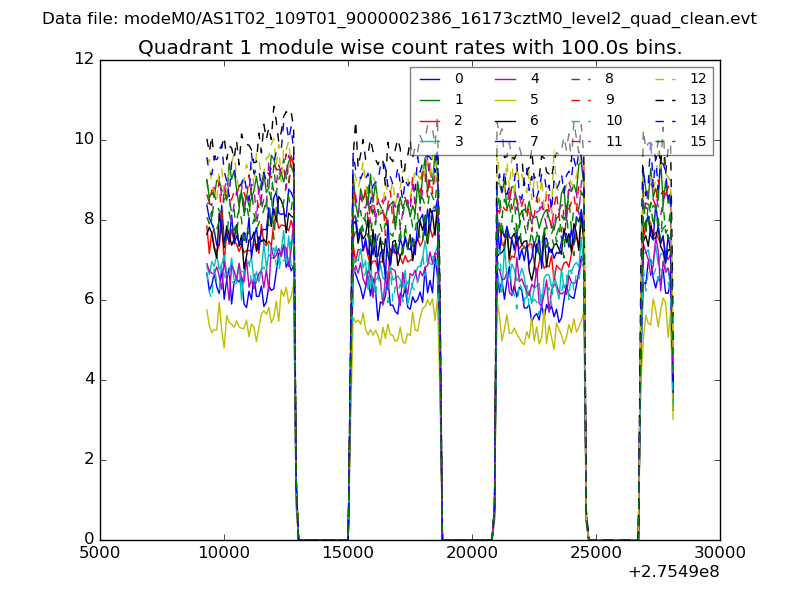
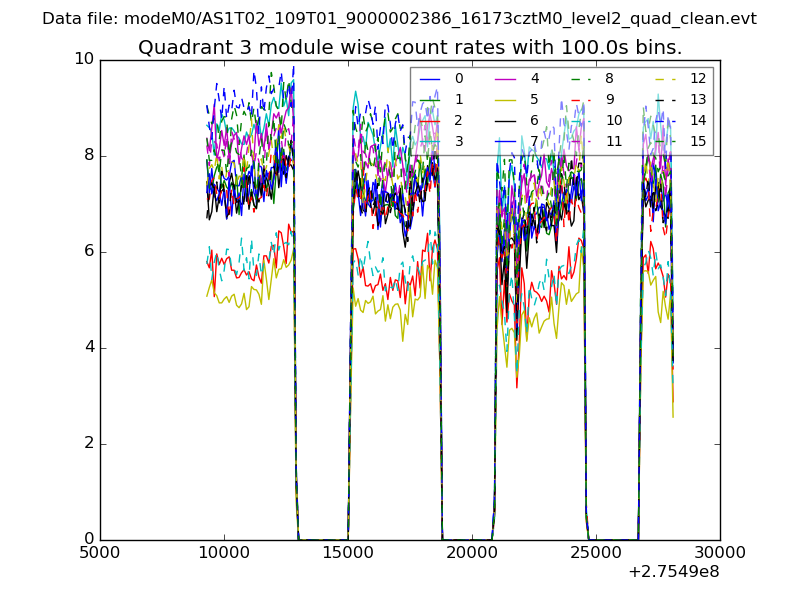
| Module-wise count rates for Quadrant A Data is divided into 100 sec bins |
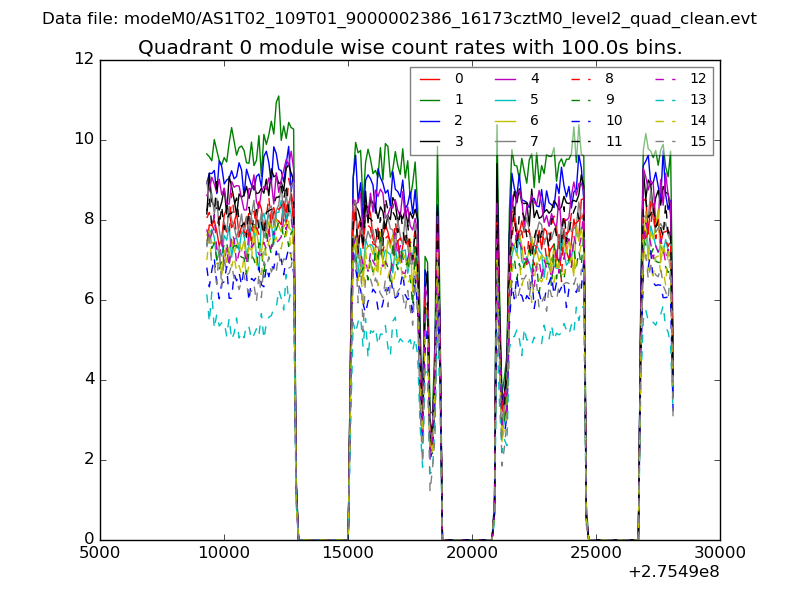 |
 |
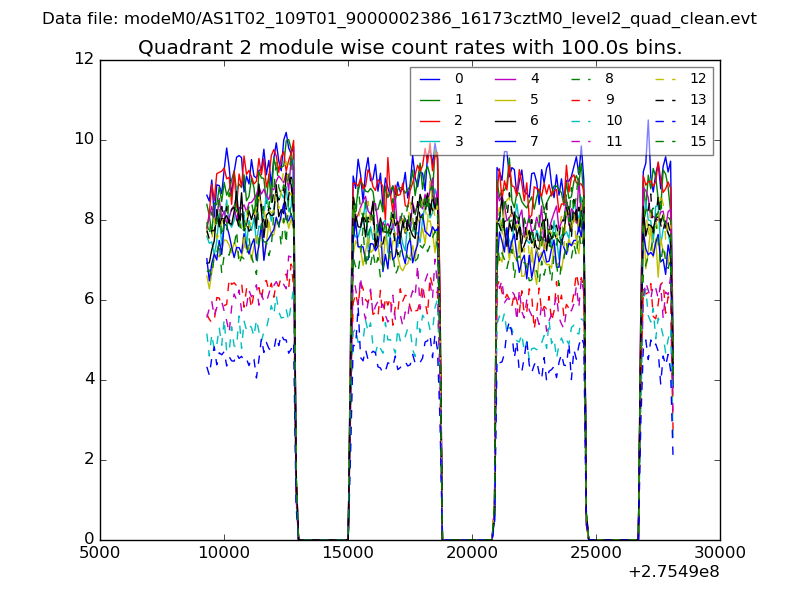
| Module-wise count rates for Quadrant B Data is divided into 100 sec bins |
 |
 |
| Module-wise count rates for Quadrant C Data is divided into 100 sec bins |
 |
 |
| Module-wise count rates for Quadrant D Data is divided into 100 sec bins |
 |
 |
| Parameter | Plot |
|---|---|
| CZT HV Monitor | 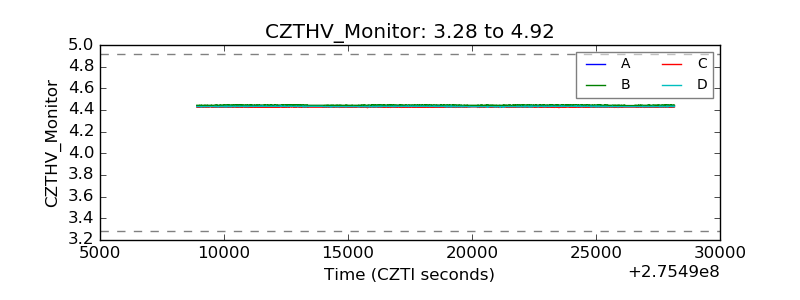 |
| D_VDD | 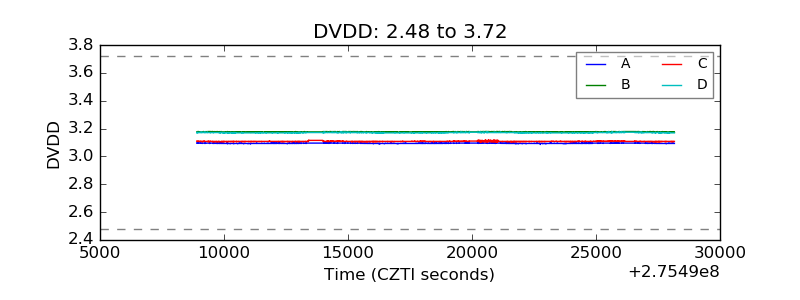 |
| Temperature 1 | 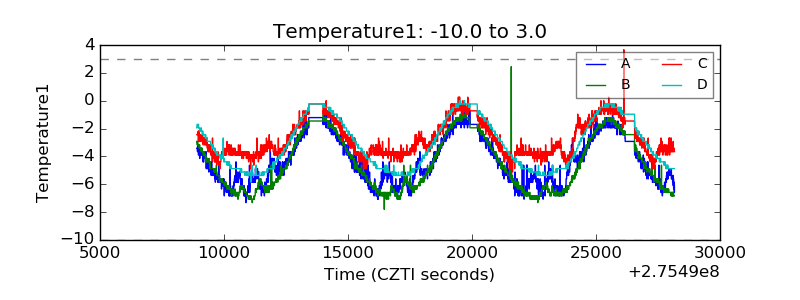 |
| Veto HV Monitor | 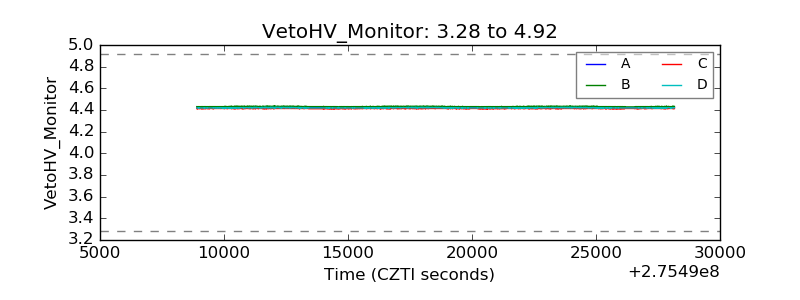 |
| Veto LLD | 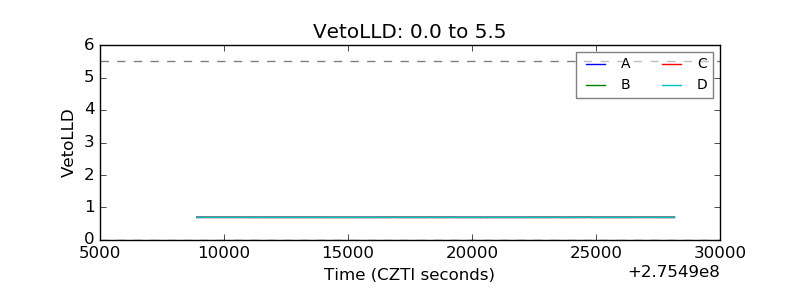 |
| Alpha Counter | 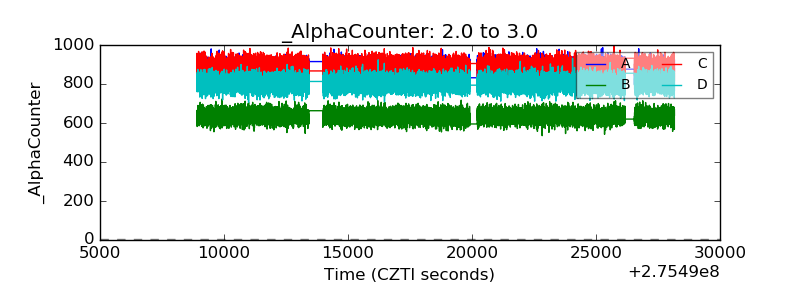 |
| _CPM_Rate | 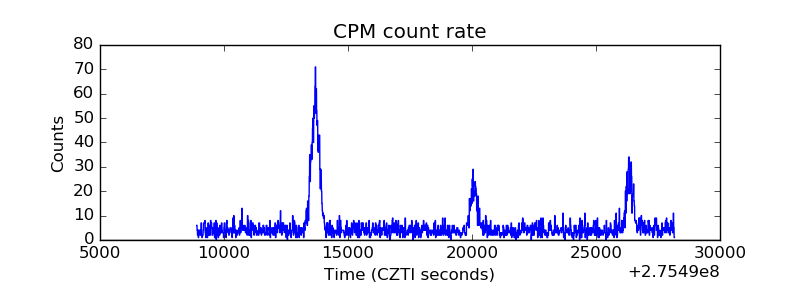 |
| CZT Counter | 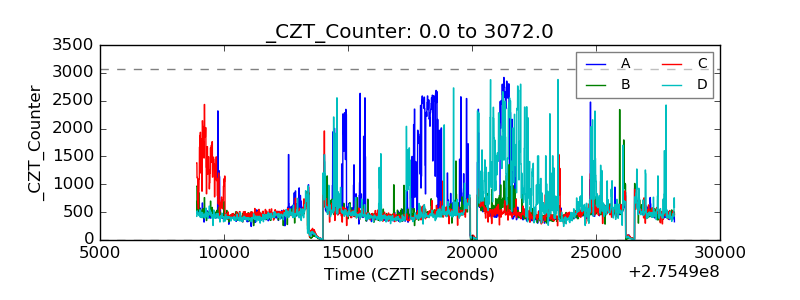 |
| +2.5 Volts monitor |  |
| +5 Volts monitor | 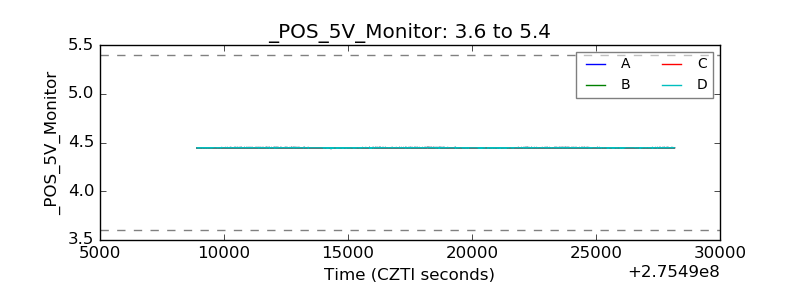 |
| _ROLL_ROT | 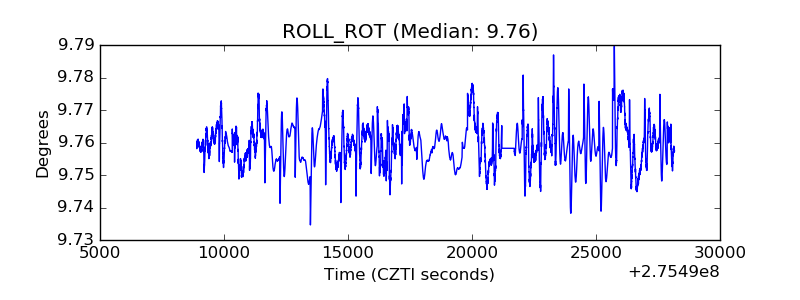 |
| _Roll_DEC | 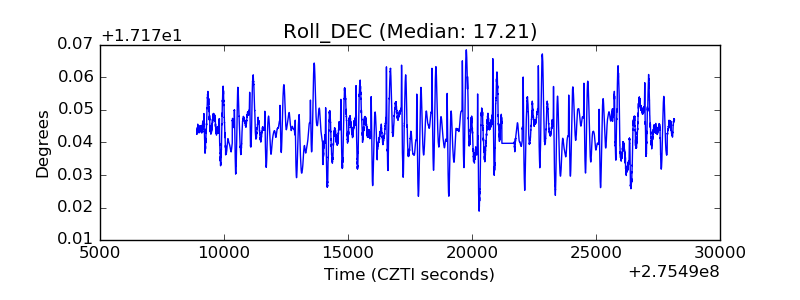 |
| _Roll_RA | 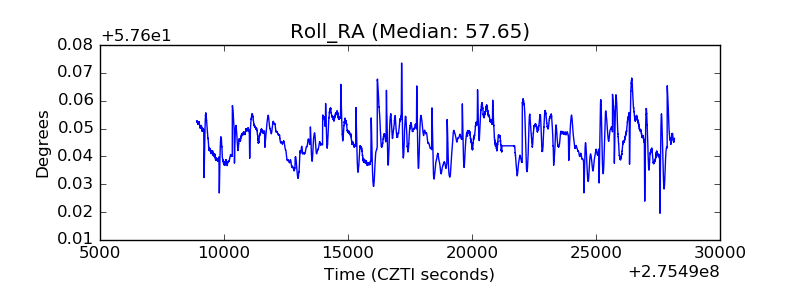 |
| Veto Counter | 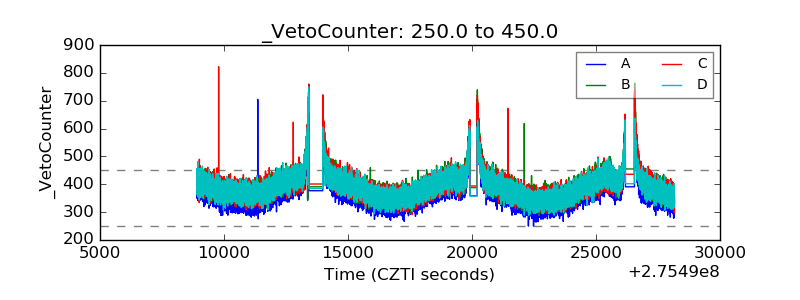 |