| Param | Original file | Final file |
|---|---|---|
| Filename | modeM0/AS1T02_109T01_9000002386_16176cztM0_level2.evt | modeM0/AS1T02_109T01_9000002386_16176cztM0_level2_quad_clean.evt |
| Size (bytes) | 338,765,760 | 53,853,120 |
| Size | 323.1 MB | 51.4 MB |
| Events in quadrant A | 2,485,594 | 320,595 |
| Events in quadrant B | 2,439,663 | 335,257 |
| Events in quadrant C | 2,347,706 | 318,427 |
| Events in quadrant D | 2,652,165 | 311,957 |
| Mode M0 | |||
|---|---|---|---|
| Quadrant | BADHDUFLAG | Total packets | Discarded packets |
| A | 0 | 11508 | 996 |
| B | 0 | 11202 | 708 |
| C | 0 | 10856 | 730 |
| D | 0 | 12089 | 726 |
| Mode SS | |||
|---|---|---|---|
| Quadrant | BADHDUFLAG | Total packets | Discarded packets |
| A | 0 | 108 | 8 |
| B | 0 | 108 | 8 |
| C | 0 | 108 | 6 |
| D | 0 | 108 | 6 |
| Mode M9 | |||
|---|---|---|---|
| Quadrant | BADHDUFLAG | Total packets | Discarded packets |
| A | 0 | 8 | 0 |
| B | 0 | 8 | 0 |
| C | 0 | 8 | 0 |
| D | 0 | 8 | 0 |
| Quadrant | Total seconds | Saturated seconds | Saturation percentage |
|---|---|---|---|
| A | 4875 | 43 | 0.882051% |
| B | 4916 | 52 | 1.057771% |
| C | 4903 | 59 | 1.203345% |
| D | 4914 | 90 | 1.831502% |
Noise dominated data is calculated using 1-second bins in cleaned event files. If a bin has >2000 counts, and if more than 50% of those come from <1% of pixels, then it is considered to be noise-dominated and hence unusable.
| Quadrant | # 1 sec bins | Bins with >0 counts | Bins with >2000 counts | High rate bins dominated by noise | Noise dominated (total time) | Noise dominated (detector-on time) | Marked lightcurve |
|---|---|---|---|---|---|---|---|
| A | 5970 | 4963 | 7 | 7 | 0.12% | 0.14% | 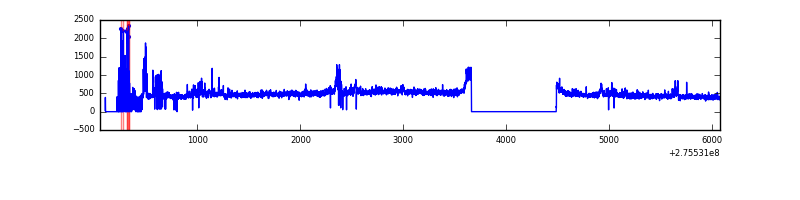 |
| B | 6022 | 4988 | 1 | 1 | 0.02% | 0.02% | 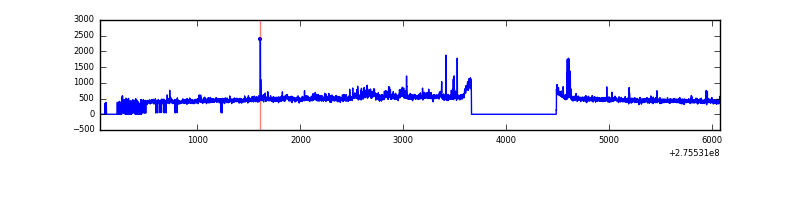 |
| C | 5970 | 4982 | 0 | 0 | 0.00% | 0.00% | 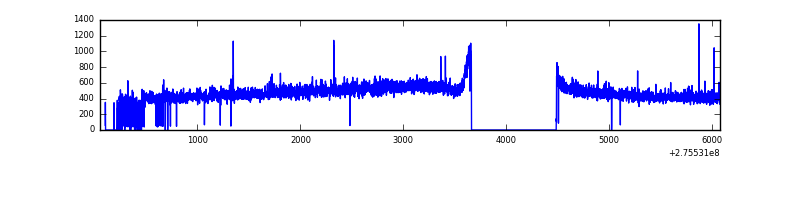 |
| D | 5964 | 4986 | 62 | 62 | 1.04% | 1.24% | 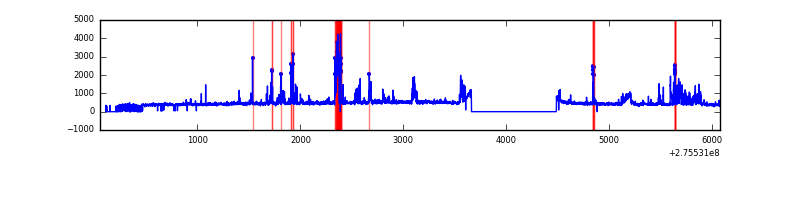 |
Top three noisy pixels from each quadrant. If the there are fewer than three noisy pixels in the level2.evt file, extra rows are filled as -1
| Pixel properties | Quadrant properties | ||||||
|---|---|---|---|---|---|---|---|
| Quadrant | DetID | PixID | Counts | Sigma | Mean | Median | Sigma |
| A | 15 | 174 | 115473 | 954.64 | 585 | 572 | 120.4 |
| A | 15 | 239 | 67360 | 554.9 | 585 | 572 | 120.4 |
| A | 0 | 253 | 31782 | 259.3 | 585 | 572 | 120.4 |
| B | 0 | 229 | 45166 | 389.59 | 589 | 574 | 114.5 |
| B | 4 | 216 | 31328 | 268.69 | 589 | 574 | 114.5 |
| B | 10 | 16 | 20873 | 177.35 | 589 | 574 | 114.5 |
| C | 14 | 238 | 87738 | 657.45 | 560 | 563 | 132.6 |
| C | 7 | 247 | 38393 | 285.3 | 560 | 563 | 132.6 |
| C | 0 | 207 | 25280 | 186.41 | 560 | 563 | 132.6 |
| D | 2 | 33 | 289026 | 2077.15 | 566 | 548 | 138.9 |
| D | 7 | 38 | 128824 | 923.63 | 566 | 548 | 138.9 |
| D | 15 | 0 | 27227 | 192.1 | 566 | 548 | 138.9 |
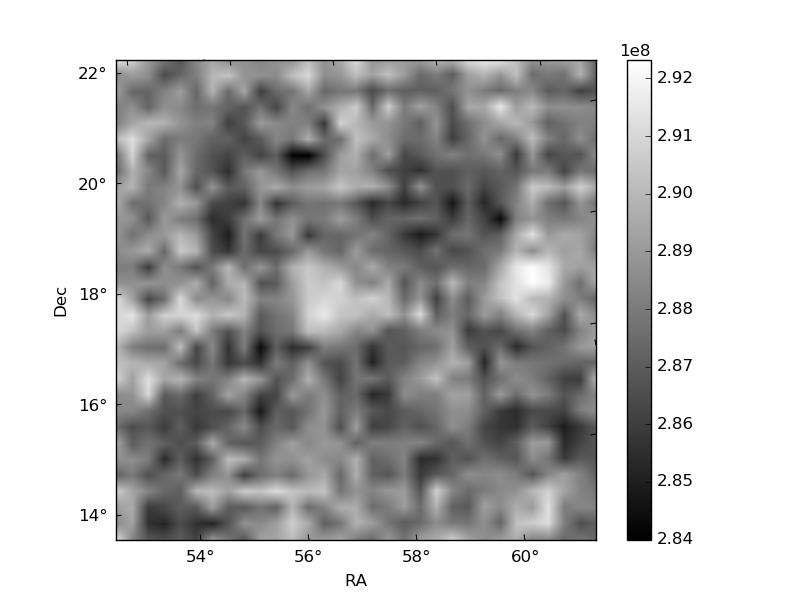
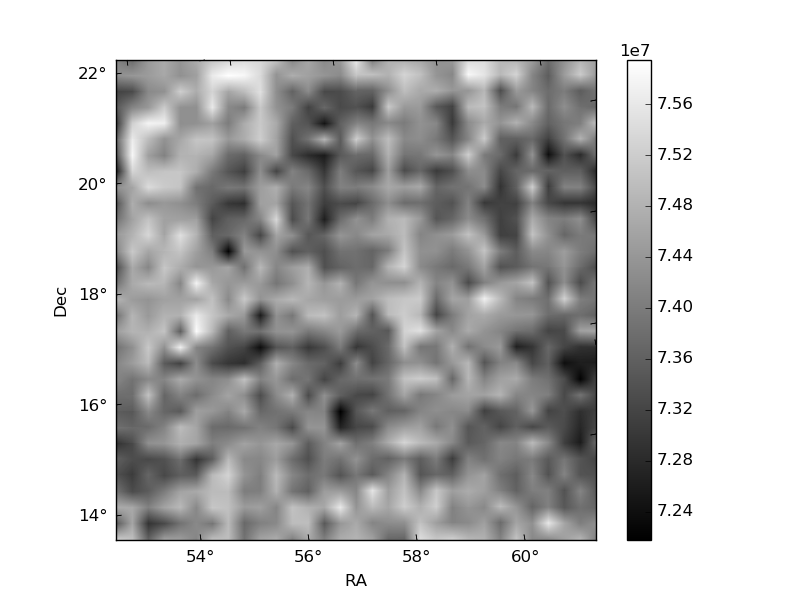
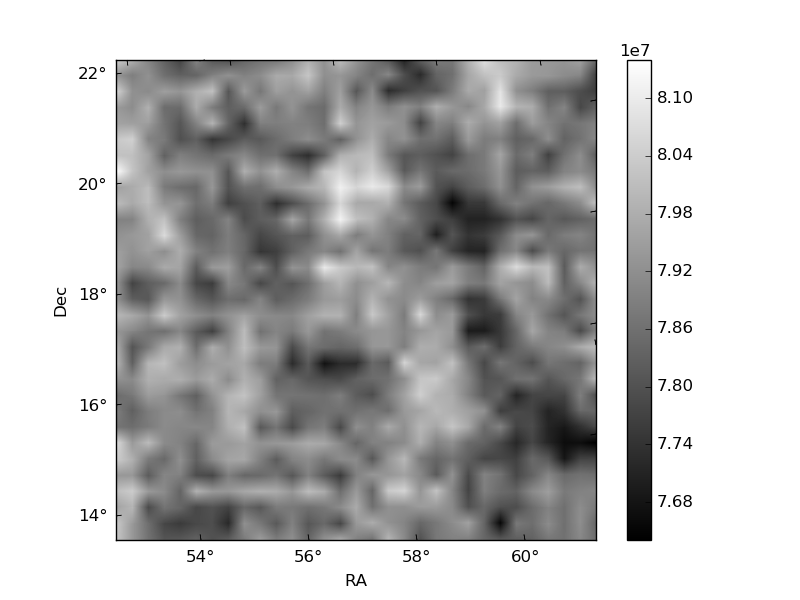
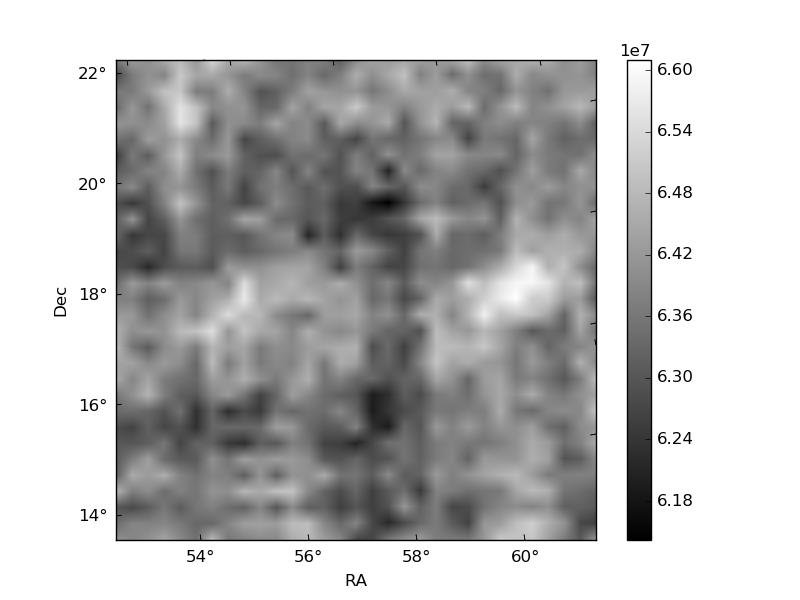
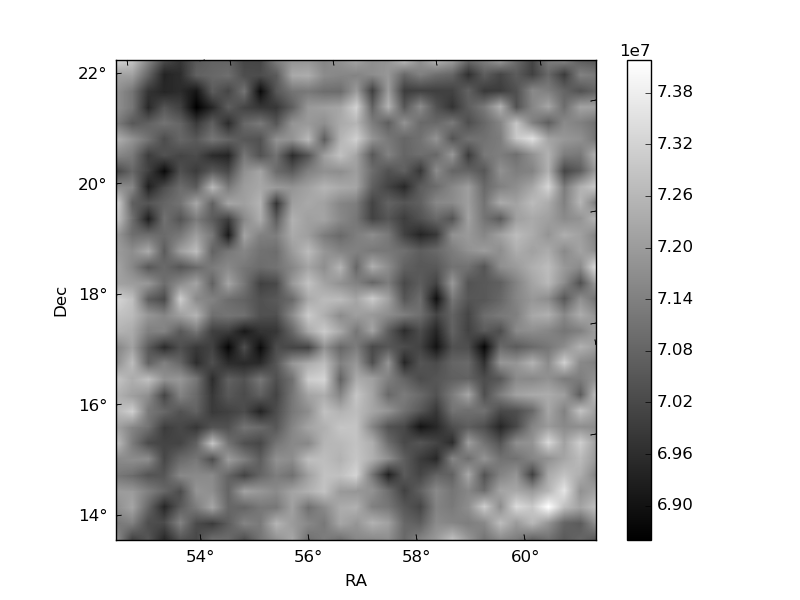
Histogram calculated using DETX and DETY for each event in the final _common_clean file
| Quadrant A | 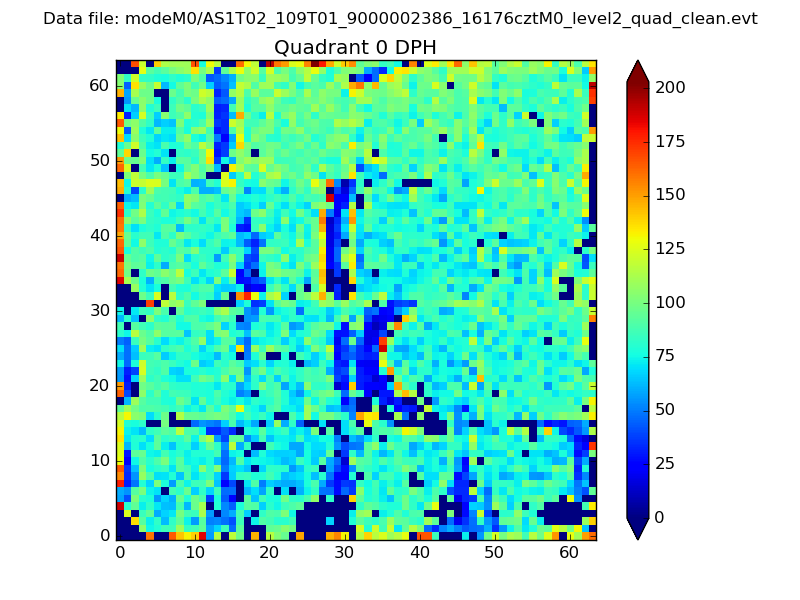 |
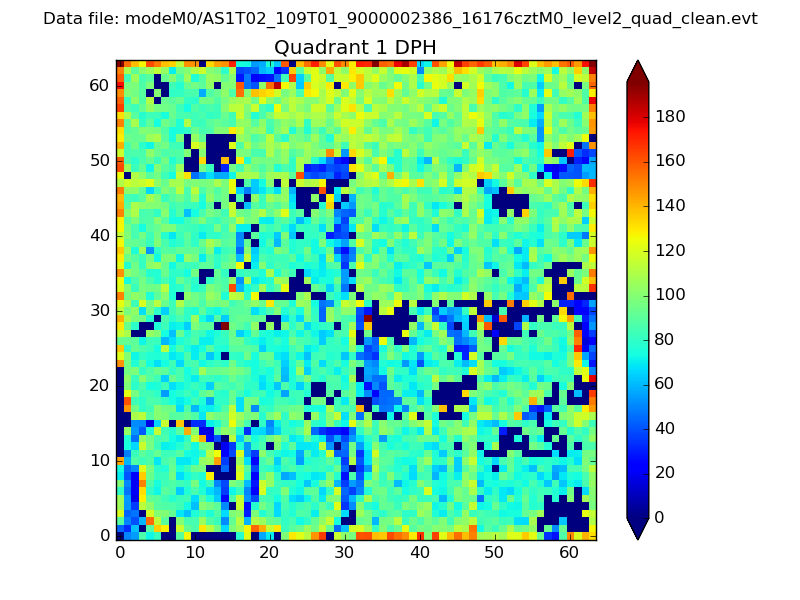 |
Quadrant B |
|---|---|---|---|
| Quadrant D | 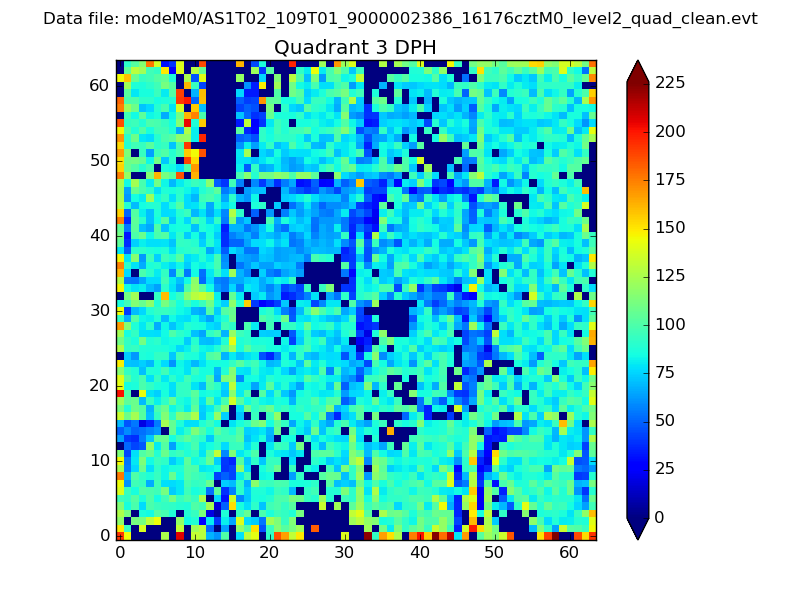 |
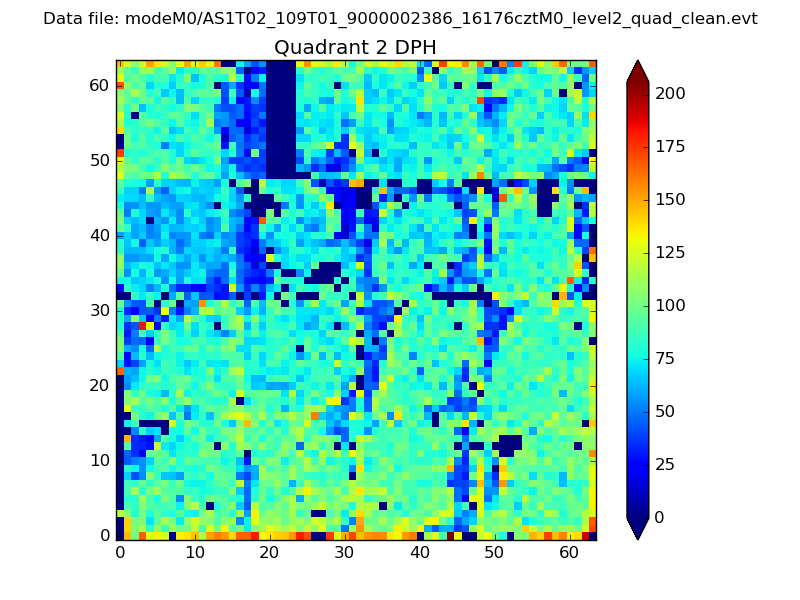 |
Quadrant C |
| Plot type | Count rate plots | Images |
|---|---|---|
| Comparison with Poisson distribution Blue bars denote a histogram of data divided into 1 sec bins. Red curve is a Poisson curve with rate = median count rate of data. |
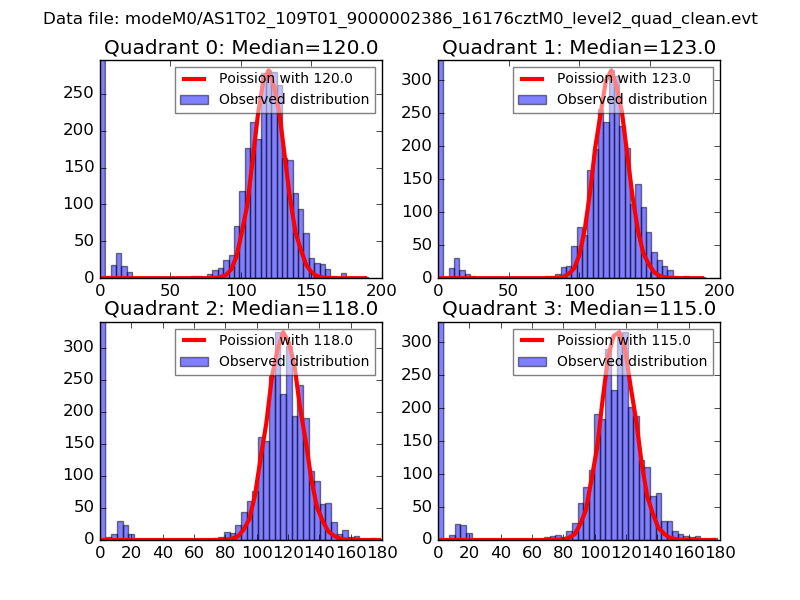 |
 |
| Quadrant-wise count rates Data is divided into 100 sec bins |
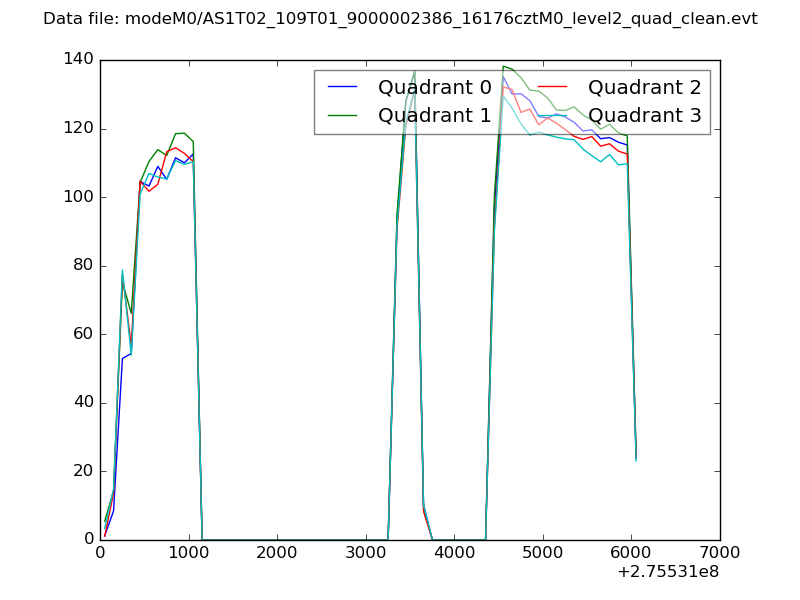 |
|
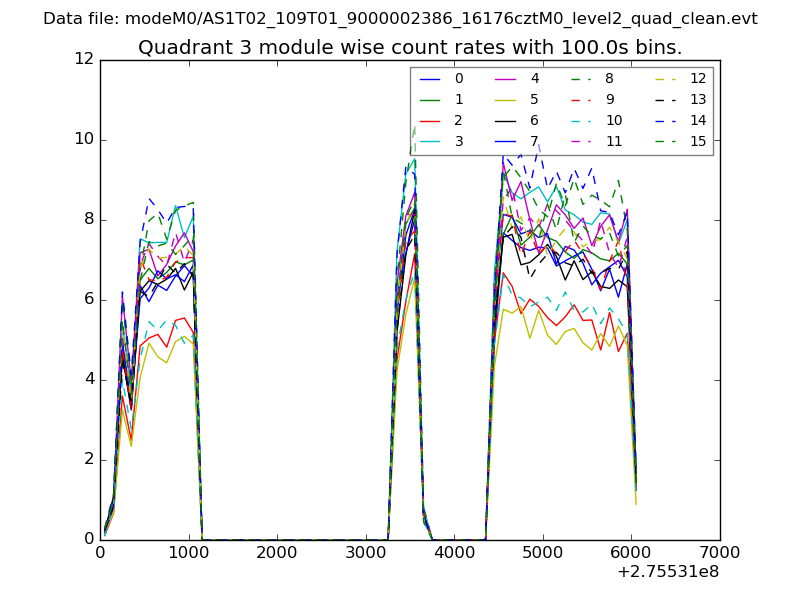
| Module-wise count rates for Quadrant A Data is divided into 100 sec bins |
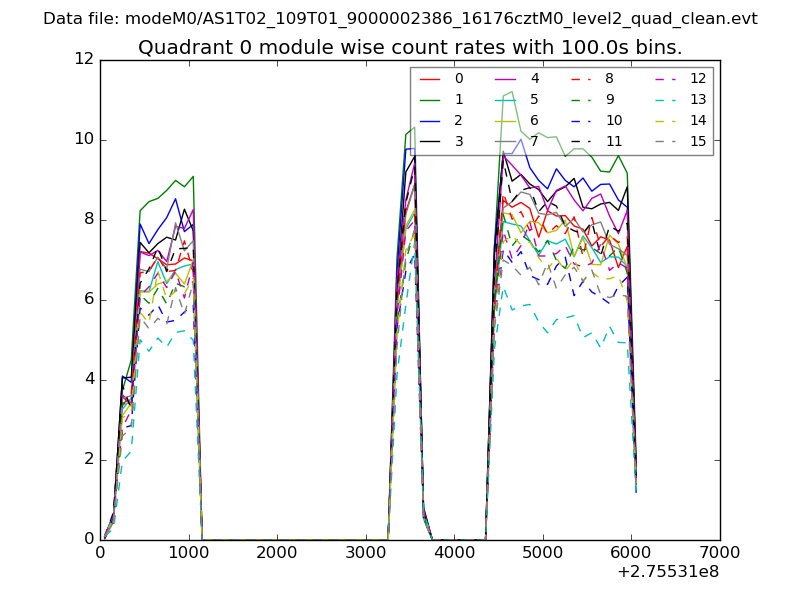 |
 |
| Module-wise count rates for Quadrant B Data is divided into 100 sec bins |
 |
 |
| Module-wise count rates for Quadrant C Data is divided into 100 sec bins |
 |
 |
| Module-wise count rates for Quadrant D Data is divided into 100 sec bins |
 |
 |
| Parameter | Plot |
|---|---|
| CZT HV Monitor |  |
| D_VDD | 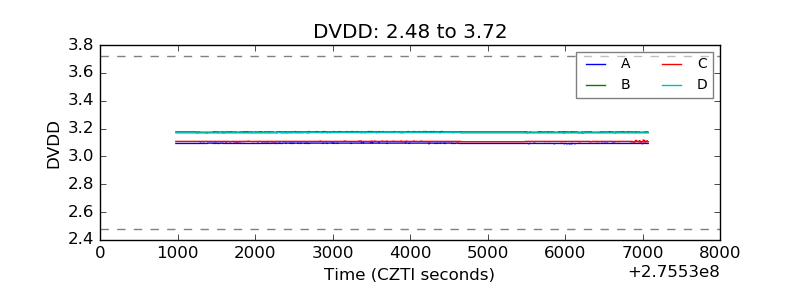 |
| Temperature 1 | 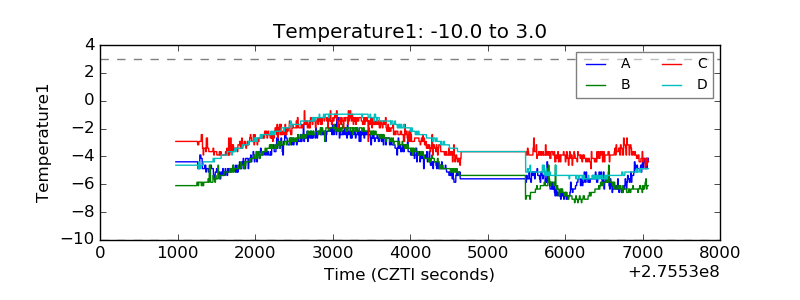 |
| Veto HV Monitor |  |
| Veto LLD | 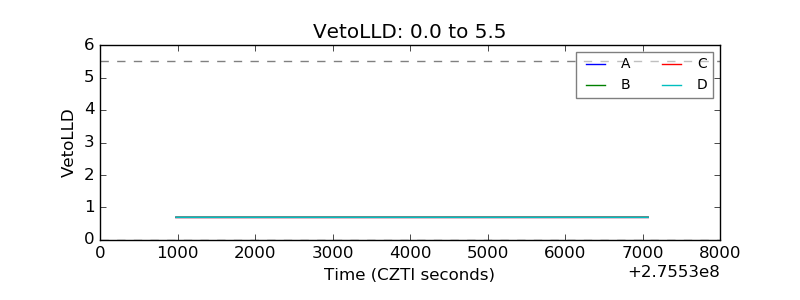 |
| Alpha Counter | 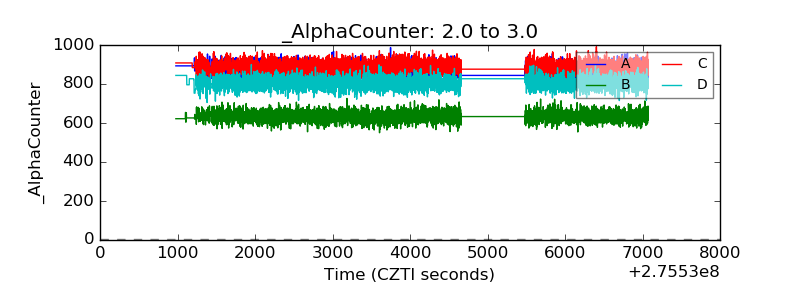 |
| _CPM_Rate | 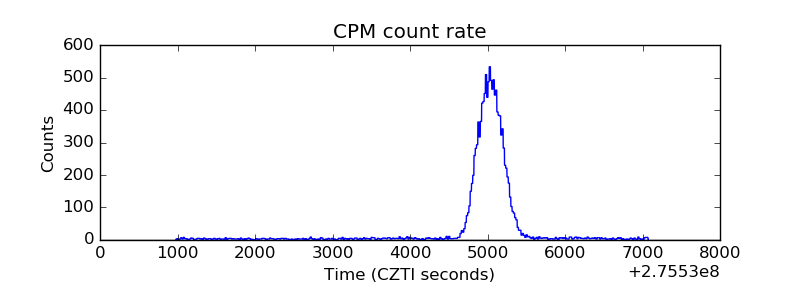 |
| CZT Counter | 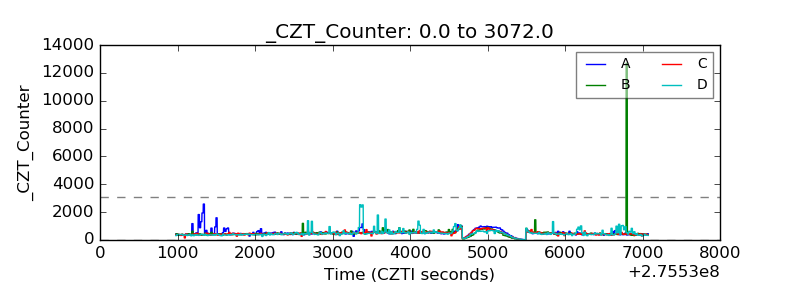 |
| +2.5 Volts monitor | 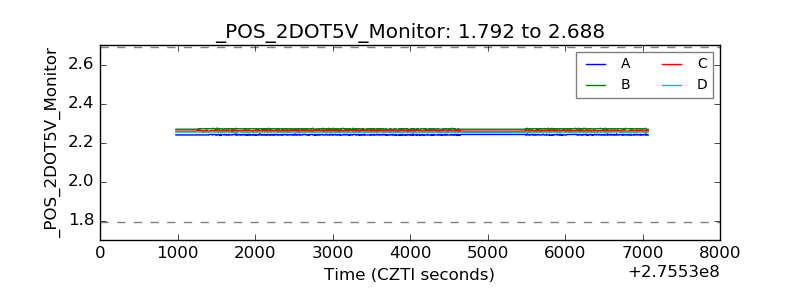 |
| +5 Volts monitor |  |
| _ROLL_ROT |  |
| _Roll_DEC | 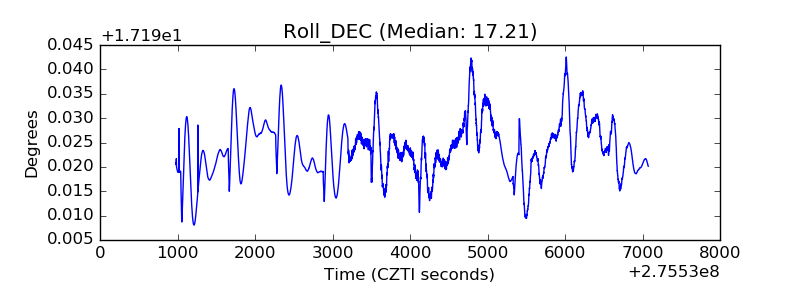 |
| _Roll_RA | 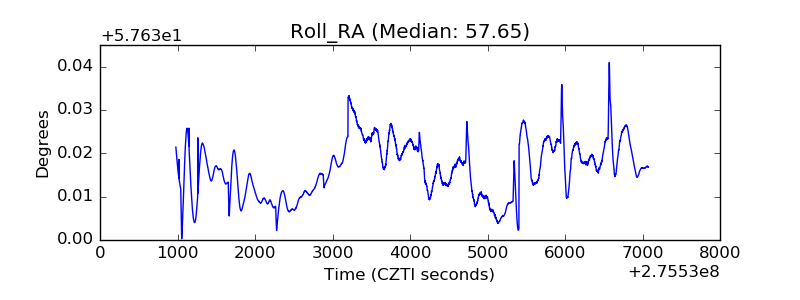 |
| Veto Counter |  |