| Param | Original file | Final file |
|---|---|---|
| Filename | modeM0/AS1T02_109T01_9000002386_16177cztM0_level2.evt | modeM0/AS1T02_109T01_9000002386_16177cztM0_level2_quad_clean.evt |
| Size (bytes) | 41,610,240 | 10,019,520 |
| Size | 39.7 MB | 9.6 MB |
| Events in quadrant A | 299,590 | 64,830 |
| Events in quadrant B | 306,390 | 65,649 |
| Events in quadrant C | 305,734 | 62,808 |
| Events in quadrant D | 307,640 | 63,363 |
| Mode M0 | |||
|---|---|---|---|
| Quadrant | BADHDUFLAG | Total packets | Discarded packets |
| A | 0 | 4111 | 2913 |
| B | 0 | 3565 | 2367 |
| C | 0 | 3479 | 2279 |
| D | 0 | 4421 | 3191 |
| Mode SS | |||
|---|---|---|---|
| Quadrant | BADHDUFLAG | Total packets | Discarded packets |
| A | 0 | 38 | 26 |
| B | 0 | 35 | 21 |
| C | 0 | 38 | 26 |
| D | 0 | 38 | 26 |
| Mode M9 | |||
|---|---|---|---|
| Quadrant | BADHDUFLAG | Total packets | Discarded packets |
| A | 0 | 2 | 0 |
| B | 0 | 1 | 0 |
| C | 0 | 1 | 0 |
| D | 0 | 1 | 0 |
| Quadrant | Total seconds | Saturated seconds | Saturation percentage |
|---|---|---|---|
| A | 555 | 8 | 1.441441% |
| B | 548 | 17 | 3.102190% |
| C | 551 | 16 | 2.903811% |
| D | 542 | 8 | 1.476015% |
Noise dominated data is calculated using 1-second bins in cleaned event files. If a bin has >2000 counts, and if more than 50% of those come from <1% of pixels, then it is considered to be noise-dominated and hence unusable.
| Quadrant | # 1 sec bins | Bins with >0 counts | Bins with >2000 counts | High rate bins dominated by noise | Noise dominated (total time) | Noise dominated (detector-on time) | Marked lightcurve |
|---|---|---|---|---|---|---|---|
| A | 914 | 651 | 0 | 0 | 0.00% | 0.00% | 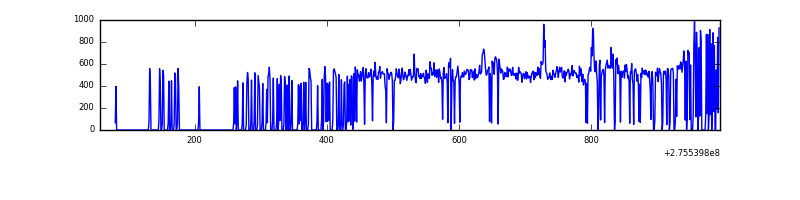 |
| B | 939 | 649 | 0 | 0 | 0.00% | 0.00% | 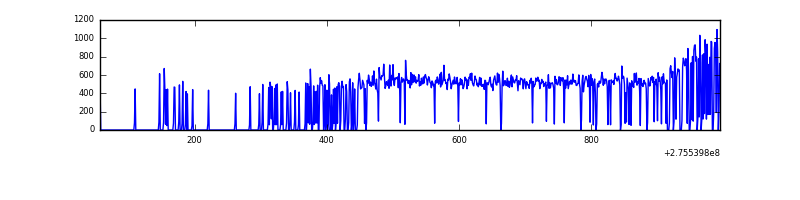 |
| C | 895 | 652 | 0 | 0 | 0.00% | 0.00% | 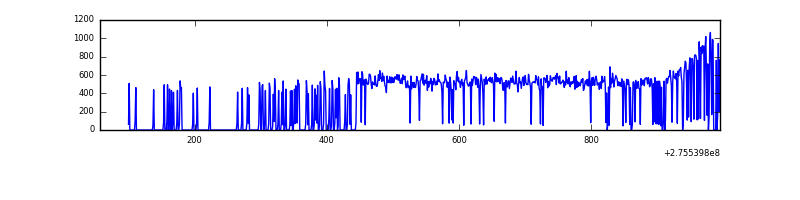 |
| D | 936 | 636 | 0 | 0 | 0.00% | 0.00% | 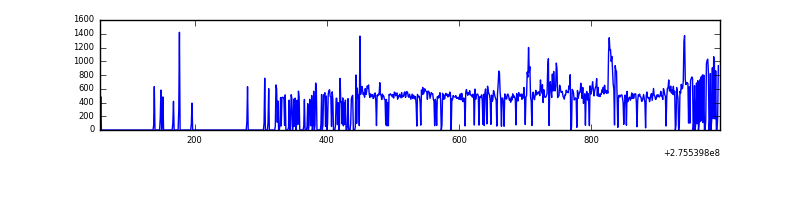 |
Top three noisy pixels from each quadrant. If the there are fewer than three noisy pixels in the level2.evt file, extra rows are filled as -1
| Pixel properties | Quadrant properties | ||||||
|---|---|---|---|---|---|---|---|
| Quadrant | DetID | PixID | Counts | Sigma | Mean | Median | Sigma |
| A | 15 | 174 | 8656 | 469.53 | 75 | 73 | 18.3 |
| A | 0 | 226 | 623 | 30.09 | 75 | 73 | 18.3 |
| A | 12 | 194 | 573 | 27.35 | 75 | 73 | 18.3 |
| B | 3 | 209 | 2465 | 136.82 | 76 | 74 | 17.5 |
| B | 12 | 111 | 1893 | 104.09 | 76 | 74 | 17.5 |
| B | 0 | 189 | 1869 | 102.72 | 76 | 74 | 17.5 |
| C | 14 | 238 | 10928 | 550.32 | 73 | 74 | 19.7 |
| C | 7 | 247 | 4191 | 208.74 | 73 | 74 | 19.7 |
| C | 8 | 128 | 1051 | 49.54 | 73 | 74 | 19.7 |
| D | 2 | 33 | 23335 | 1138.44 | 73 | 70 | 20.4 |
| D | 1 | 52 | 2685 | 127.96 | 73 | 70 | 20.4 |
| D | 7 | 55 | 2633 | 125.42 | 73 | 70 | 20.4 |
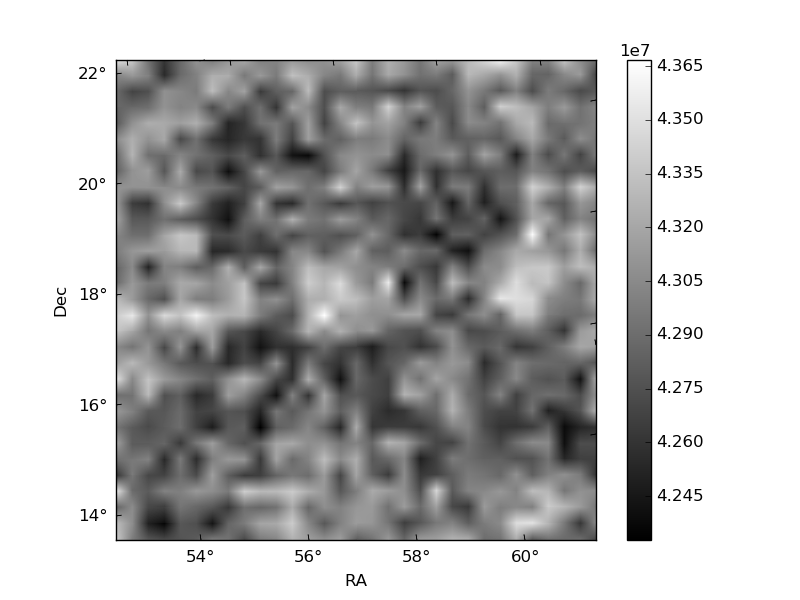
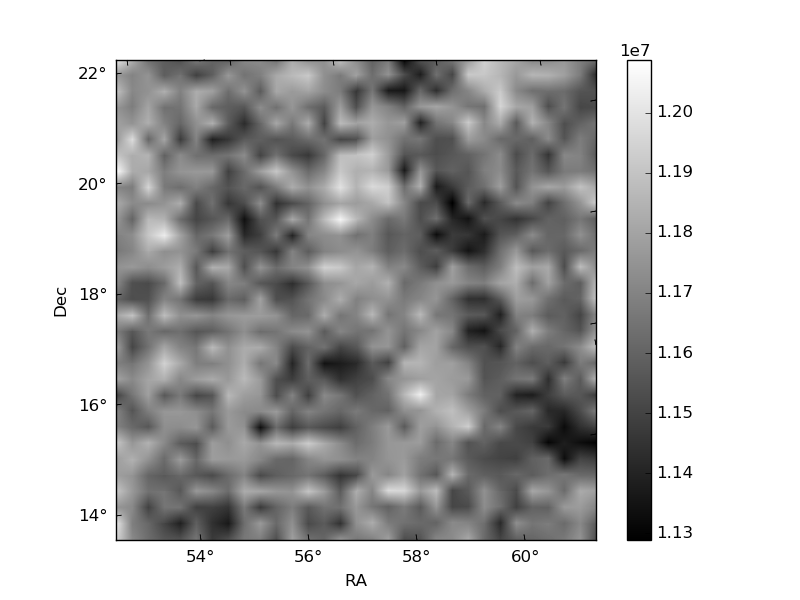
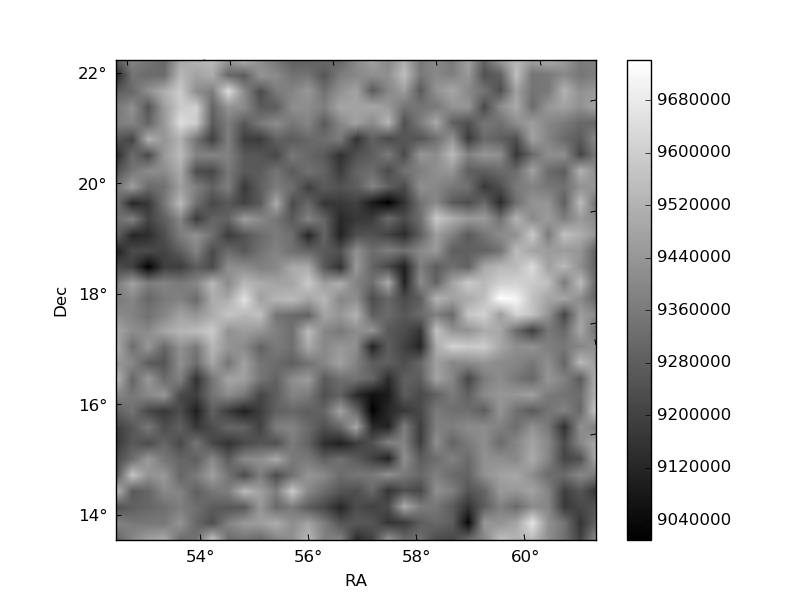
Histogram calculated using DETX and DETY for each event in the final _common_clean file
| Quadrant A | 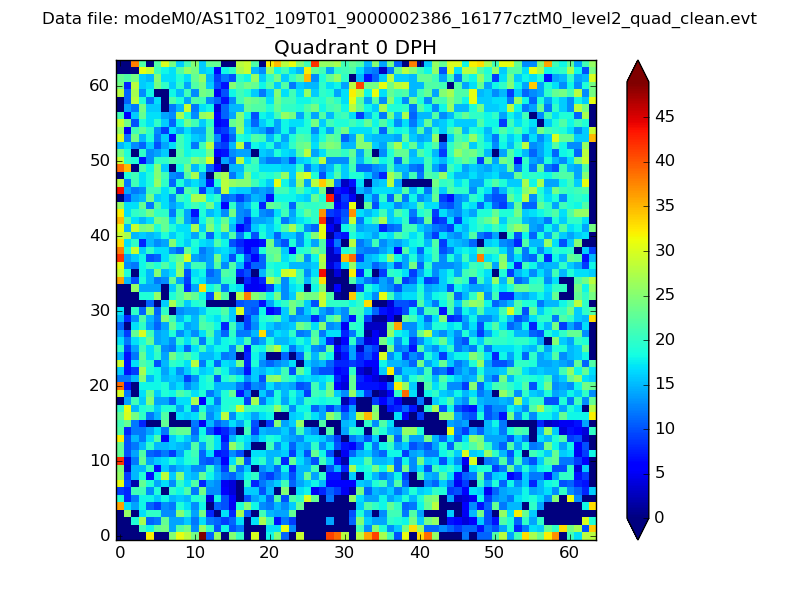 |
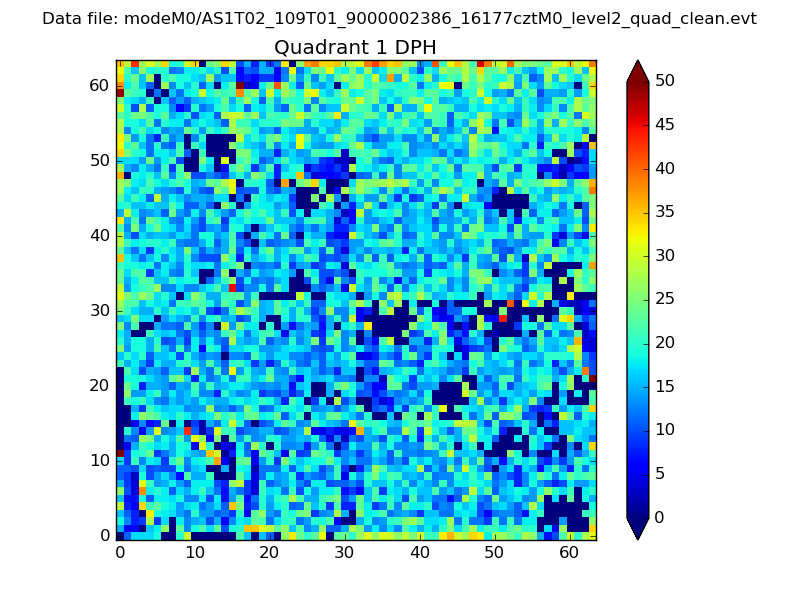 |
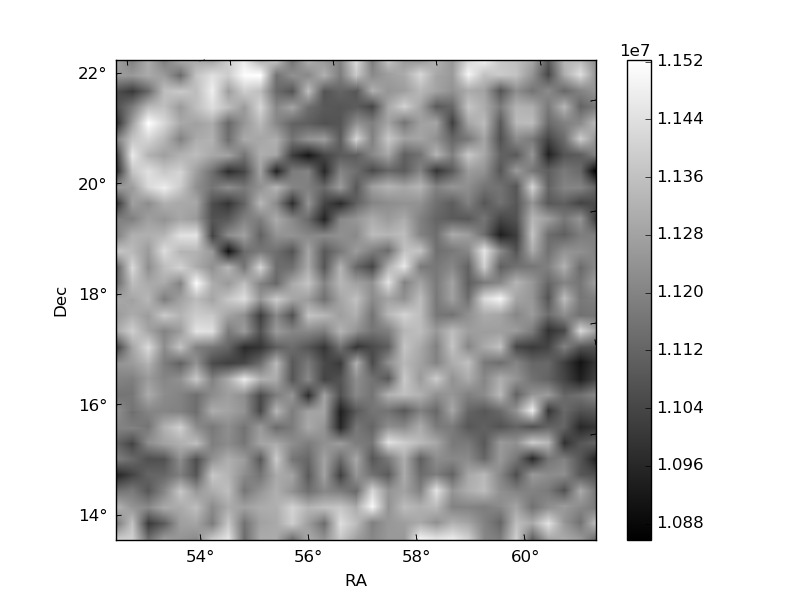
Quadrant B |
|---|---|---|---|
| Quadrant D | 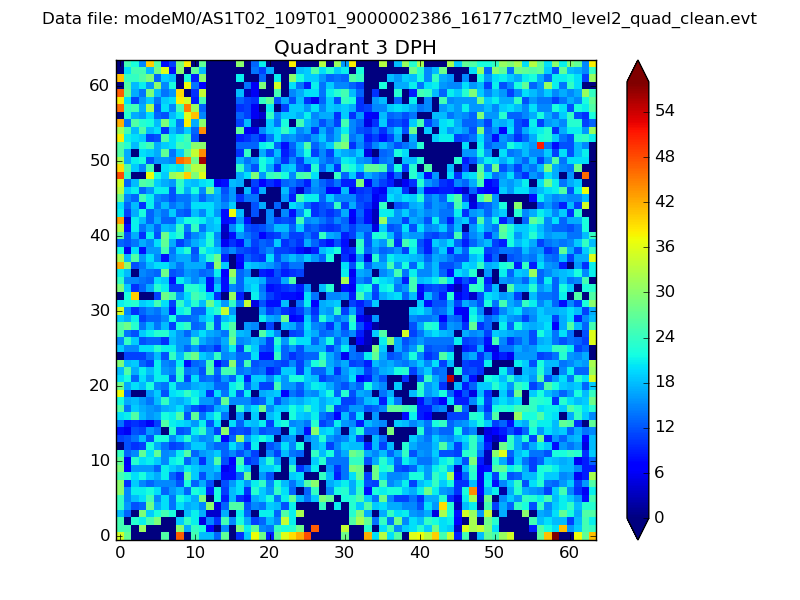 |
 |
Quadrant C |
| Plot type | Count rate plots | Images |
|---|---|---|
| Comparison with Poisson distribution Blue bars denote a histogram of data divided into 1 sec bins. Red curve is a Poisson curve with rate = median count rate of data. |
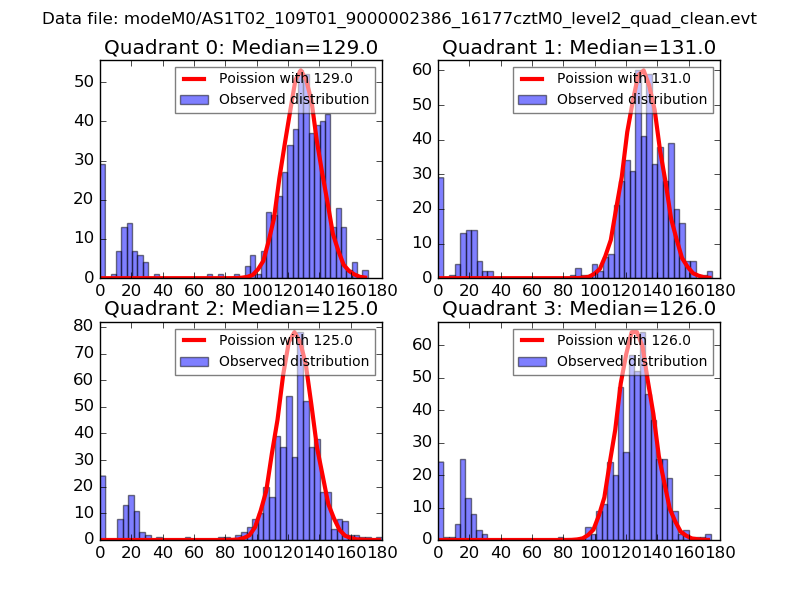 |
 |
| Quadrant-wise count rates Data is divided into 100 sec bins |
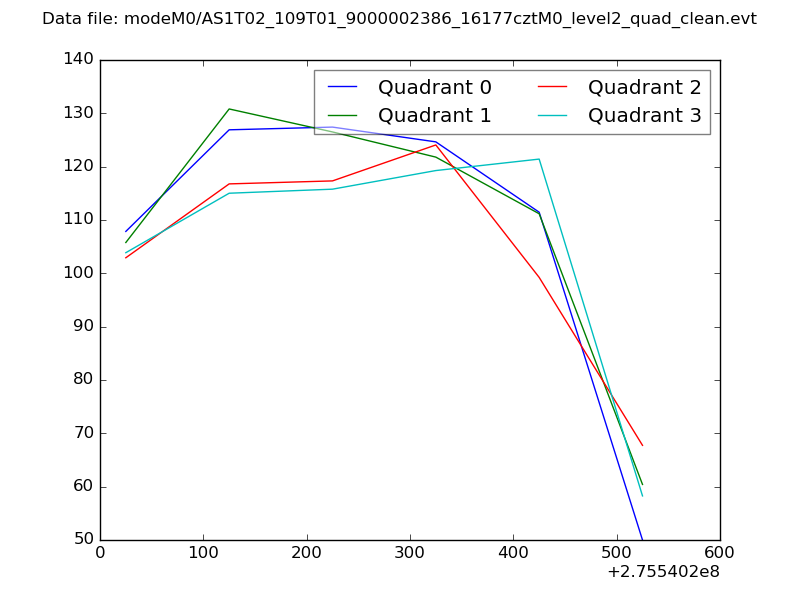 |
|
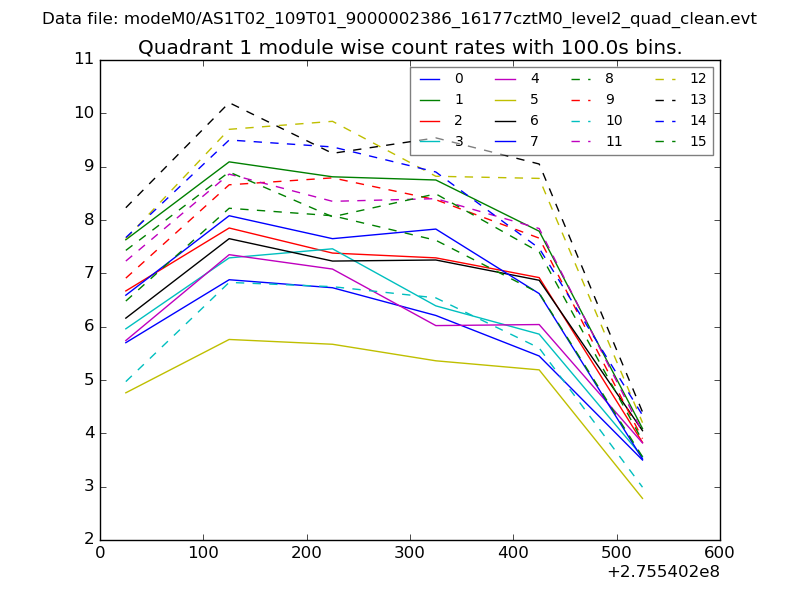
| Module-wise count rates for Quadrant A Data is divided into 100 sec bins |
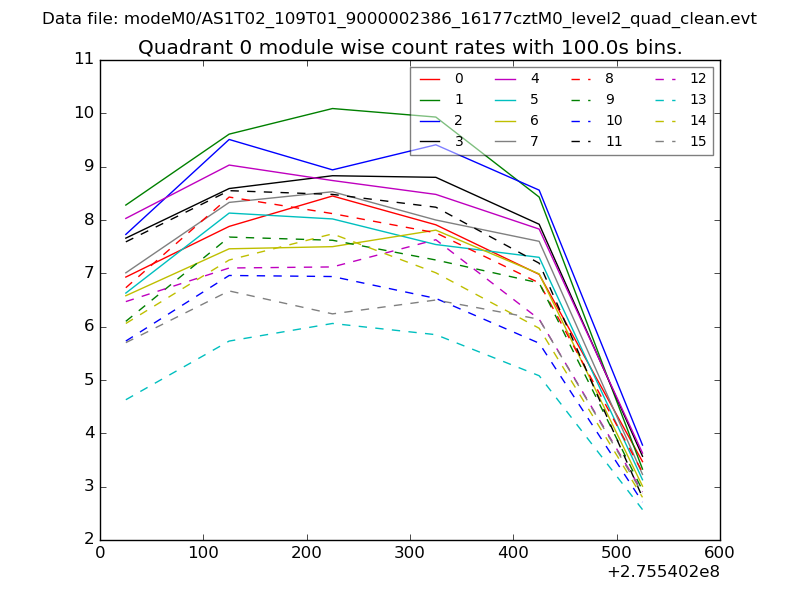 |
 |
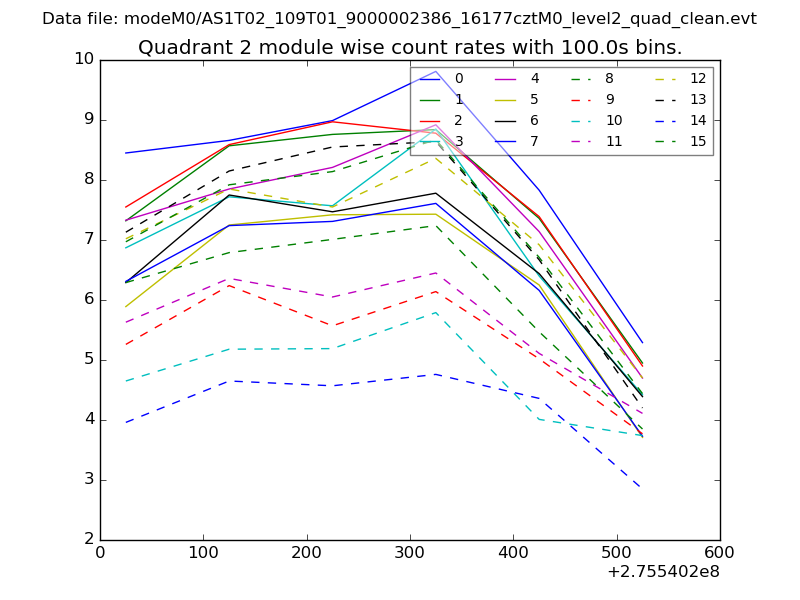
| Module-wise count rates for Quadrant B Data is divided into 100 sec bins |
 |
 |
| Module-wise count rates for Quadrant C Data is divided into 100 sec bins |
 |
 |
| Module-wise count rates for Quadrant D Data is divided into 100 sec bins |
 |
 |
| Parameter | Plot |
|---|---|
| CZT HV Monitor | 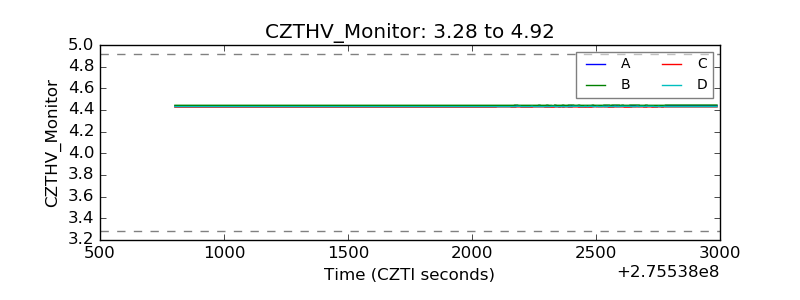 |
| D_VDD | 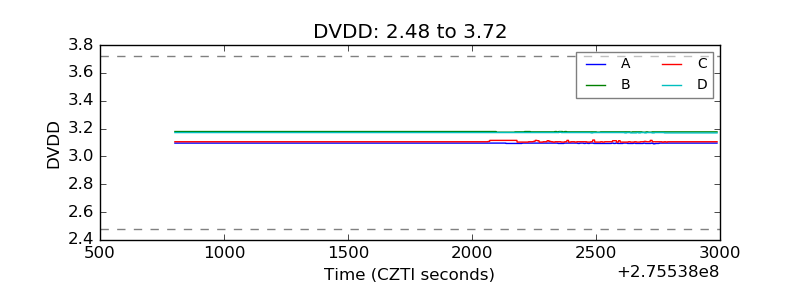 |
| Temperature 1 | 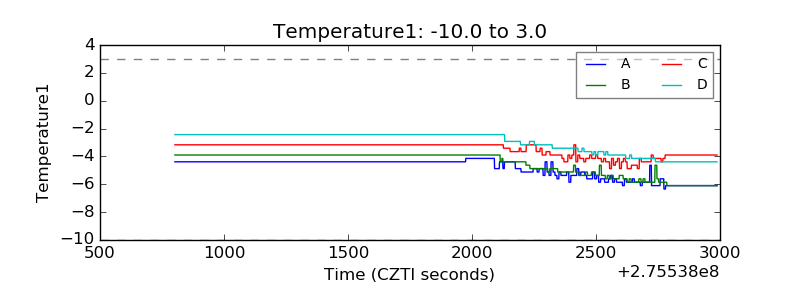 |
| Veto HV Monitor | 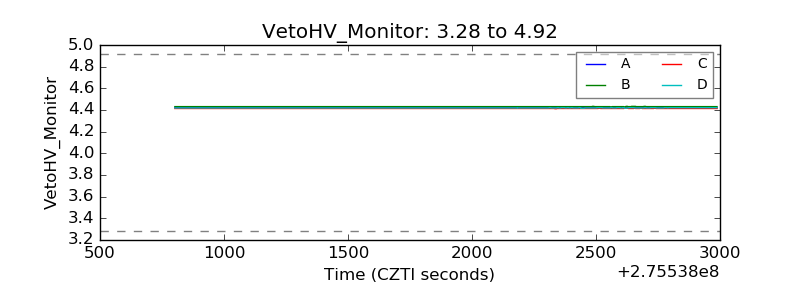 |
| Veto LLD | 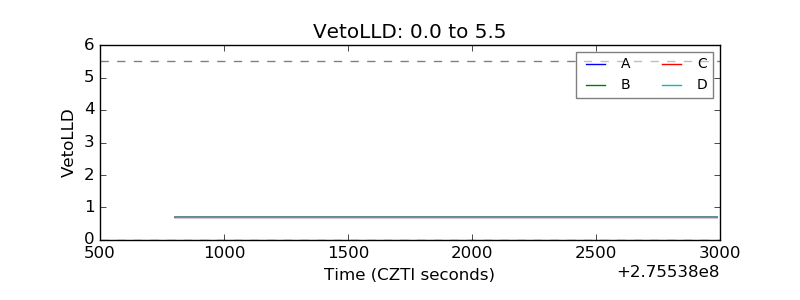 |
| Alpha Counter | 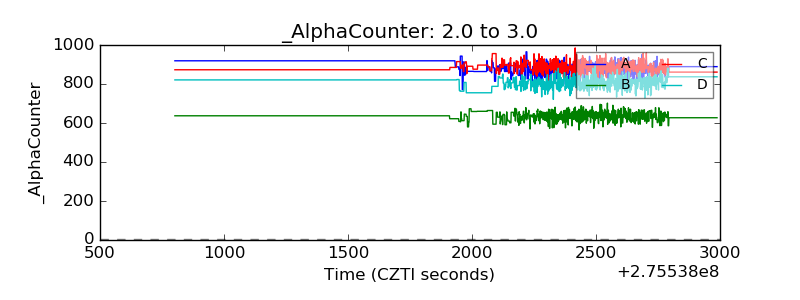 |
| _CPM_Rate | 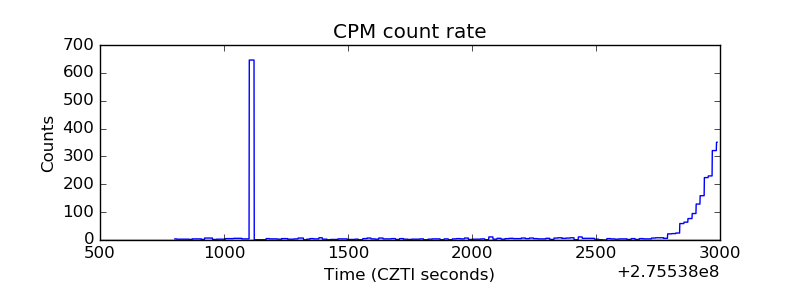 |
| CZT Counter | 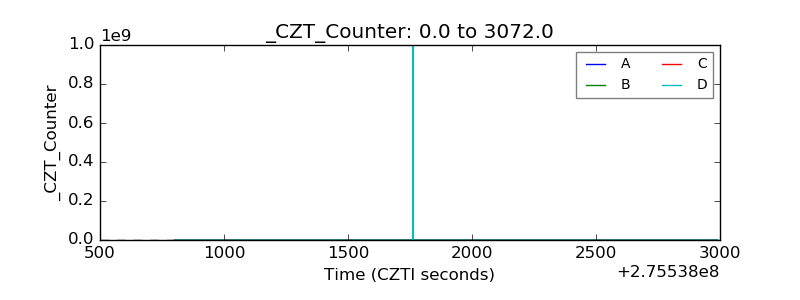 |
| +2.5 Volts monitor |  |
| +5 Volts monitor |  |
| _ROLL_ROT |  |
| _Roll_DEC | 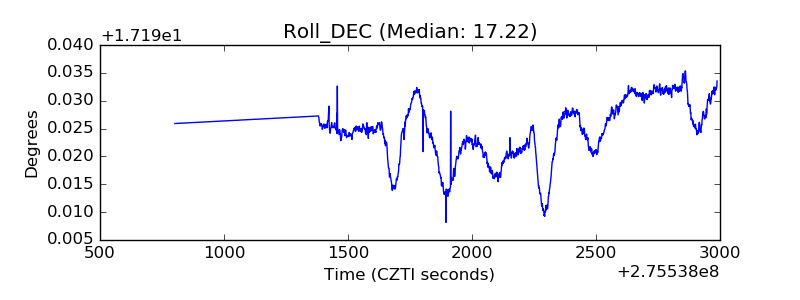 |
| _Roll_RA | 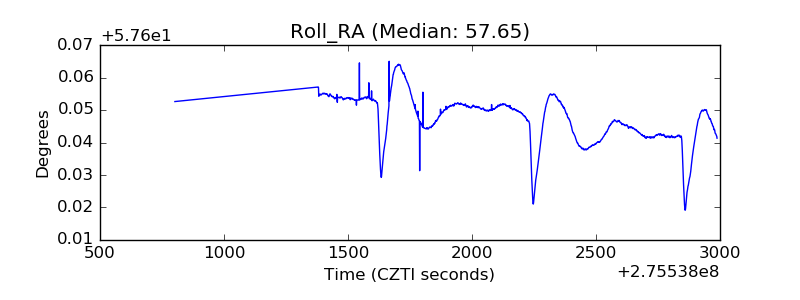 |
| Veto Counter |  |