| Param | Original file | Final file |
|---|---|---|
| Filename | modeM0/AS1T02_109T01_9000002386_16179cztM0_level2.evt | modeM0/AS1T02_109T01_9000002386_16179cztM0_level2_quad_clean.evt |
| Size (bytes) | 510,652,800 | 91,264,320 |
| Size | 487.0 MB | 87.0 MB |
| Events in quadrant A | 3,260,467 | 588,294 |
| Events in quadrant B | 3,228,796 | 599,211 |
| Events in quadrant C | 3,347,993 | 568,085 |
| Events in quadrant D | 5,183,231 | 551,627 |
| Mode M0 | |||
|---|---|---|---|
| Quadrant | BADHDUFLAG | Total packets | Discarded packets |
| A | 0 | 13979 | 156 |
| B | 0 | 13776 | 158 |
| C | 0 | 14162 | 152 |
| D | 0 | 20020 | 160 |
| Mode SS | |||
|---|---|---|---|
| Quadrant | BADHDUFLAG | Total packets | Discarded packets |
| A | 0 | 134 | 2 |
| B | 0 | 134 | 0 |
| C | 0 | 134 | 0 |
| D | 0 | 134 | 0 |
| Mode M9 | |||
|---|---|---|---|
| Quadrant | BADHDUFLAG | Total packets | Discarded packets |
| A | 0 | 12 | 0 |
| B | 0 | 12 | 0 |
| C | 0 | 12 | 0 |
| D | 0 | 13 | 0 |
| Quadrant | Total seconds | Saturated seconds | Saturation percentage |
|---|---|---|---|
| A | 6544 | 90 | 1.375306% |
| B | 6543 | 75 | 1.146263% |
| C | 6553 | 66 | 1.007172% |
| D | 6543 | 518 | 7.916858% |
Noise dominated data is calculated using 1-second bins in cleaned event files. If a bin has >2000 counts, and if more than 50% of those come from <1% of pixels, then it is considered to be noise-dominated and hence unusable.
| Quadrant | # 1 sec bins | Bins with >0 counts | Bins with >2000 counts | High rate bins dominated by noise | Noise dominated (total time) | Noise dominated (detector-on time) | Marked lightcurve |
|---|---|---|---|---|---|---|---|
| A | 7705 | 6608 | 26 | 26 | 0.34% | 0.39% | 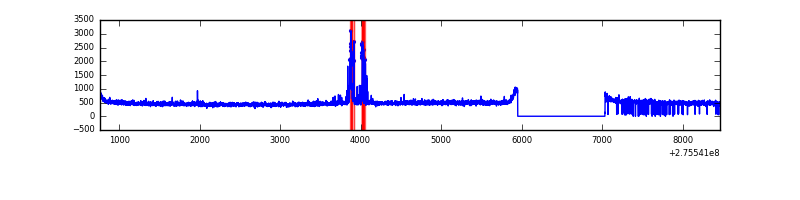 |
| B | 7705 | 6612 | 4 | 4 | 0.05% | 0.06% | 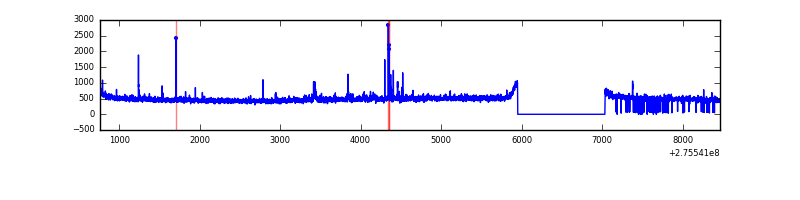 |
| C | 7705 | 6615 | 0 | 0 | 0.00% | 0.00% | 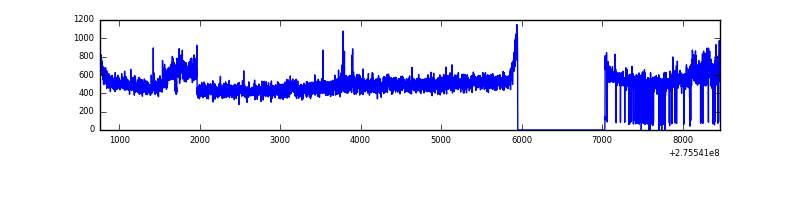 |
| D | 7705 | 6613 | 435 | 435 | 5.65% | 6.58% | 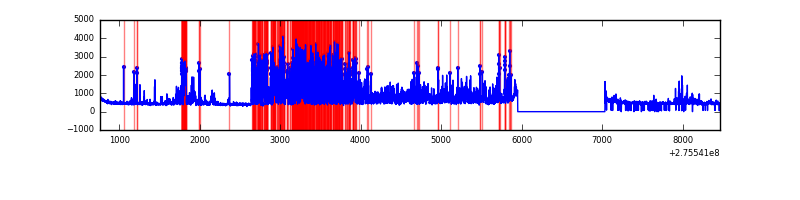 |
Top three noisy pixels from each quadrant. If the there are fewer than three noisy pixels in the level2.evt file, extra rows are filled as -1
| Pixel properties | Quadrant properties | ||||||
|---|---|---|---|---|---|---|---|
| Quadrant | DetID | PixID | Counts | Sigma | Mean | Median | Sigma |
| A | 15 | 174 | 143676 | 876.12 | 805 | 790 | 163.1 |
| A | 8 | 247 | 18696 | 109.79 | 805 | 790 | 163.1 |
| A | 0 | 226 | 7099 | 38.68 | 805 | 790 | 163.1 |
| B | 0 | 229 | 23775 | 147.92 | 803 | 781 | 155.4 |
| B | 0 | 182 | 17843 | 109.76 | 803 | 781 | 155.4 |
| B | 12 | 111 | 17749 | 109.16 | 803 | 781 | 155.4 |
| C | 7 | 247 | 152002 | 845.37 | 764 | 769 | 178.9 |
| C | 14 | 238 | 119410 | 663.18 | 764 | 769 | 178.9 |
| C | 3 | 233 | 88717 | 491.62 | 764 | 769 | 178.9 |
| D | 5 | 222 | 1916067 | 10217.1 | 760 | 738 | 187.5 |
| D | 10 | 70 | 177291 | 941.8 | 760 | 738 | 187.5 |
| D | 2 | 33 | 94955 | 502.59 | 760 | 738 | 187.5 |
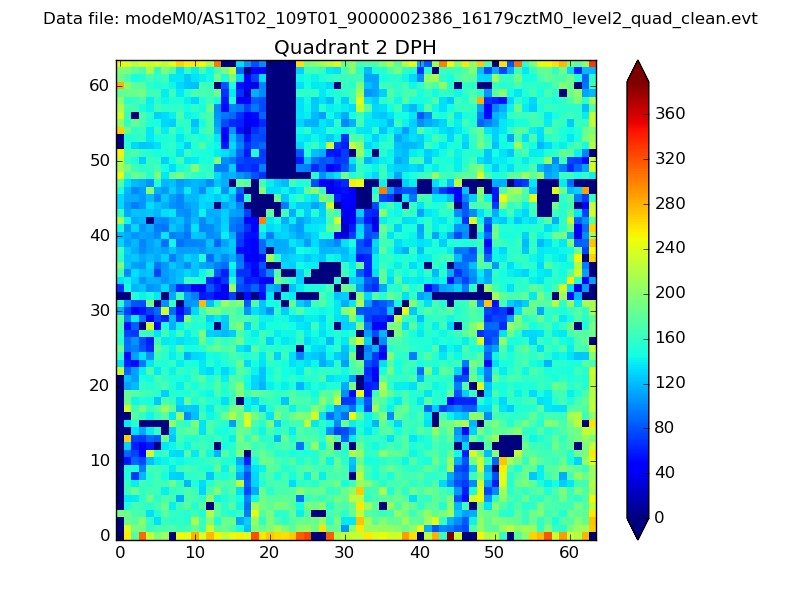
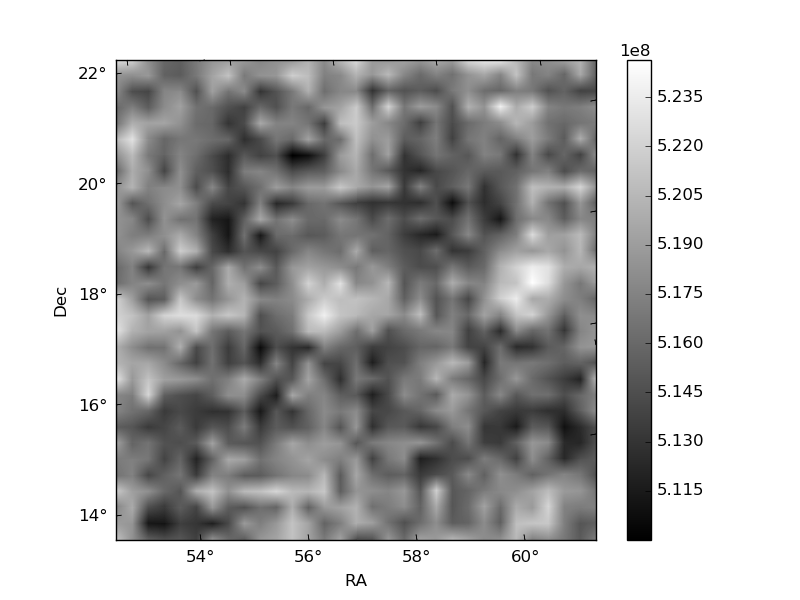
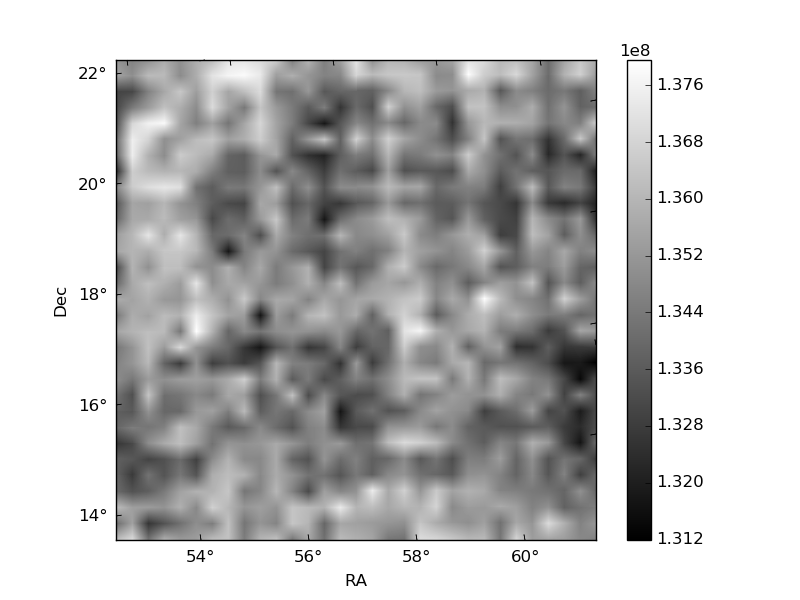
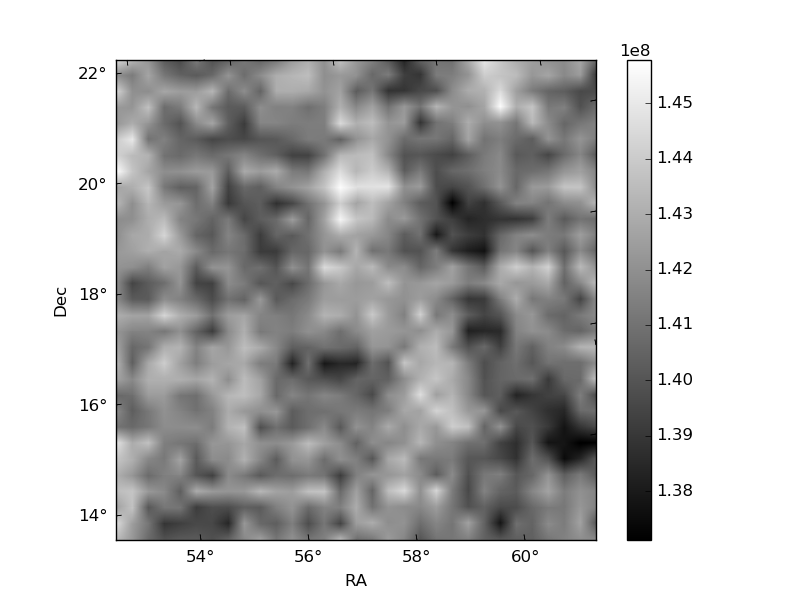
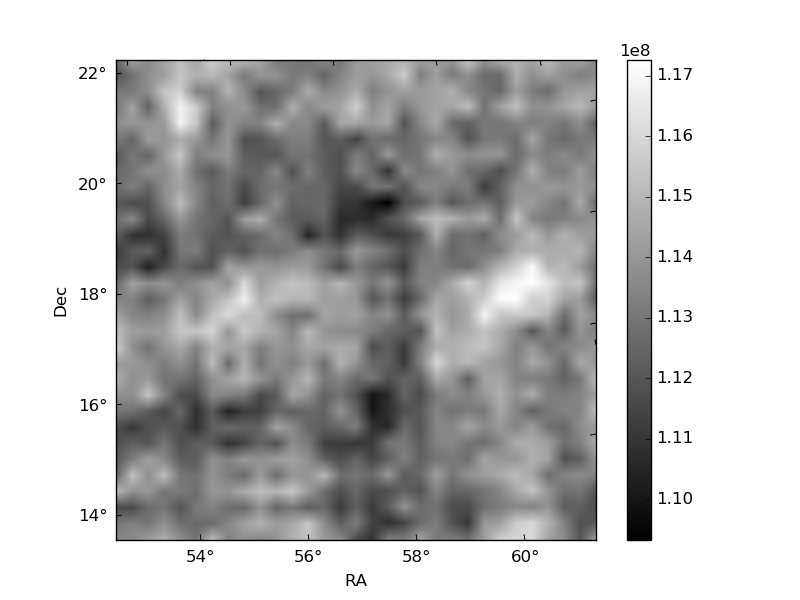
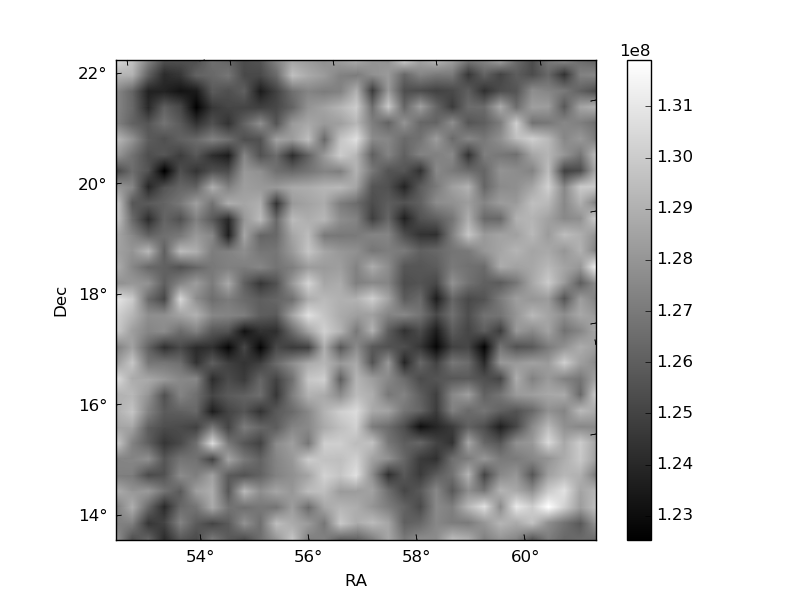
Histogram calculated using DETX and DETY for each event in the final _common_clean file
| Quadrant A | 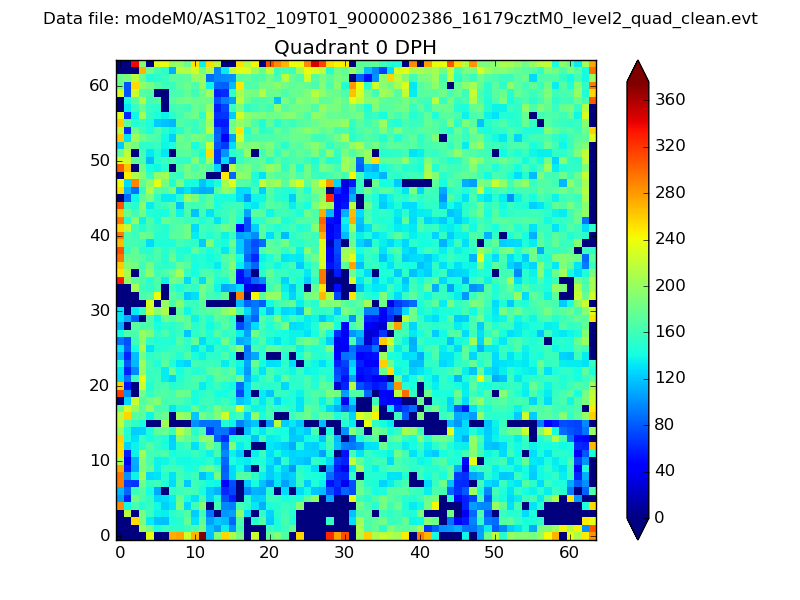 |
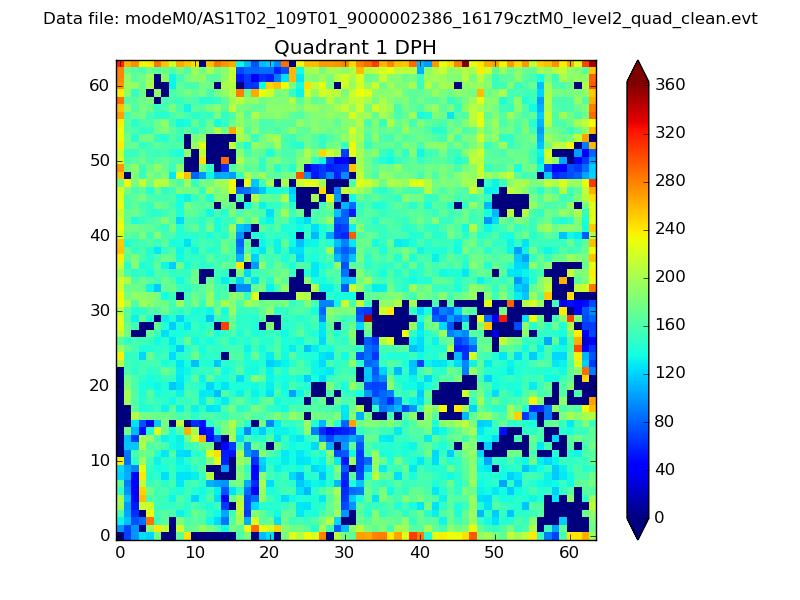 |
Quadrant B |
|---|---|---|---|
| Quadrant D | 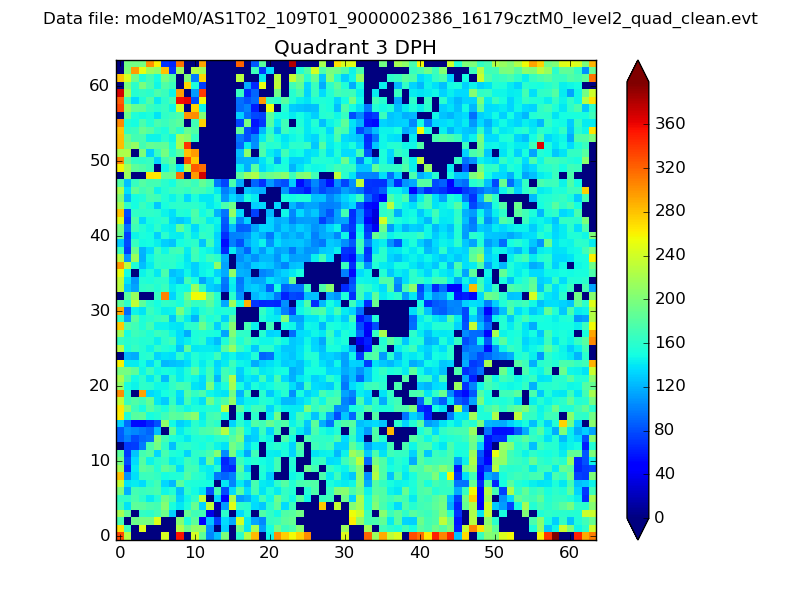 |
 |
Quadrant C |
| Plot type | Count rate plots | Images |
|---|---|---|
| Comparison with Poisson distribution Blue bars denote a histogram of data divided into 1 sec bins. Red curve is a Poisson curve with rate = median count rate of data. |
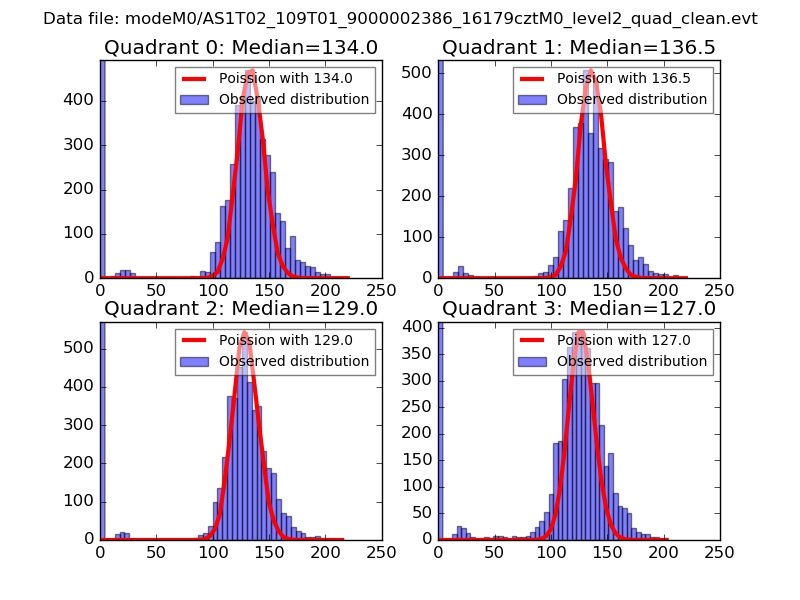 |
 |
| Quadrant-wise count rates Data is divided into 100 sec bins |
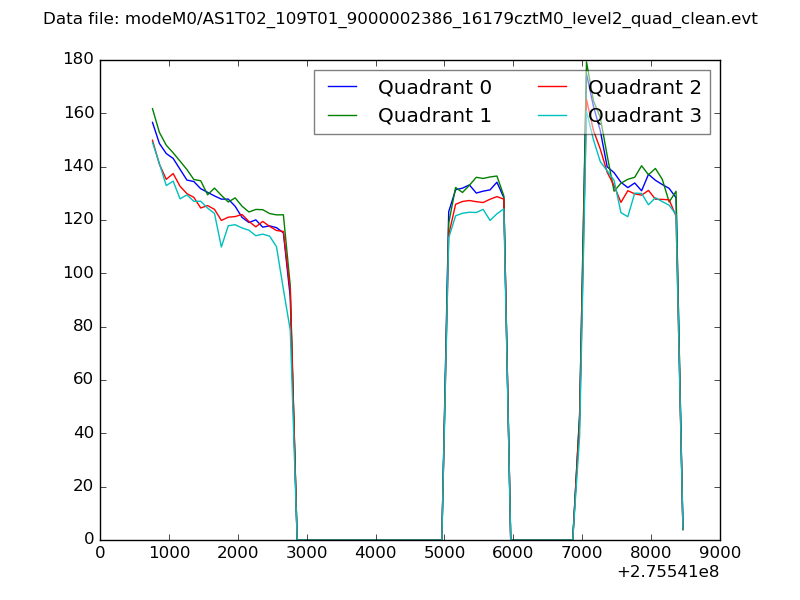 |
|
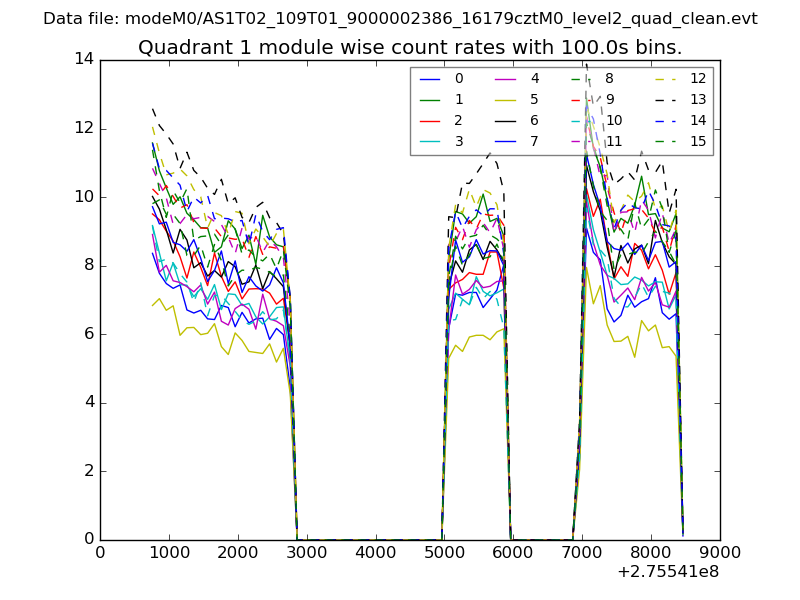
| Module-wise count rates for Quadrant A Data is divided into 100 sec bins |
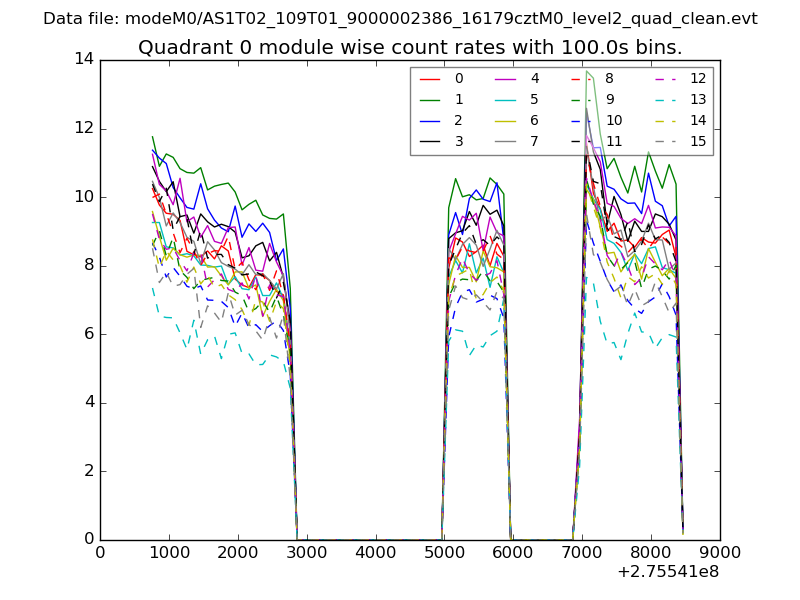 |
 |
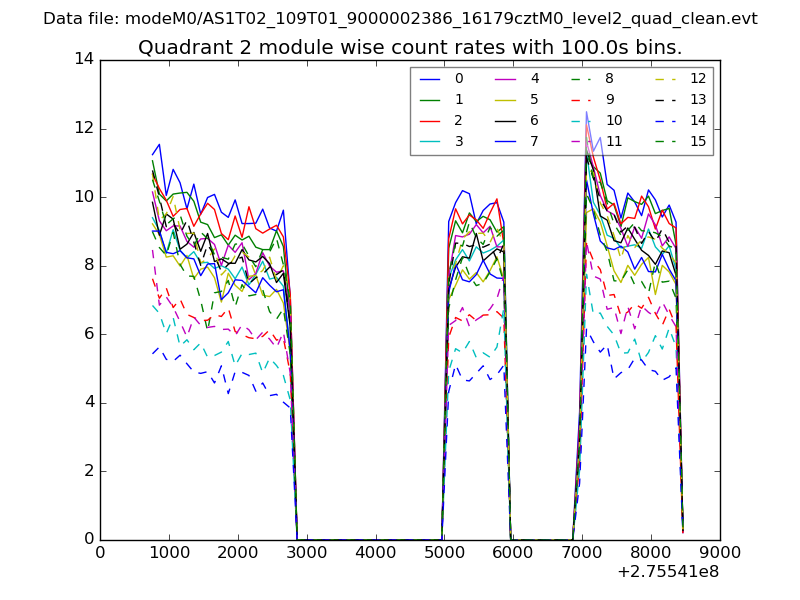
| Module-wise count rates for Quadrant B Data is divided into 100 sec bins |
 |
 |
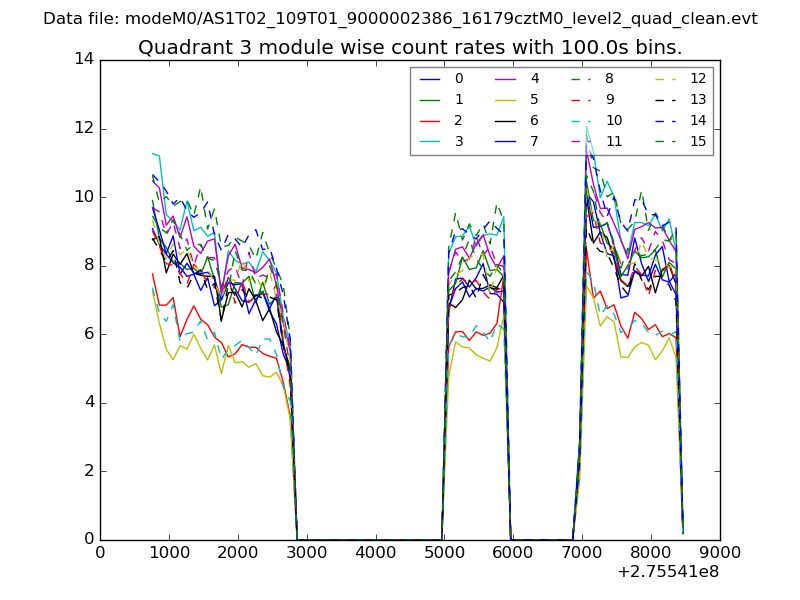
| Module-wise count rates for Quadrant C Data is divided into 100 sec bins |
 |
 |
| Module-wise count rates for Quadrant D Data is divided into 100 sec bins |
 |
 |
| Parameter | Plot |
|---|---|
| CZT HV Monitor | 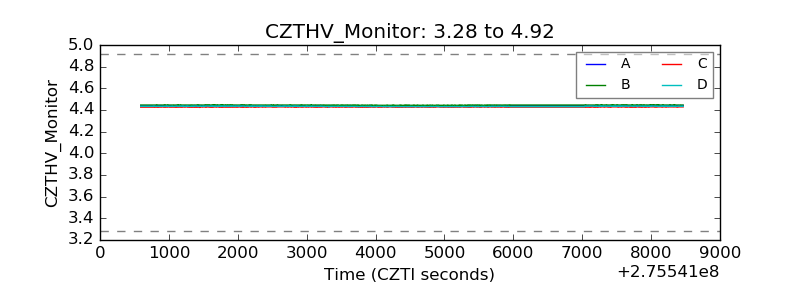 |
| D_VDD | 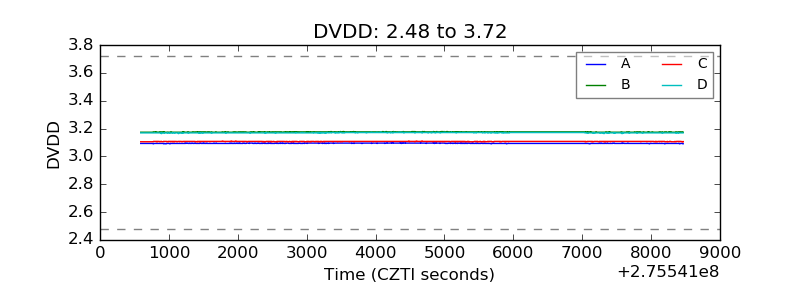 |
| Temperature 1 | 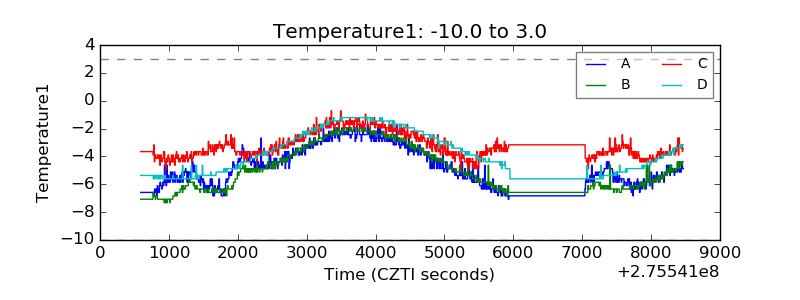 |
| Veto HV Monitor | 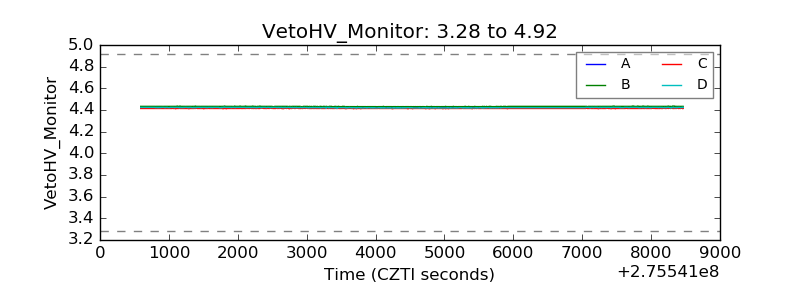 |
| Veto LLD | 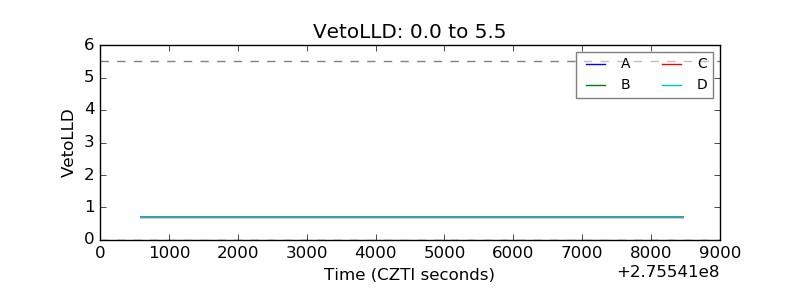 |
| Alpha Counter | 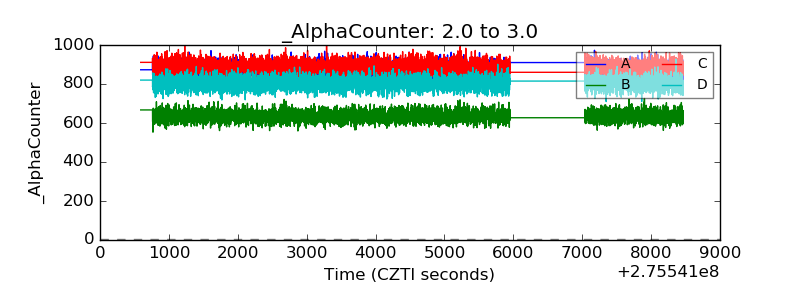 |
| _CPM_Rate | 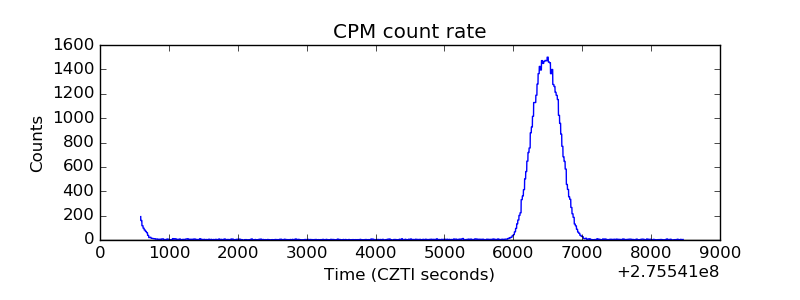 |
| CZT Counter | 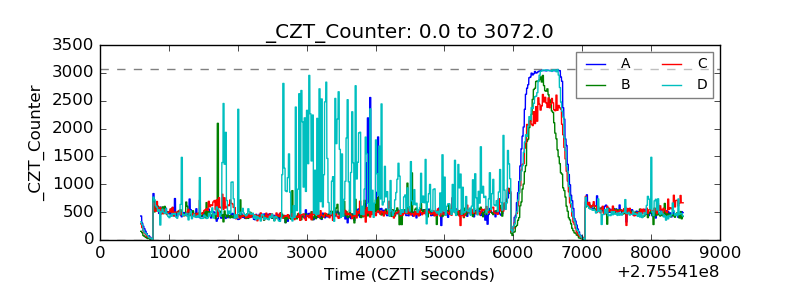 |
| +2.5 Volts monitor |  |
| +5 Volts monitor |  |
| _ROLL_ROT | 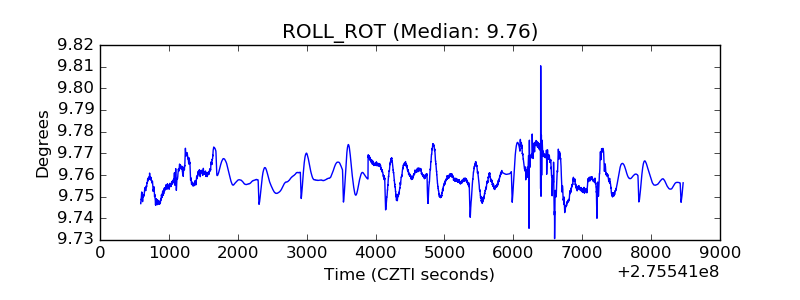 |
| _Roll_DEC | 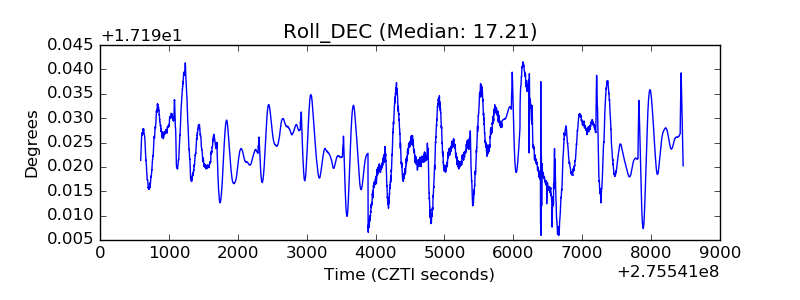 |
| _Roll_RA | 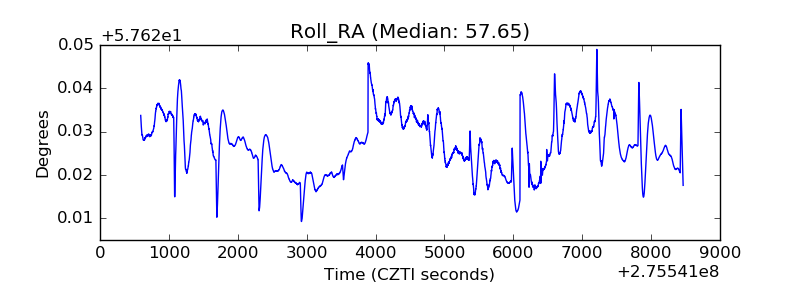 |
| Veto Counter | 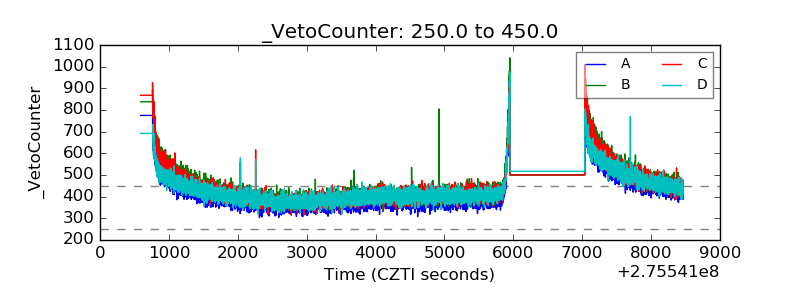 |