| Param | Original file | Final file |
|---|---|---|
| Filename | modeM0/AS1T02_109T01_9000002386_16180cztM0_level2.evt | modeM0/AS1T02_109T01_9000002386_16180cztM0_level2_quad_clean.evt |
| Size (bytes) | 1,744,358,400 | 327,335,040 |
| Size | 1.6 GB | 312.2 MB |
| Events in quadrant A | 12,824,895 | 2,061,060 |
| Events in quadrant B | 12,570,787 | 2,110,485 |
| Events in quadrant C | 12,412,360 | 2,016,885 |
| Events in quadrant D | 13,298,548 | 1,973,690 |
| Mode M0 | |||
|---|---|---|---|
| Quadrant | BADHDUFLAG | Total packets | Discarded packets |
| A | 0 | 55189 | 6 |
| B | 0 | 54067 | 5 |
| C | 0 | 53488 | 5 |
| D | 0 | 57476 | 6 |
| Mode SS | |||
|---|---|---|---|
| Quadrant | BADHDUFLAG | Total packets | Discarded packets |
| A | 0 | 520 | 0 |
| B | 0 | 520 | 0 |
| C | 0 | 520 | 0 |
| D | 0 | 520 | 0 |
| Mode M9 | |||
|---|---|---|---|
| Quadrant | BADHDUFLAG | Total packets | Discarded packets |
| A | 0 | 37 | 0 |
| B | 0 | 37 | 0 |
| C | 0 | 37 | 0 |
| D | 0 | 37 | 0 |
| Quadrant | Total seconds | Saturated seconds | Saturation percentage |
|---|---|---|---|
| A | 25469 | 374 | 1.468452% |
| B | 25469 | 233 | 0.914838% |
| C | 25469 | 231 | 0.906985% |
| D | 25468 | 490 | 1.923983% |
Noise dominated data is calculated using 1-second bins in cleaned event files. If a bin has >2000 counts, and if more than 50% of those come from <1% of pixels, then it is considered to be noise-dominated and hence unusable.
| Quadrant | # 1 sec bins | Bins with >0 counts | Bins with >2000 counts | High rate bins dominated by noise | Noise dominated (total time) | Noise dominated (detector-on time) | Marked lightcurve |
|---|---|---|---|---|---|---|---|
| A | 38465 | 25475 | 136 | 136 | 0.35% | 0.53% | 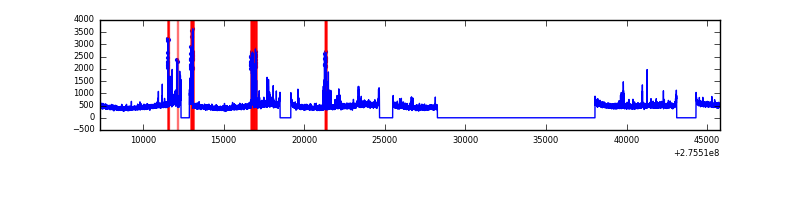 |
| B | 38465 | 25475 | 38 | 38 | 0.10% | 0.15% | 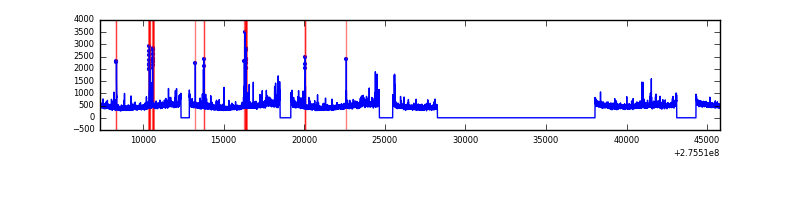 |
| C | 38465 | 25475 | 0 | 0 | 0.00% | 0.00% | 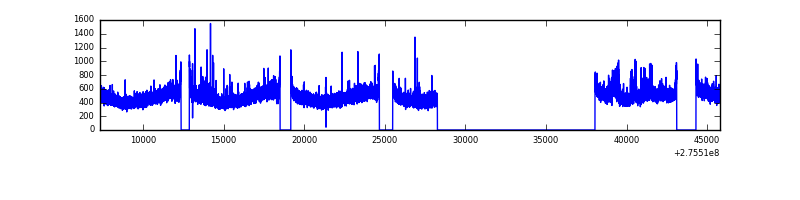 |
| D | 38465 | 25474 | 352 | 352 | 0.92% | 1.38% | 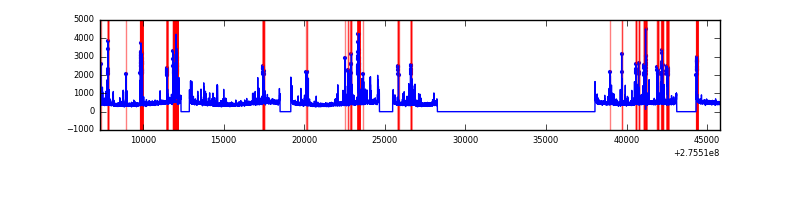 |
Top three noisy pixels from each quadrant. If the there are fewer than three noisy pixels in the level2.evt file, extra rows are filled as -1
| Pixel properties | Quadrant properties | ||||||
|---|---|---|---|---|---|---|---|
| Quadrant | DetID | PixID | Counts | Sigma | Mean | Median | Sigma |
| A | 15 | 174 | 770779 | 1264.66 | 3040 | 2977 | 607.1 |
| A | 15 | 239 | 160368 | 259.24 | 3040 | 2977 | 607.1 |
| A | 8 | 247 | 103036 | 164.81 | 3040 | 2977 | 607.1 |
| B | 0 | 229 | 173104 | 294.6 | 3047 | 2969 | 577.5 |
| B | 15 | 201 | 156144 | 265.23 | 3047 | 2969 | 577.5 |
| B | 4 | 216 | 92165 | 154.45 | 3047 | 2969 | 577.5 |
| C | 14 | 238 | 455712 | 667.99 | 2907 | 2924 | 677.8 |
| C | 7 | 247 | 418349 | 612.87 | 2907 | 2924 | 677.8 |
| C | 3 | 233 | 159824 | 231.47 | 2907 | 2924 | 677.8 |
| D | 2 | 33 | 905432 | 1261.57 | 2937 | 2847 | 715.4 |
| D | 7 | 38 | 518323 | 720.5 | 2937 | 2847 | 715.4 |
| D | 1 | 52 | 398296 | 552.73 | 2937 | 2847 | 715.4 |
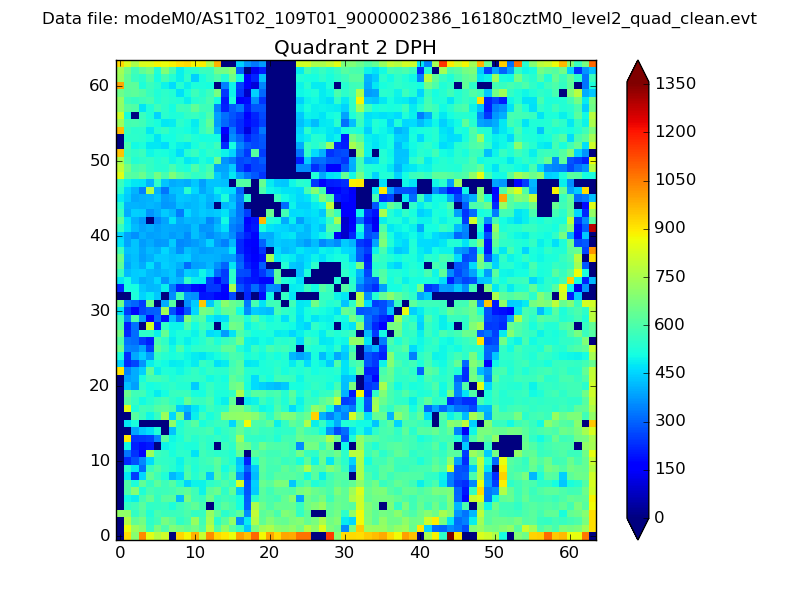
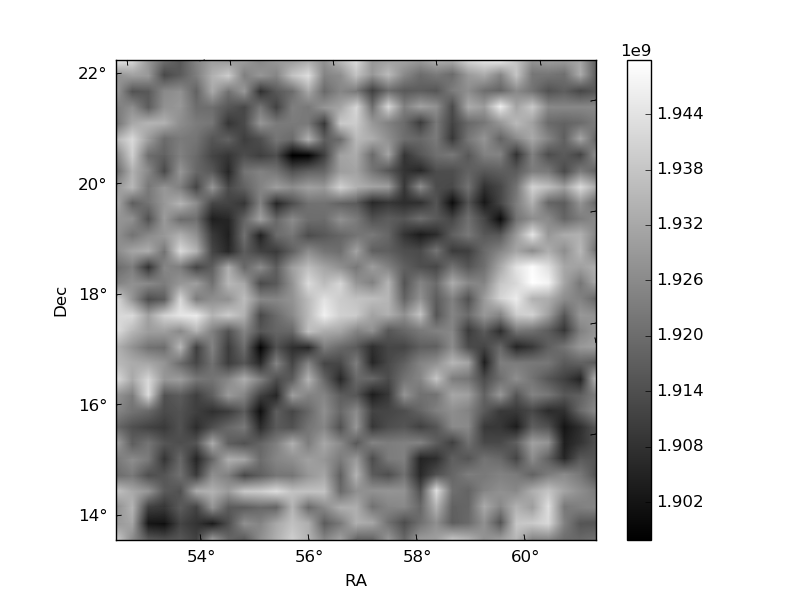
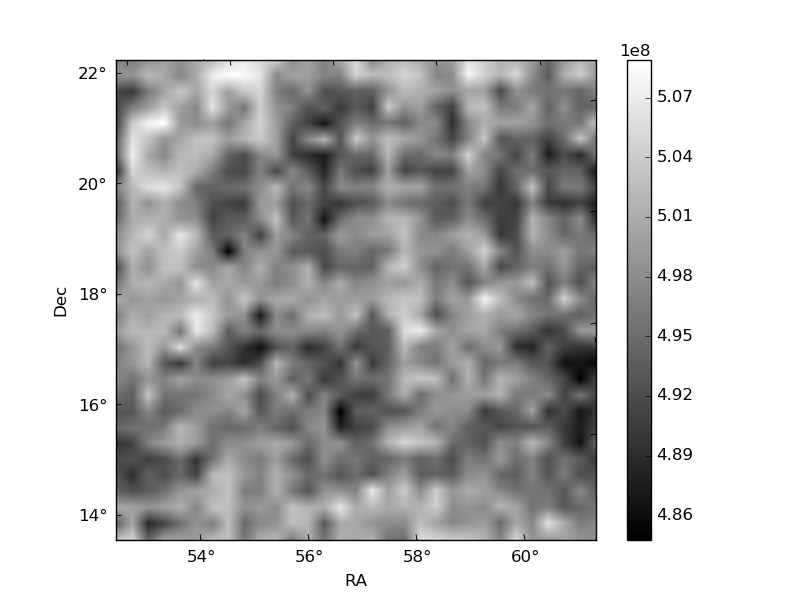
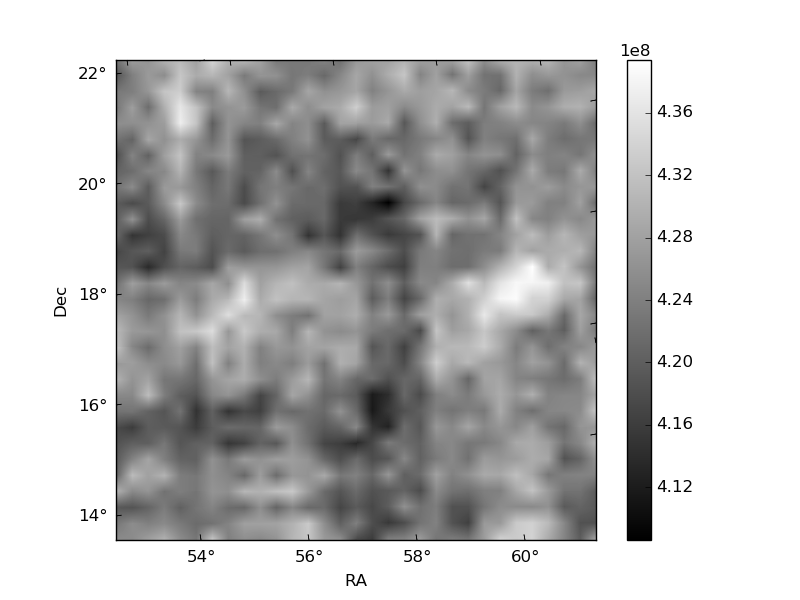
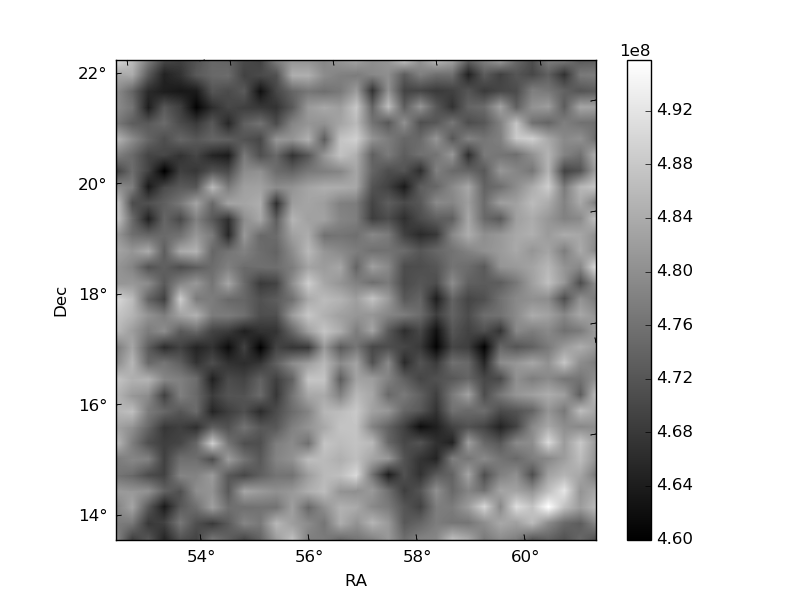
Histogram calculated using DETX and DETY for each event in the final _common_clean file
| Quadrant A | 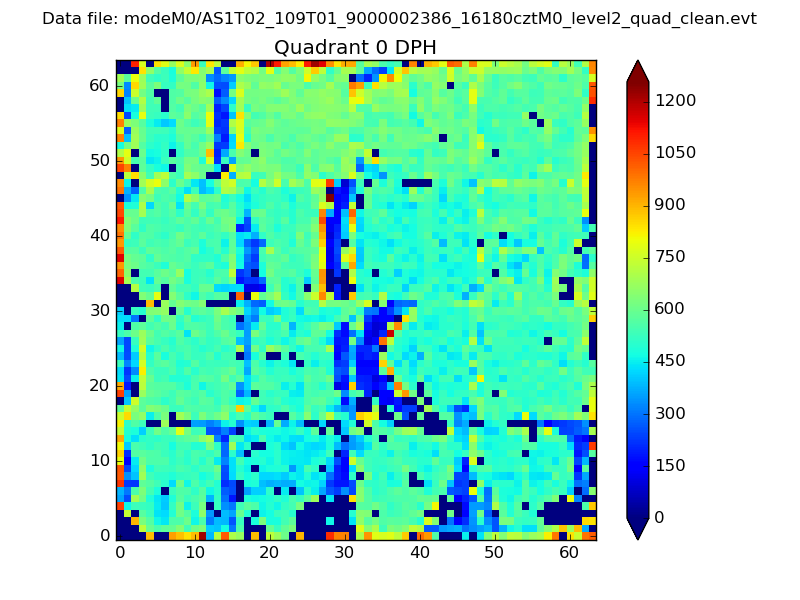 |
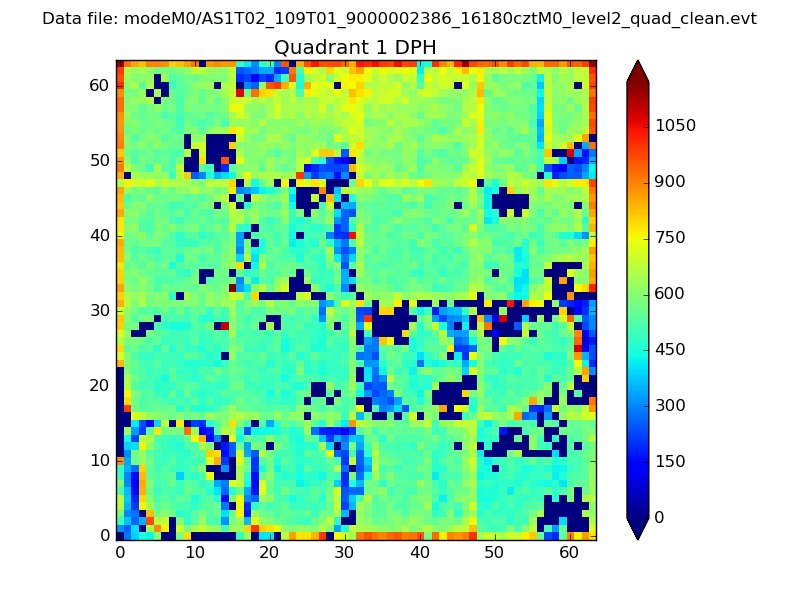 |
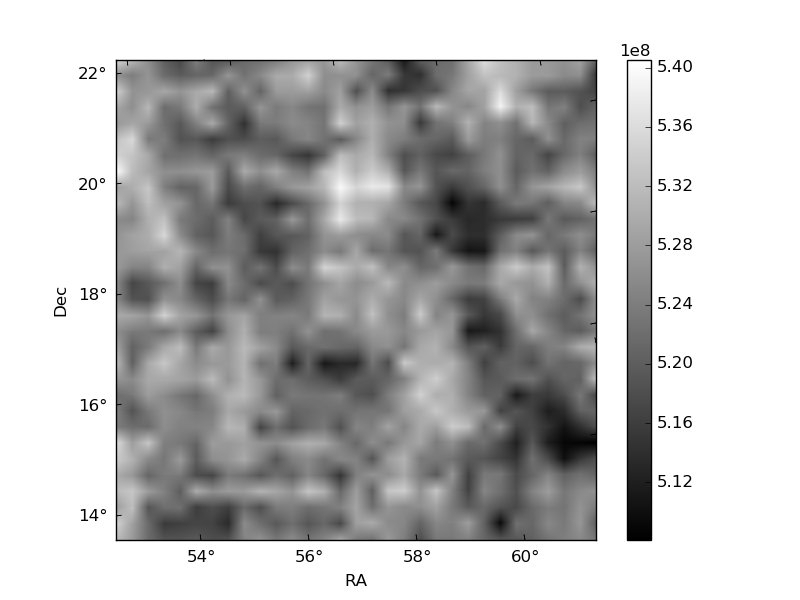
Quadrant B |
|---|---|---|---|
| Quadrant D | 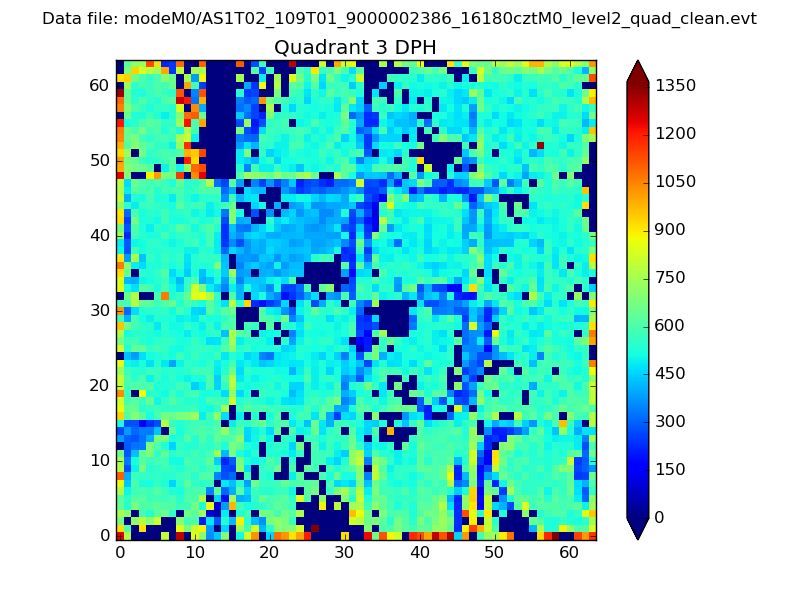 |
 |
Quadrant C |
| Plot type | Count rate plots | Images |
|---|---|---|
| Comparison with Poisson distribution Blue bars denote a histogram of data divided into 1 sec bins. Red curve is a Poisson curve with rate = median count rate of data. |
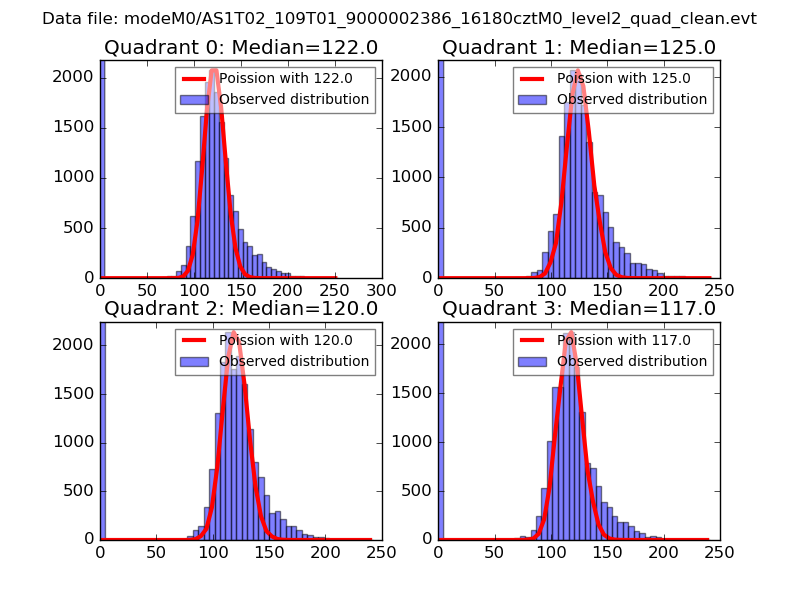 |
 |
| Quadrant-wise count rates Data is divided into 100 sec bins |
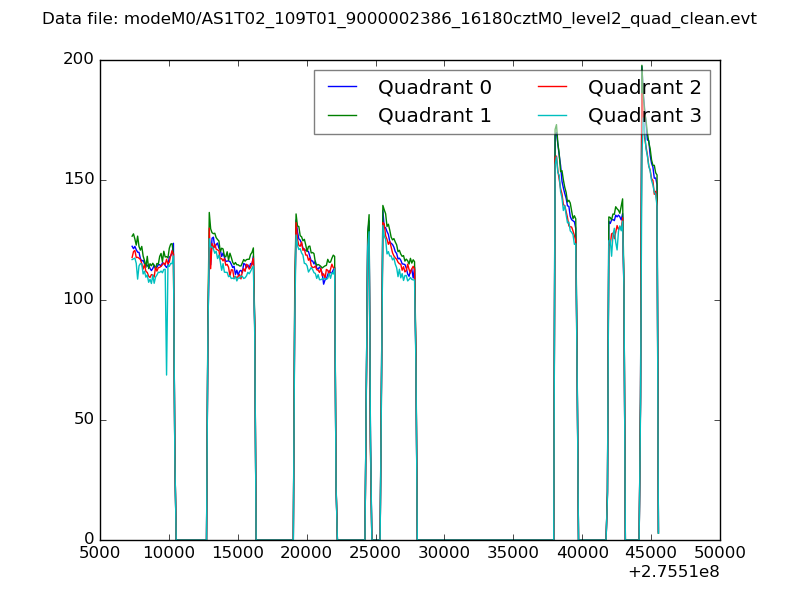 |
|
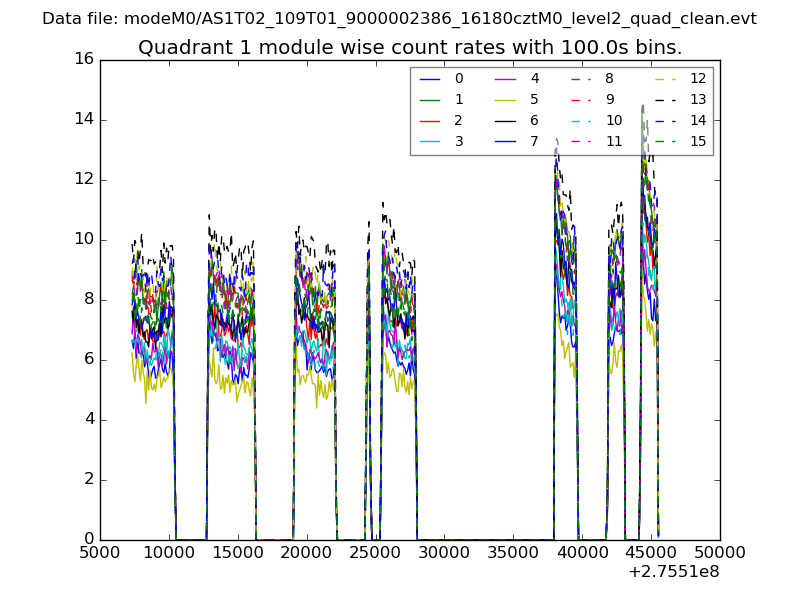
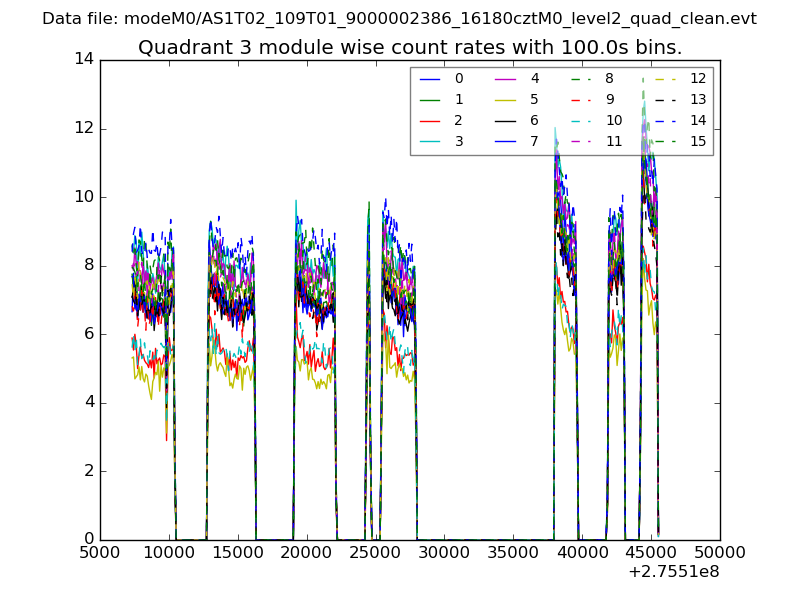
| Module-wise count rates for Quadrant A Data is divided into 100 sec bins |
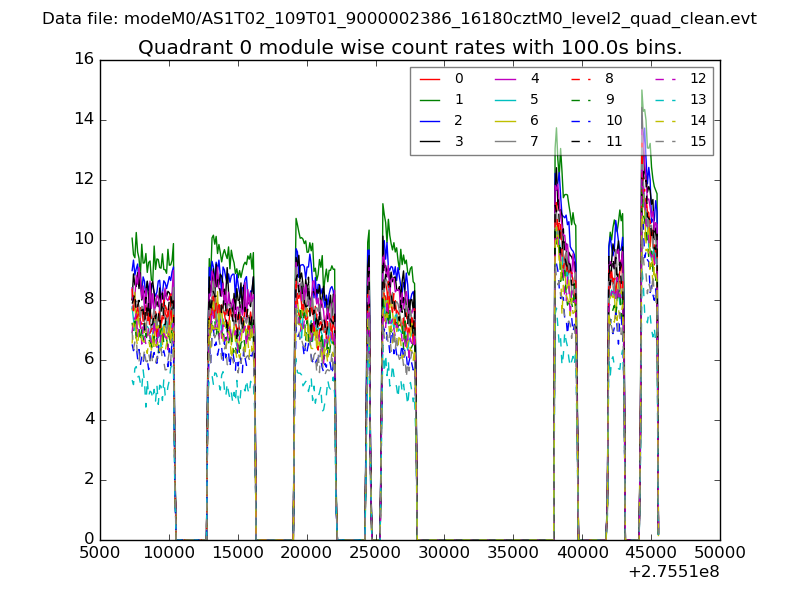 |
 |
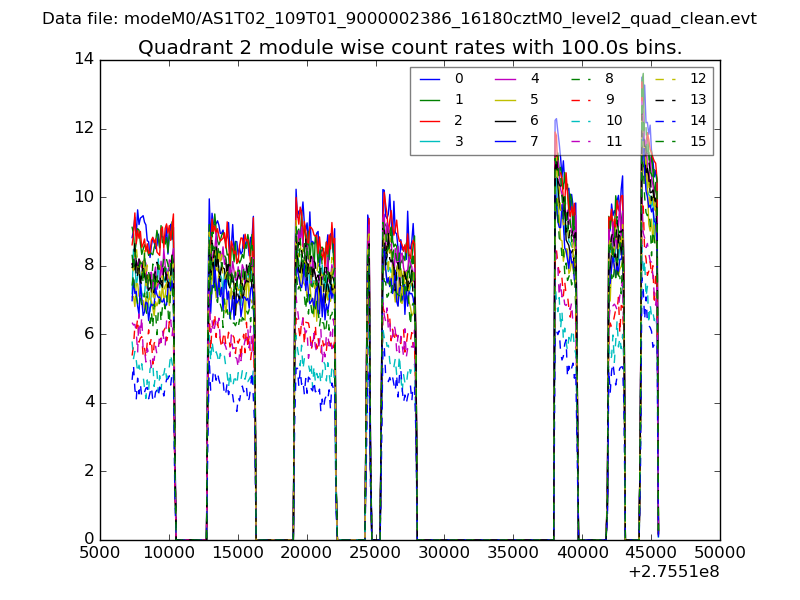
| Module-wise count rates for Quadrant B Data is divided into 100 sec bins |
 |
 |
| Module-wise count rates for Quadrant C Data is divided into 100 sec bins |
 |
 |
| Module-wise count rates for Quadrant D Data is divided into 100 sec bins |
 |
 |
| Parameter | Plot |
|---|---|
| CZT HV Monitor | 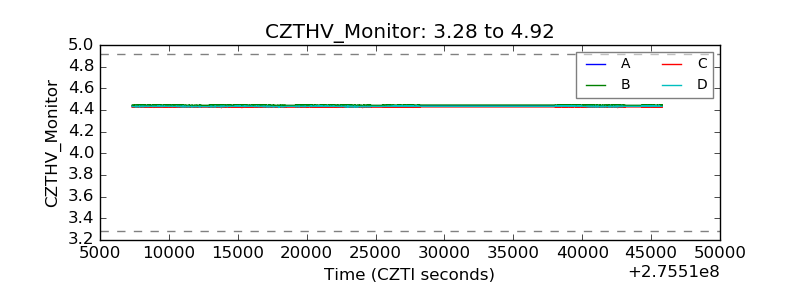 |
| D_VDD | 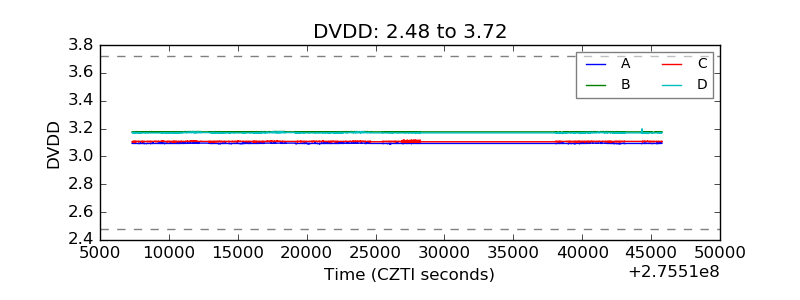 |
| Temperature 1 | 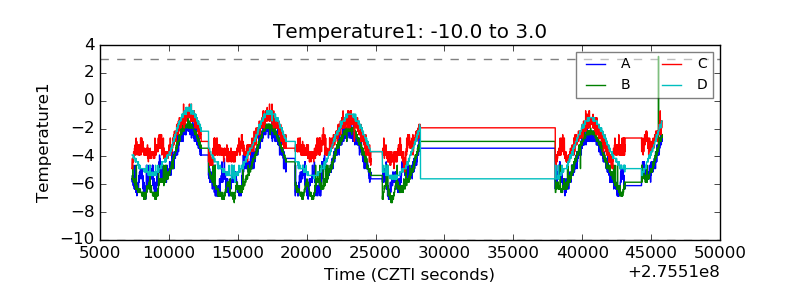 |
| Veto HV Monitor | 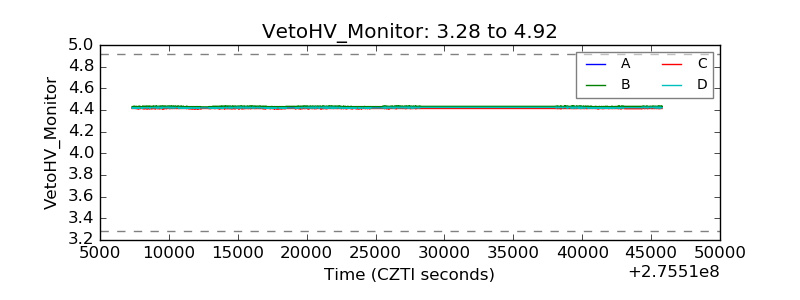 |
| Veto LLD | 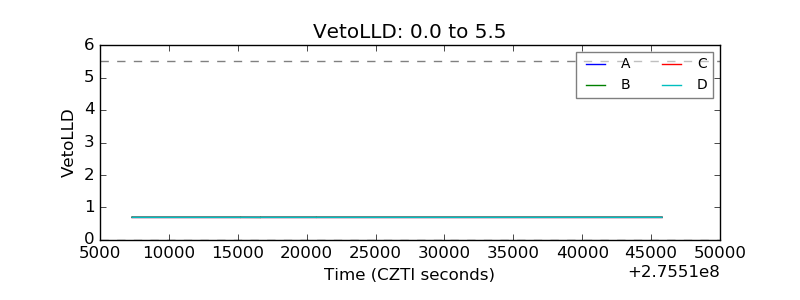 |
| Alpha Counter | 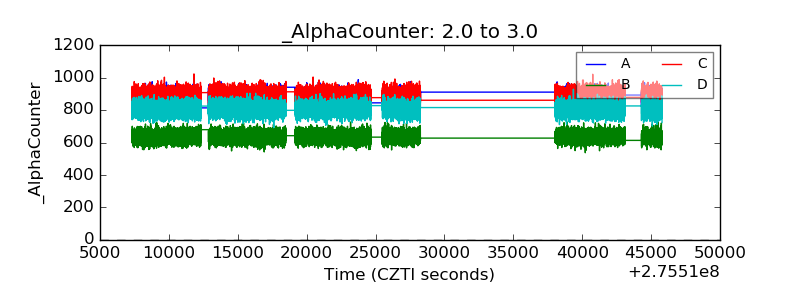 |
| _CPM_Rate | 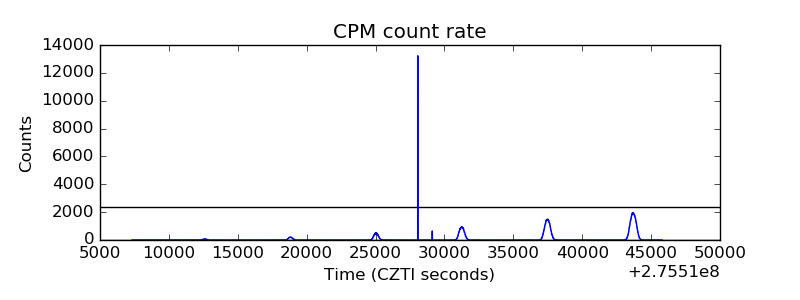 |
| CZT Counter | 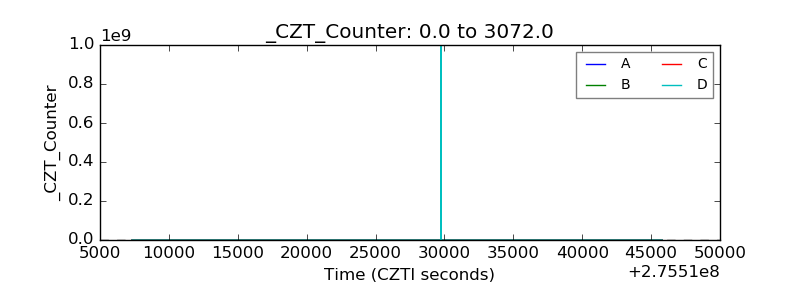 |
| +2.5 Volts monitor |  |
| +5 Volts monitor | 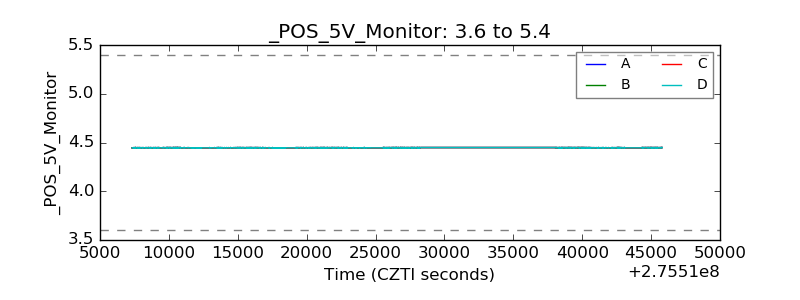 |
| _ROLL_ROT | 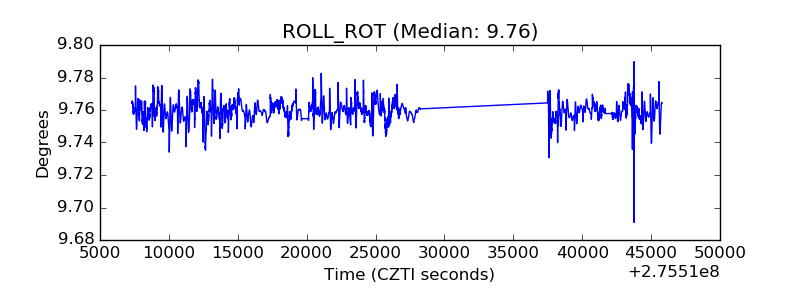 |
| _Roll_DEC | 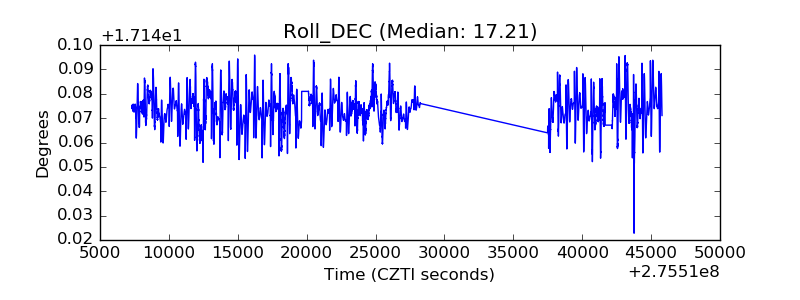 |
| _Roll_RA | 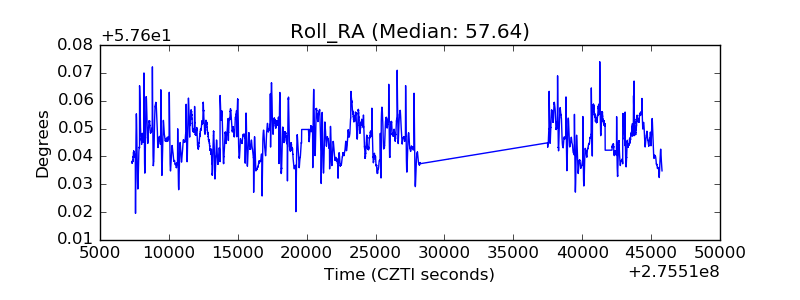 |
| Veto Counter | 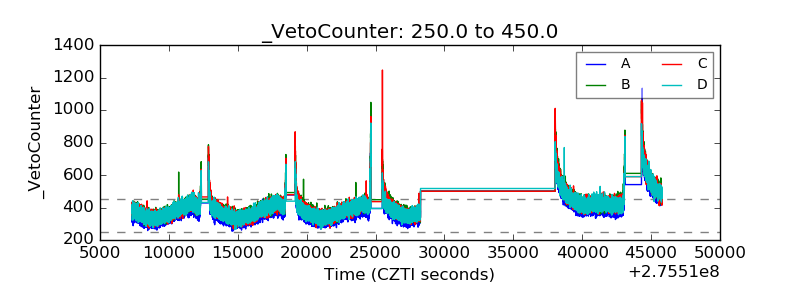 |