| Param | Original file | Final file |
|---|---|---|
| Filename | modeM0/AS1T02_109T01_9000002386_16181cztM0_level2.evt | modeM0/AS1T02_109T01_9000002386_16181cztM0_level2_quad_clean.evt |
| Size (bytes) | 1,622,612,160 | 273,870,720 |
| Size | 1.5 GB | 261.2 MB |
| Events in quadrant A | 11,709,051 | 1,724,058 |
| Events in quadrant B | 10,990,227 | 1,761,827 |
| Events in quadrant C | 11,270,938 | 1,667,844 |
| Events in quadrant D | 13,692,602 | 1,634,030 |
| Mode M0 | |||
|---|---|---|---|
| Quadrant | BADHDUFLAG | Total packets | Discarded packets |
| A | 0 | 48677 | 6 |
| B | 0 | 45941 | 5 |
| C | 0 | 47107 | 5 |
| D | 0 | 55098 | 5 |
| Mode SS | |||
|---|---|---|---|
| Quadrant | BADHDUFLAG | Total packets | Discarded packets |
| A | 0 | 448 | 0 |
| B | 0 | 448 | 0 |
| C | 0 | 448 | 0 |
| D | 0 | 448 | 0 |
| Mode M9 | |||
|---|---|---|---|
| Quadrant | BADHDUFLAG | Total packets | Discarded packets |
| A | 0 | 45 | 0 |
| B | 0 | 45 | 0 |
| C | 0 | 45 | 0 |
| D | 0 | 46 | 0 |
| Quadrant | Total seconds | Saturated seconds | Saturation percentage |
|---|---|---|---|
| A | 21886 | 431 | 1.969295% |
| B | 21886 | 230 | 1.050900% |
| C | 21886 | 254 | 1.160559% |
| D | 21886 | 856 | 3.911176% |
Noise dominated data is calculated using 1-second bins in cleaned event files. If a bin has >2000 counts, and if more than 50% of those come from <1% of pixels, then it is considered to be noise-dominated and hence unusable.
| Quadrant | # 1 sec bins | Bins with >0 counts | Bins with >2000 counts | High rate bins dominated by noise | Noise dominated (total time) | Noise dominated (detector-on time) | Marked lightcurve |
|---|---|---|---|---|---|---|---|
| A | 26408 | 21891 | 138 | 138 | 0.52% | 0.63% | 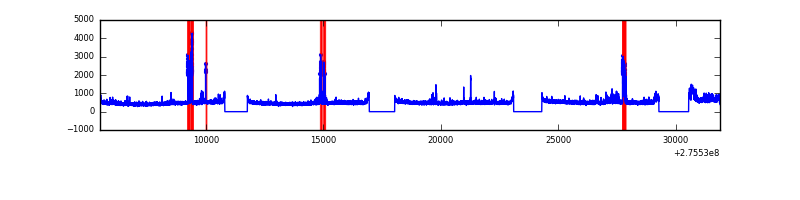 |
| B | 26408 | 21891 | 4 | 4 | 0.02% | 0.02% | 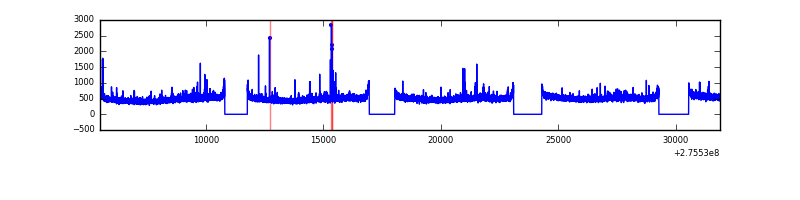 |
| C | 26408 | 21891 | 0 | 0 | 0.00% | 0.00% | 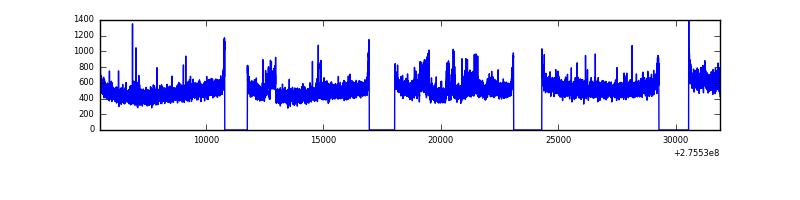 |
| D | 26408 | 21891 | 614 | 614 | 2.33% | 2.80% | 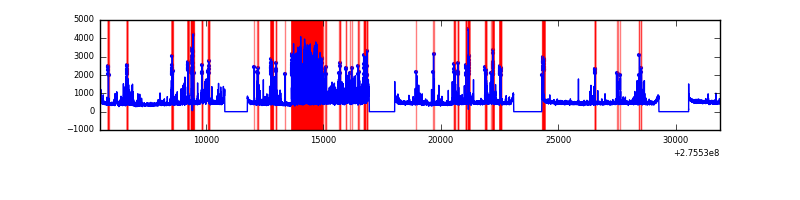 |
Top three noisy pixels from each quadrant. If the there are fewer than three noisy pixels in the level2.evt file, extra rows are filled as -1
| Pixel properties | Quadrant properties | ||||||
|---|---|---|---|---|---|---|---|
| Quadrant | DetID | PixID | Counts | Sigma | Mean | Median | Sigma |
| A | 15 | 174 | 680430 | 1235.51 | 2742 | 2692 | 548.5 |
| A | 8 | 247 | 411791 | 745.78 | 2742 | 2692 | 548.5 |
| A | 15 | 157 | 77646 | 136.64 | 2742 | 2692 | 548.5 |
| B | 0 | 229 | 76723 | 145.05 | 2732 | 2667 | 510.5 |
| B | 12 | 111 | 60404 | 113.09 | 2732 | 2667 | 510.5 |
| B | 11 | 111 | 50943 | 94.56 | 2732 | 2667 | 510.5 |
| C | 7 | 247 | 442016 | 726.03 | 2608 | 2625 | 605.2 |
| C | 14 | 238 | 406478 | 667.31 | 2608 | 2625 | 605.2 |
| C | 3 | 233 | 212905 | 347.46 | 2608 | 2625 | 605.2 |
| D | 5 | 222 | 2018336 | 3126.55 | 2639 | 2559 | 644.7 |
| D | 2 | 33 | 1109644 | 1717.13 | 2639 | 2559 | 644.7 |
| D | 10 | 70 | 266147 | 408.83 | 2639 | 2559 | 644.7 |
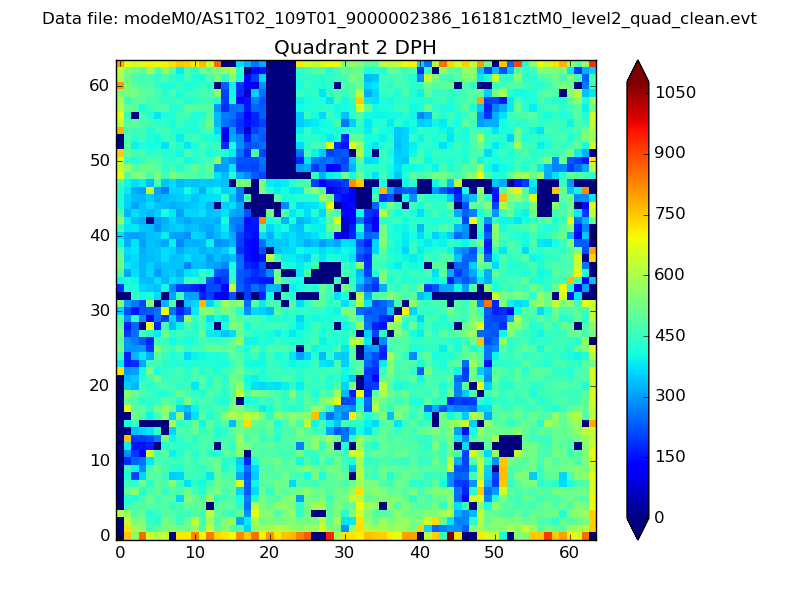
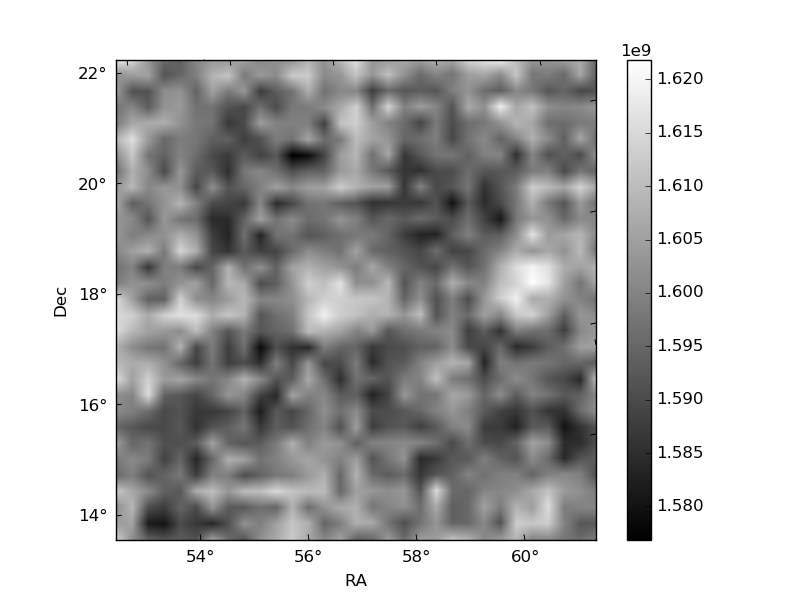
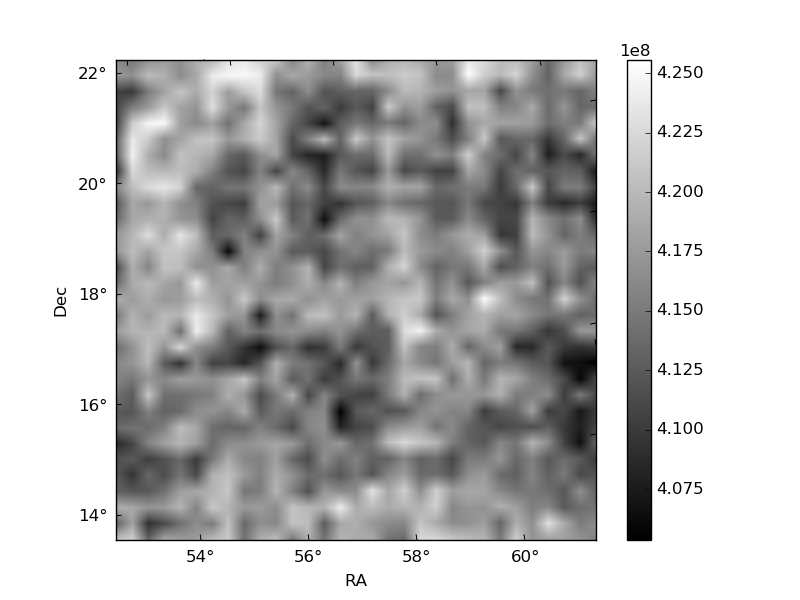
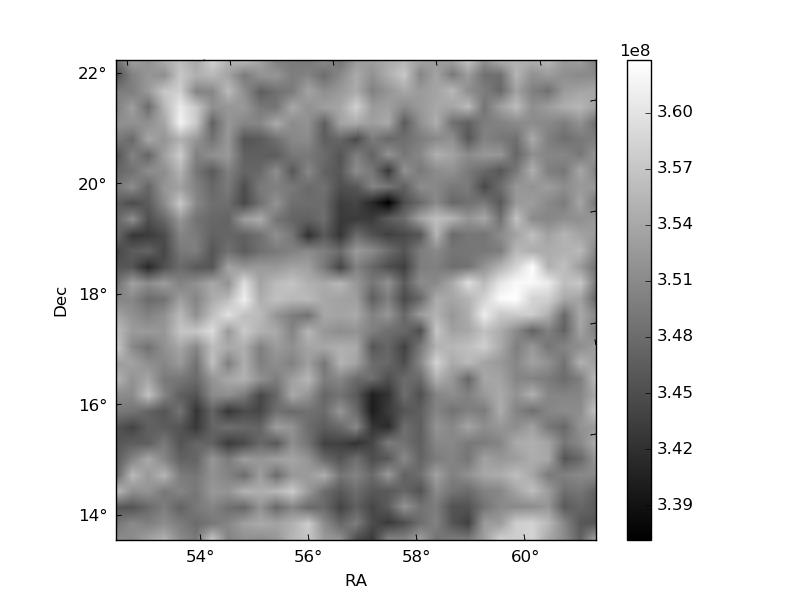
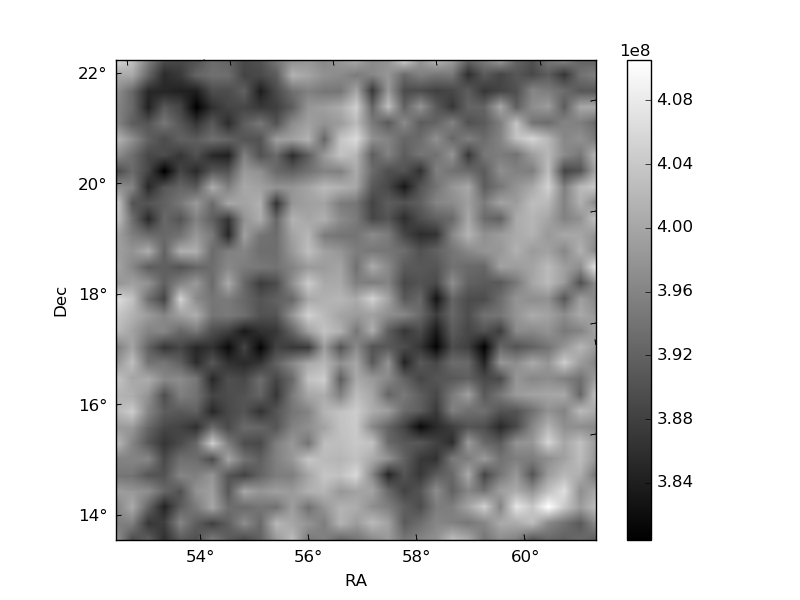
Histogram calculated using DETX and DETY for each event in the final _common_clean file
| Quadrant A | 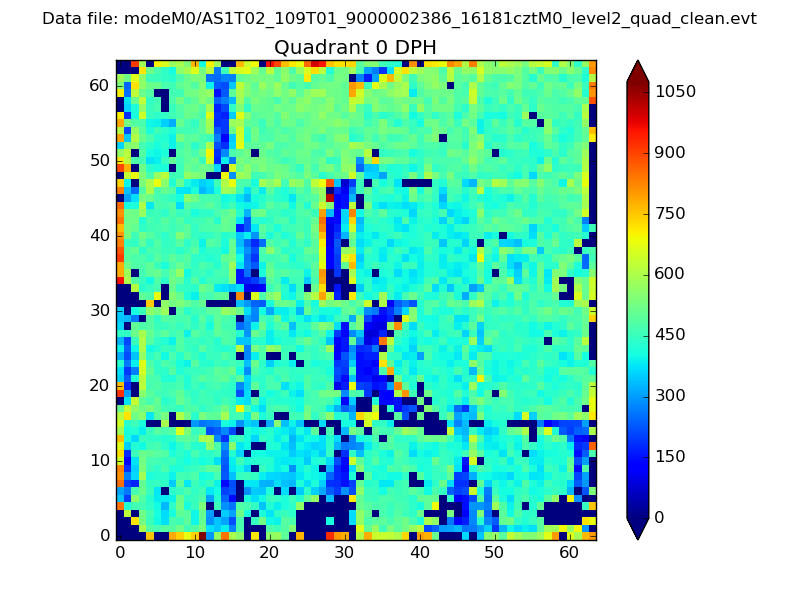 |
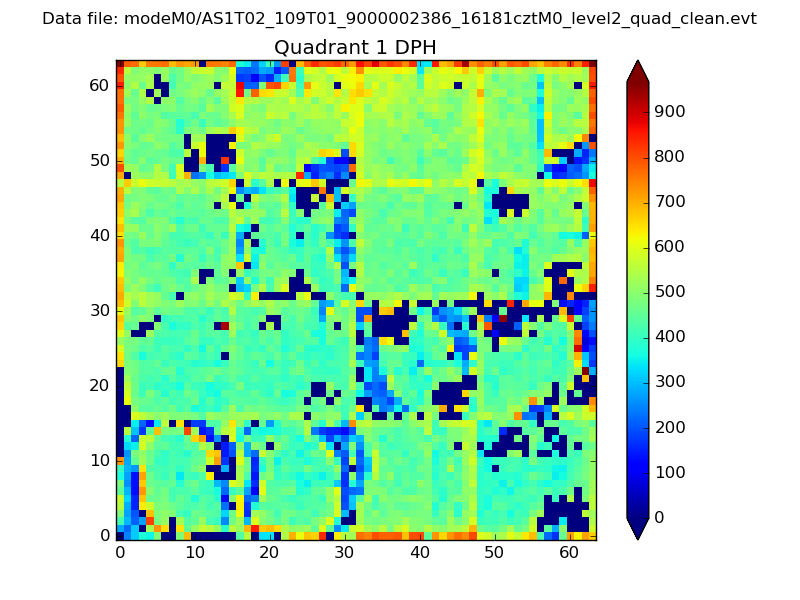 |
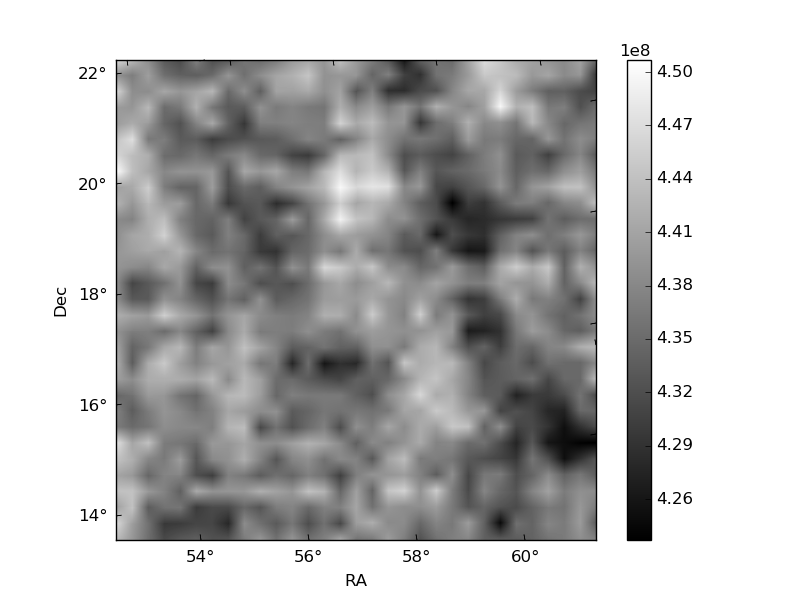
Quadrant B |
|---|---|---|---|
| Quadrant D | 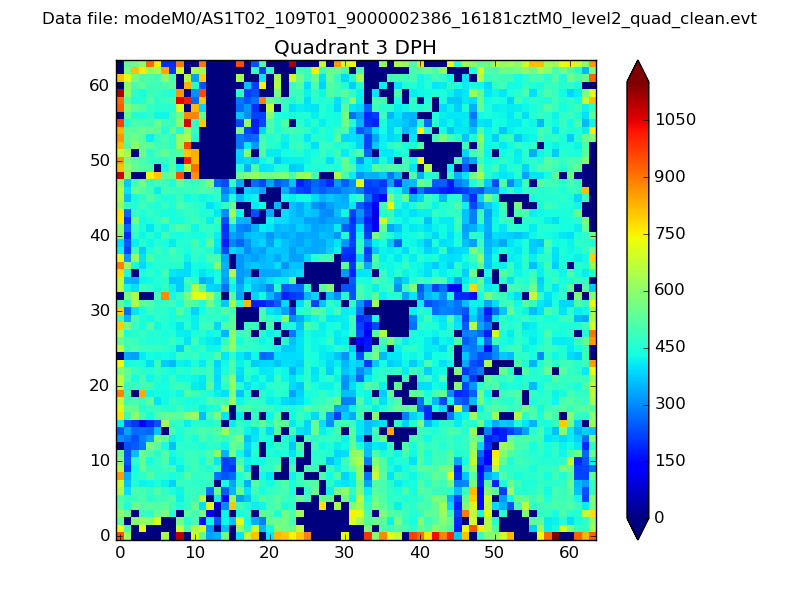 |
 |
Quadrant C |
| Plot type | Count rate plots | Images |
|---|---|---|
| Comparison with Poisson distribution Blue bars denote a histogram of data divided into 1 sec bins. Red curve is a Poisson curve with rate = median count rate of data. |
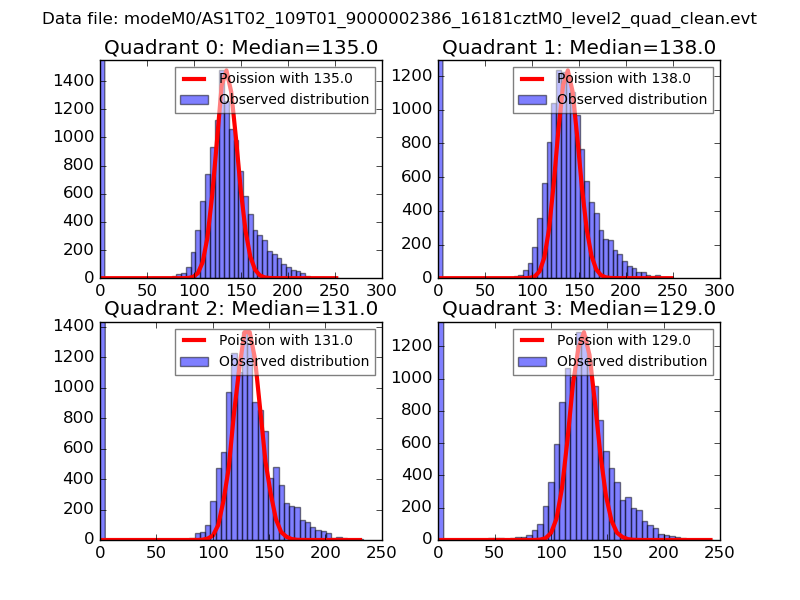 |
 |
| Quadrant-wise count rates Data is divided into 100 sec bins |
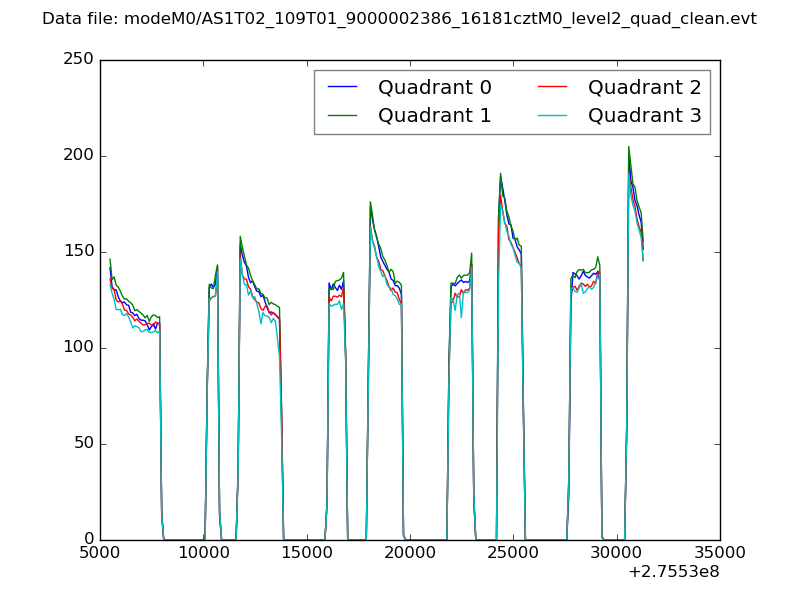 |
|
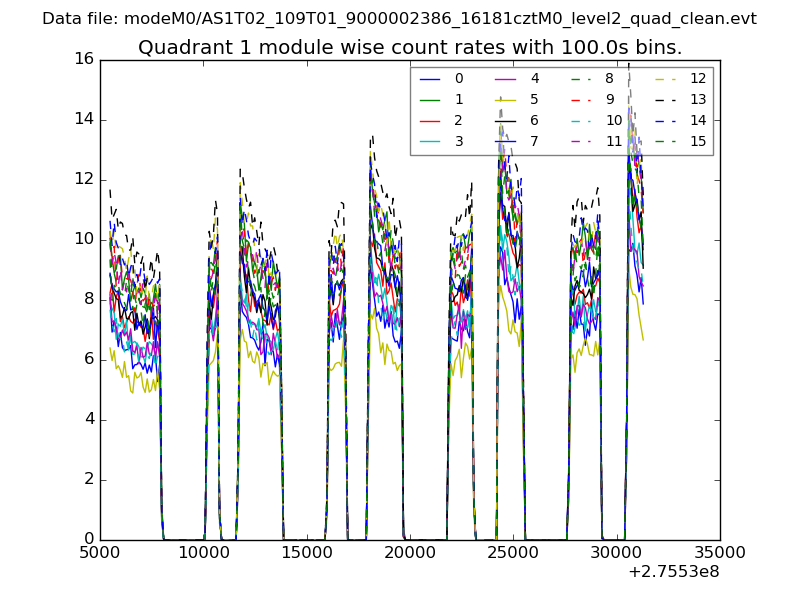
| Module-wise count rates for Quadrant A Data is divided into 100 sec bins |
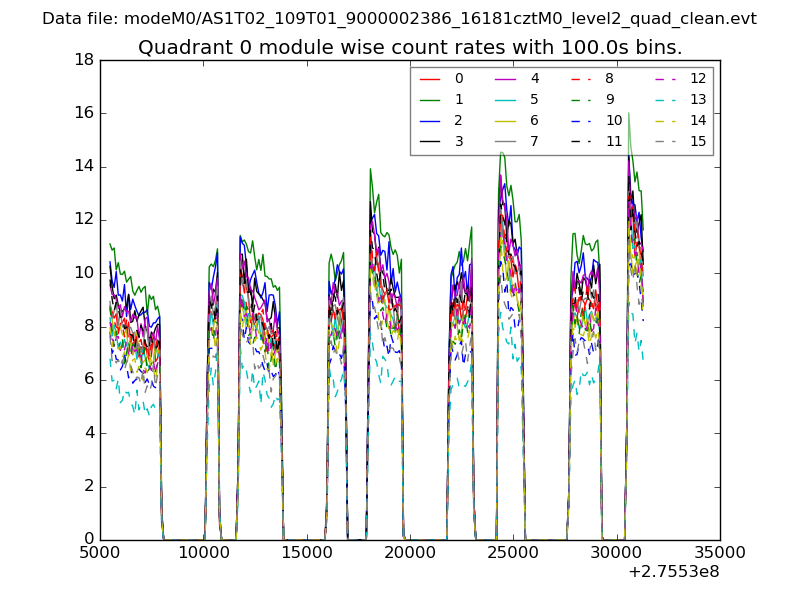 |
 |
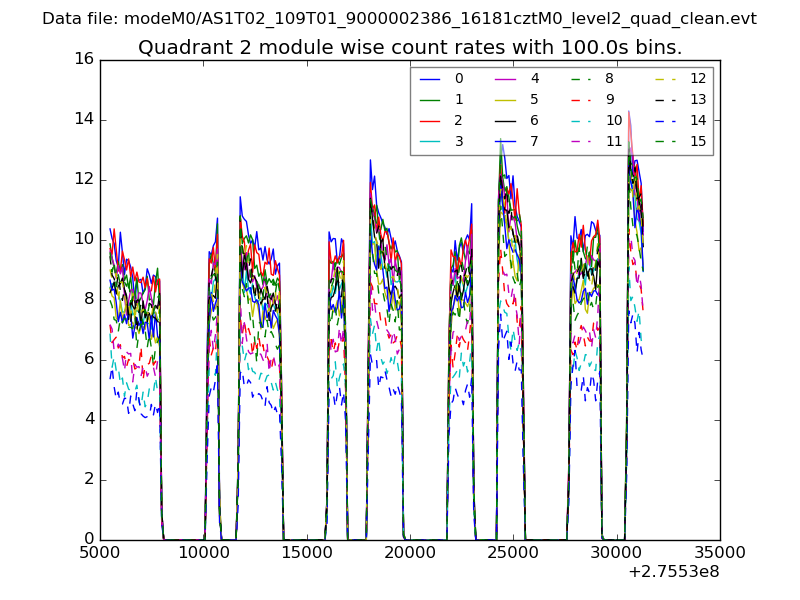
| Module-wise count rates for Quadrant B Data is divided into 100 sec bins |
 |
 |
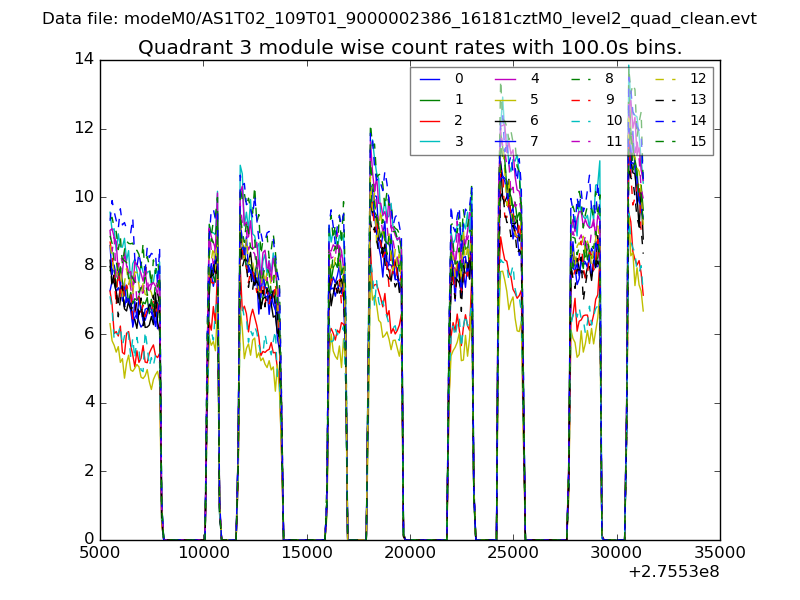
| Module-wise count rates for Quadrant C Data is divided into 100 sec bins |
 |
 |
| Module-wise count rates for Quadrant D Data is divided into 100 sec bins |
 |
 |
| Parameter | Plot |
|---|---|
| CZT HV Monitor | 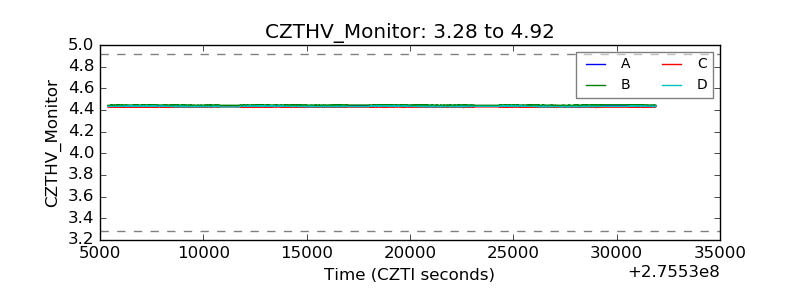 |
| D_VDD | 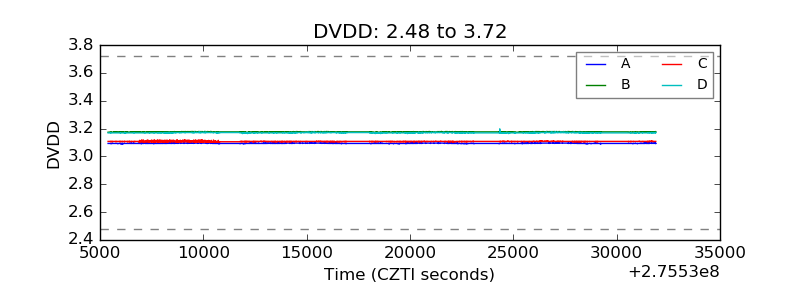 |
| Temperature 1 | 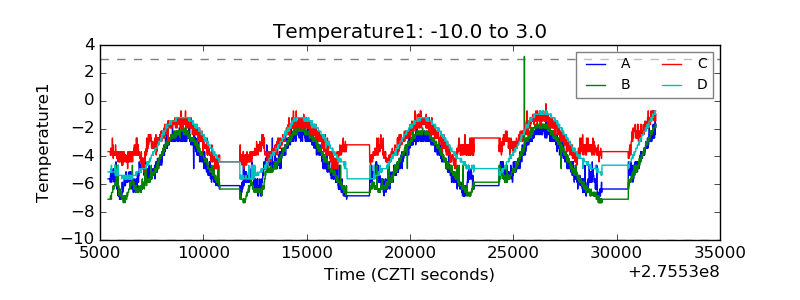 |
| Veto HV Monitor | 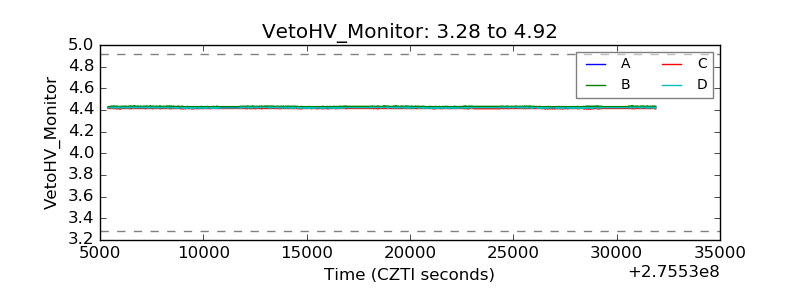 |
| Veto LLD | 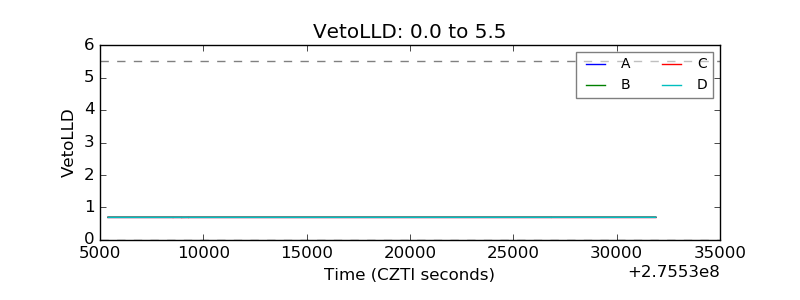 |
| Alpha Counter | 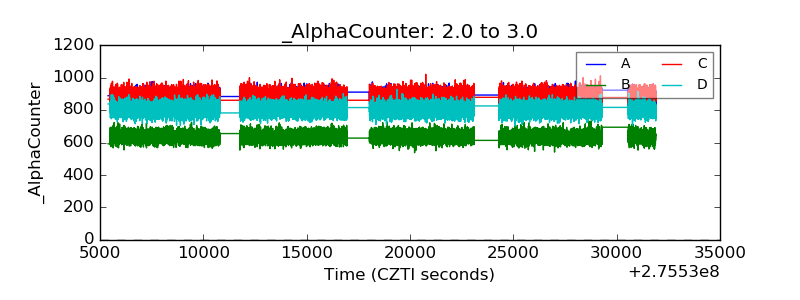 |
| _CPM_Rate | 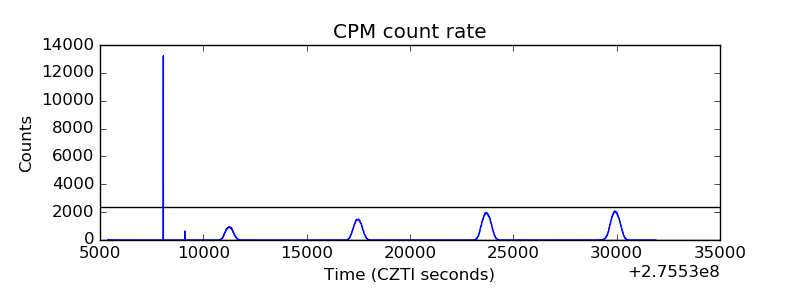 |
| CZT Counter | 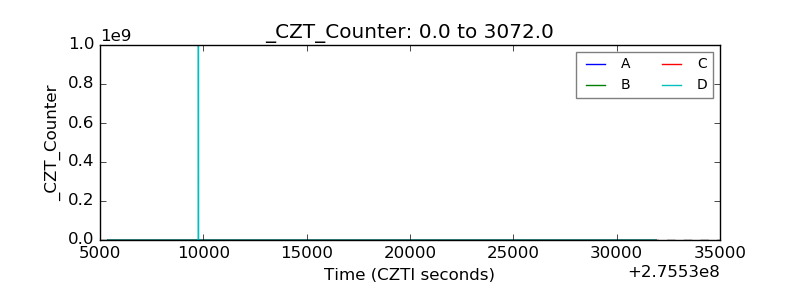 |
| +2.5 Volts monitor | 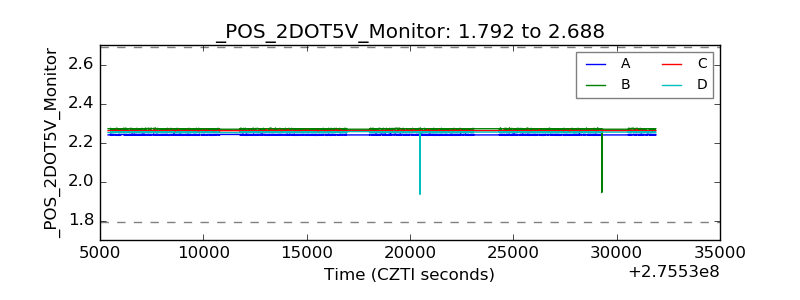 |
| +5 Volts monitor | 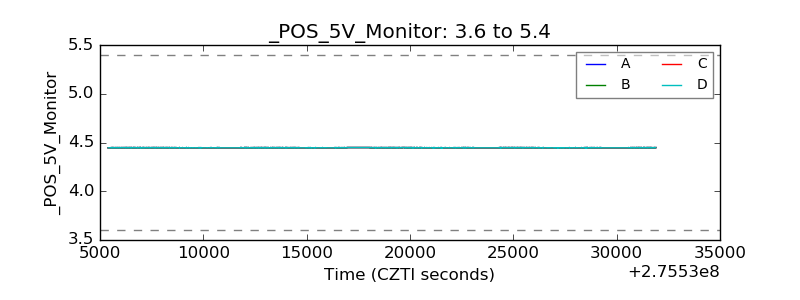 |
| _ROLL_ROT | 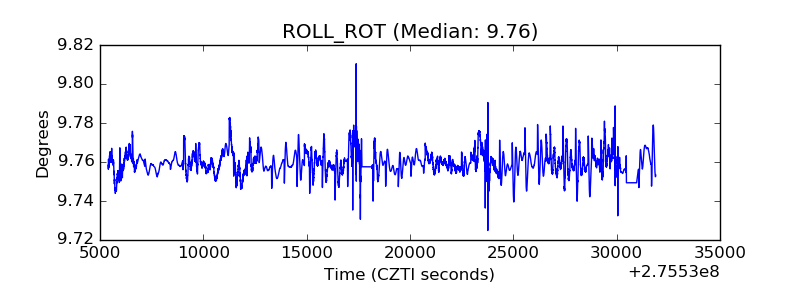 |
| _Roll_DEC | 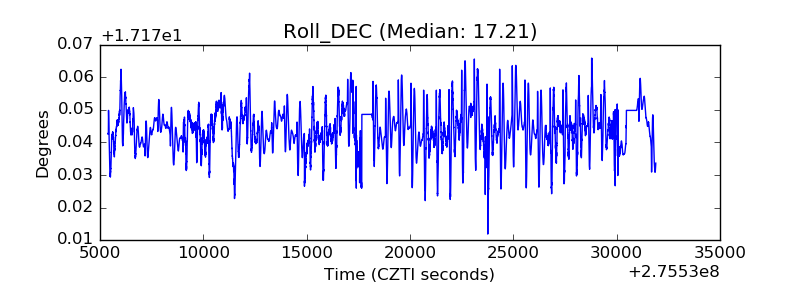 |
| _Roll_RA | 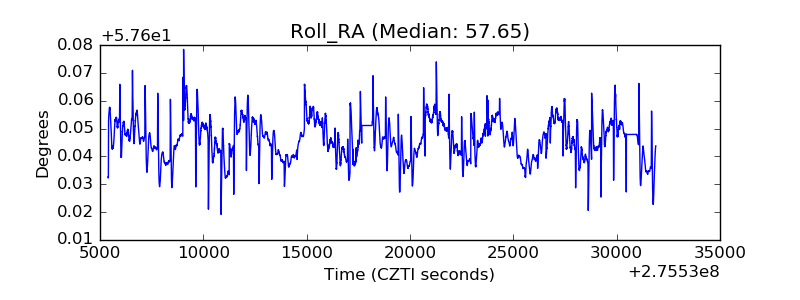 |
| Veto Counter | 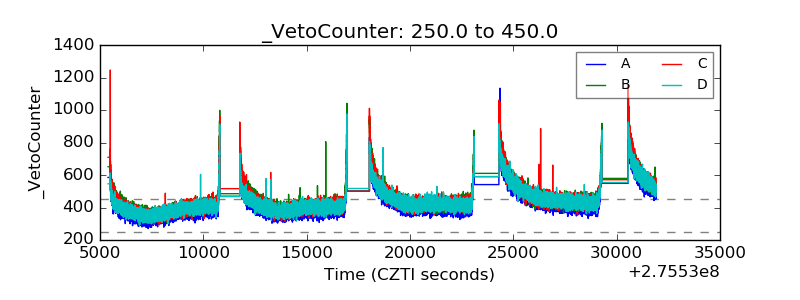 |