| Param | Original file | Final file |
|---|---|---|
| Filename | modeM0/AS1T02_109T01_9000002386_16183cztM0_level2.evt | modeM0/AS1T02_109T01_9000002386_16183cztM0_level2_quad_clean.evt |
| Size (bytes) | 484,021,440 | 65,787,840 |
| Size | 461.6 MB | 62.7 MB |
| Events in quadrant A | 3,444,148 | 393,244 |
| Events in quadrant B | 3,434,647 | 399,912 |
| Events in quadrant C | 3,657,358 | 377,966 |
| Events in quadrant D | 3,690,037 | 376,461 |
| Mode M0 | |||
|---|---|---|---|
| Quadrant | BADHDUFLAG | Total packets | Discarded packets |
| A | 0 | 14014 | 3 |
| B | 0 | 13800 | 2 |
| C | 0 | 14736 | 2 |
| D | 0 | 14809 | 2 |
| Mode SS | |||
|---|---|---|---|
| Quadrant | BADHDUFLAG | Total packets | Discarded packets |
| A | 0 | 130 | 0 |
| B | 0 | 130 | 0 |
| C | 0 | 130 | 0 |
| D | 0 | 130 | 0 |
| Mode M9 | |||
|---|---|---|---|
| Quadrant | BADHDUFLAG | Total packets | Discarded packets |
| A | 0 | 12 | 0 |
| B | 0 | 12 | 0 |
| C | 0 | 12 | 0 |
| D | 0 | 12 | 0 |
| Quadrant | Total seconds | Saturated seconds | Saturation percentage |
|---|---|---|---|
| A | 6364 | 139 | 2.184161% |
| B | 6364 | 139 | 2.184161% |
| C | 6364 | 197 | 3.095537% |
| D | 6364 | 192 | 3.016970% |
Noise dominated data is calculated using 1-second bins in cleaned event files. If a bin has >2000 counts, and if more than 50% of those come from <1% of pixels, then it is considered to be noise-dominated and hence unusable.
| Quadrant | # 1 sec bins | Bins with >0 counts | Bins with >2000 counts | High rate bins dominated by noise | Noise dominated (total time) | Noise dominated (detector-on time) | Marked lightcurve |
|---|---|---|---|---|---|---|---|
| A | 7585 | 6366 | 4 | 4 | 0.05% | 0.06% | 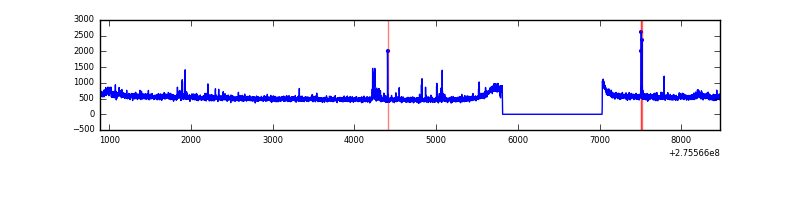 |
| B | 7584 | 6365 | 1 | 1 | 0.01% | 0.02% | 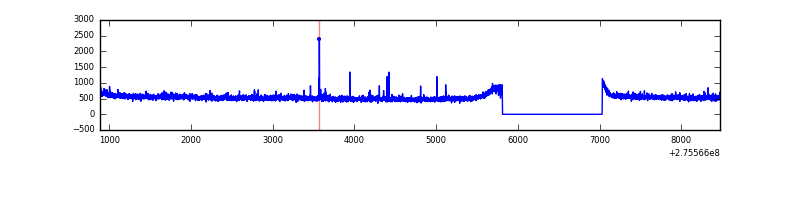 |
| C | 7585 | 6366 | 19 | 19 | 0.25% | 0.30% | 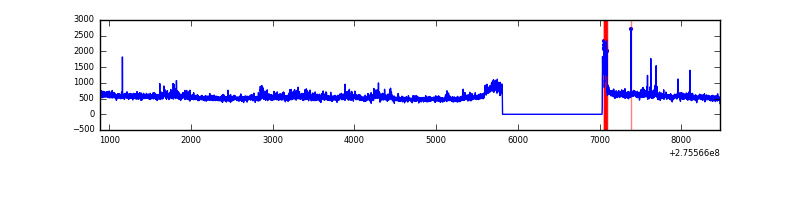 |
| D | 7584 | 6365 | 67 | 67 | 0.88% | 1.05% | 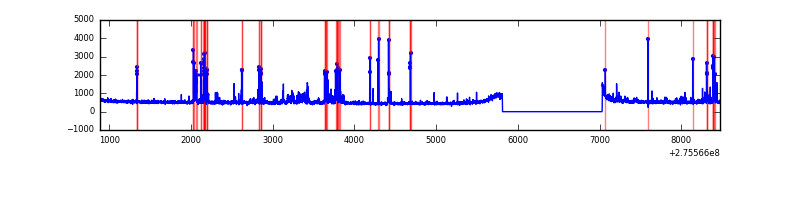 |
Top three noisy pixels from each quadrant. If the there are fewer than three noisy pixels in the level2.evt file, extra rows are filled as -1
| Pixel properties | Quadrant properties | ||||||
|---|---|---|---|---|---|---|---|
| Quadrant | DetID | PixID | Counts | Sigma | Mean | Median | Sigma |
| A | 15 | 174 | 75217 | 433.42 | 864 | 848 | 171.6 |
| A | 8 | 247 | 47092 | 269.51 | 864 | 848 | 171.6 |
| A | 0 | 226 | 7689 | 39.87 | 864 | 848 | 171.6 |
| B | 3 | 209 | 24444 | 146.15 | 853 | 832 | 161.6 |
| B | 0 | 189 | 23518 | 140.42 | 853 | 832 | 161.6 |
| B | 0 | 229 | 21074 | 125.29 | 853 | 832 | 161.6 |
| C | 7 | 247 | 211087 | 1122.52 | 815 | 822 | 187.3 |
| C | 14 | 238 | 126866 | 672.9 | 815 | 822 | 187.3 |
| C | 3 | 233 | 118980 | 630.8 | 815 | 822 | 187.3 |
| D | 1 | 52 | 175548 | 854.76 | 840 | 817 | 204.4 |
| D | 7 | 38 | 168095 | 818.3 | 840 | 817 | 204.4 |
| D | 2 | 33 | 123101 | 598.2 | 840 | 817 | 204.4 |
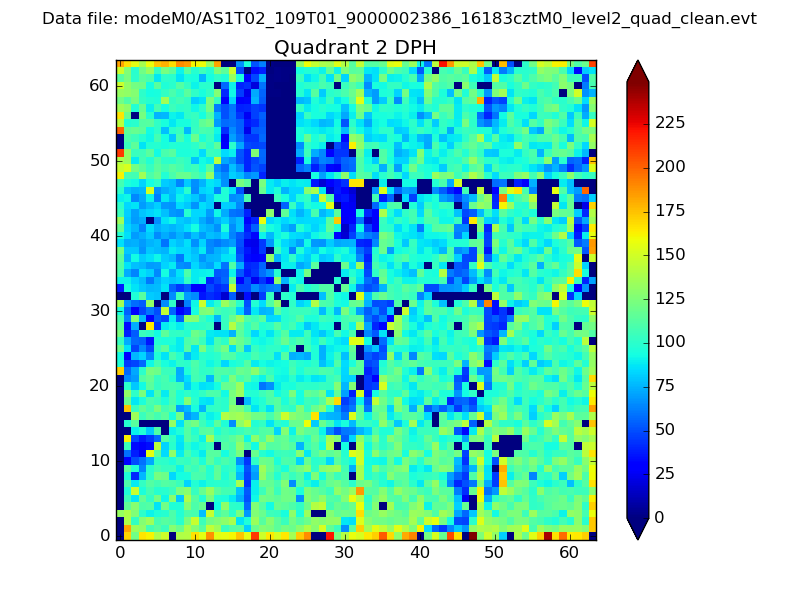
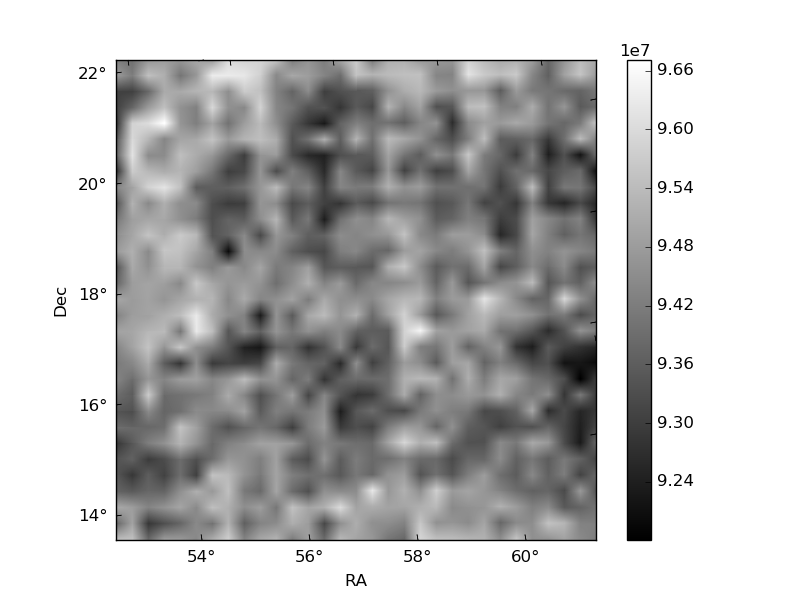
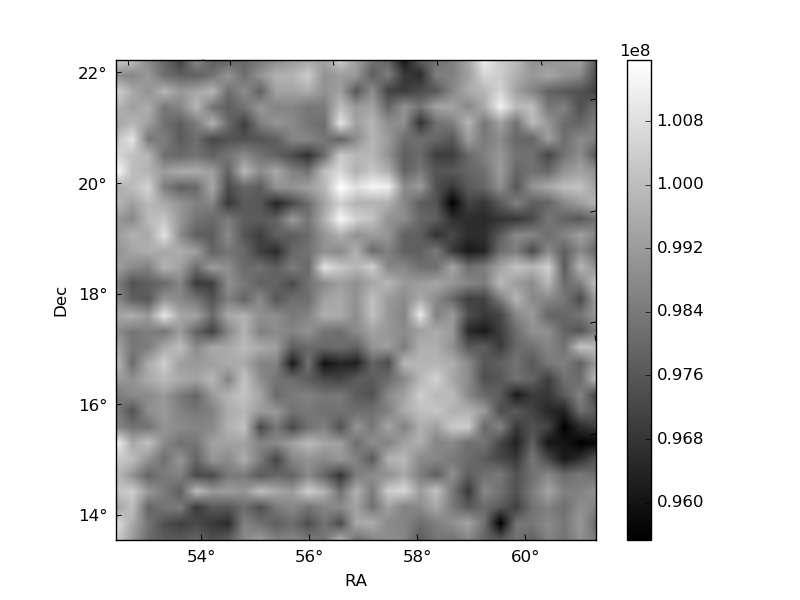
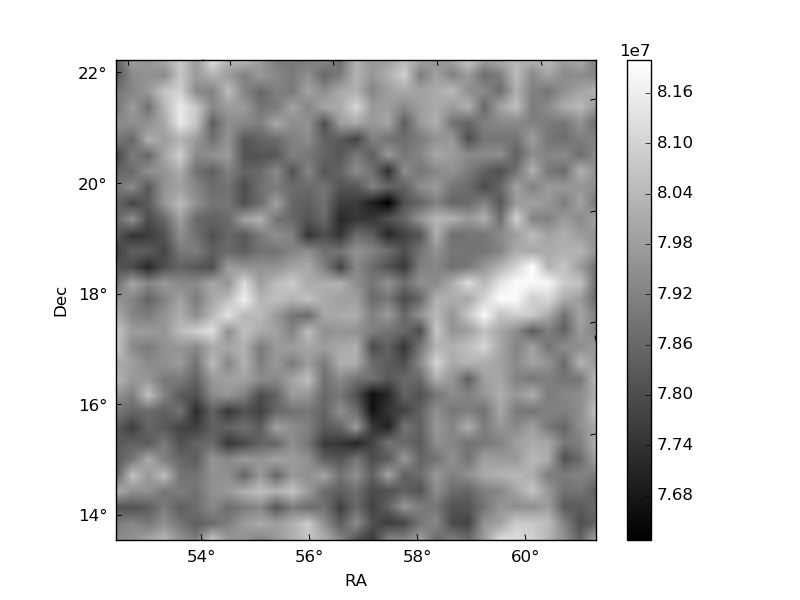
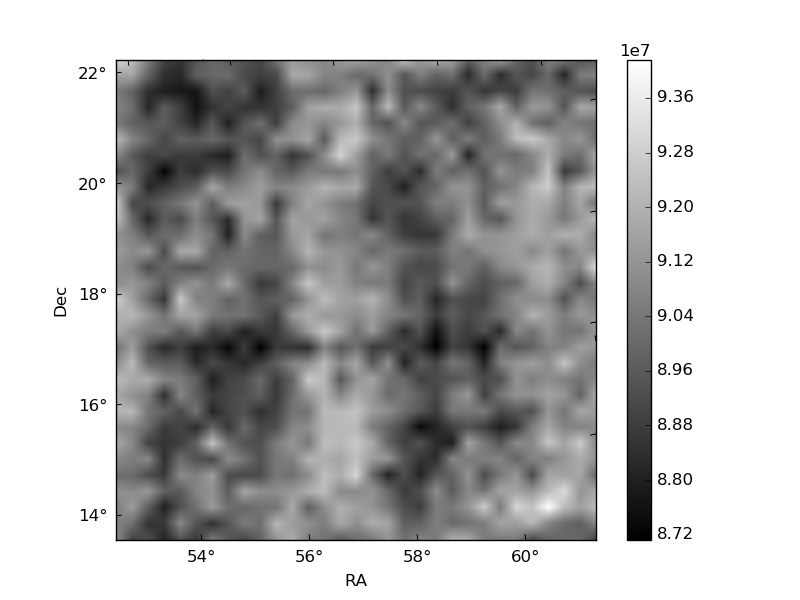
Histogram calculated using DETX and DETY for each event in the final _common_clean file
| Quadrant A | 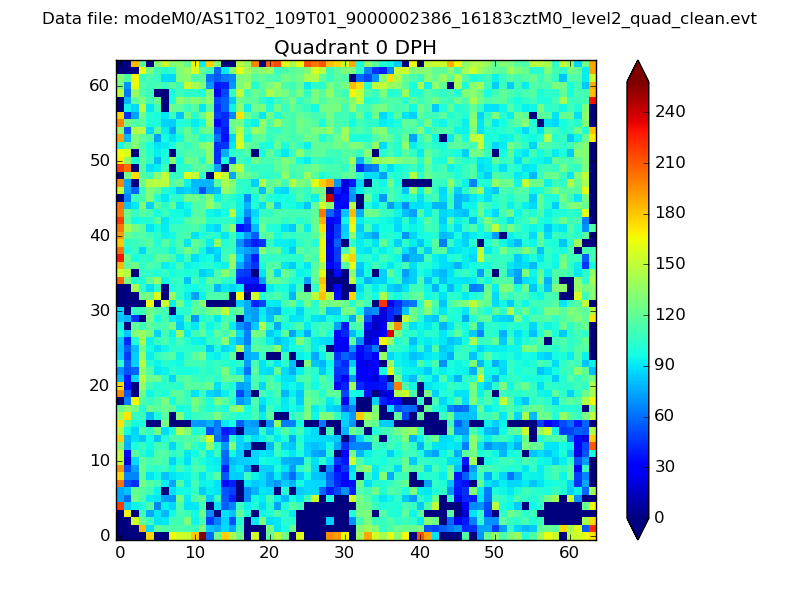 |
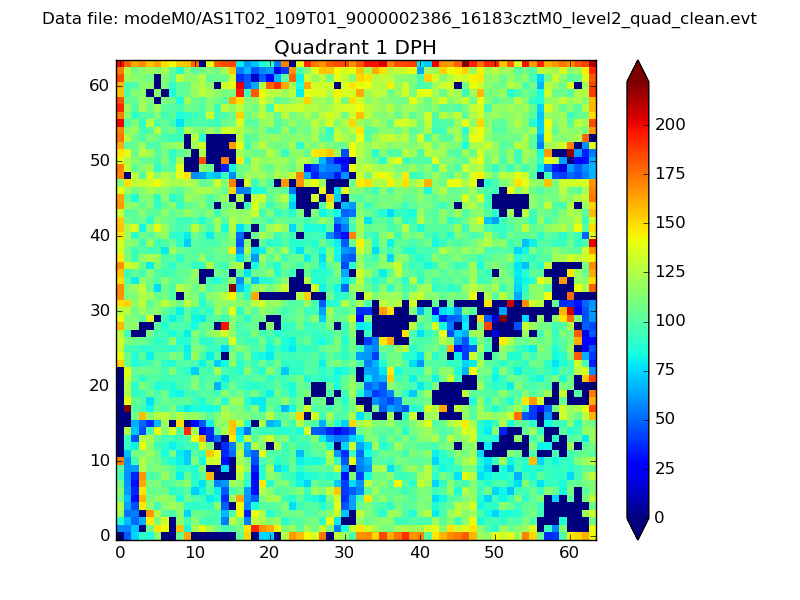 |
Quadrant B |
|---|---|---|---|
| Quadrant D | 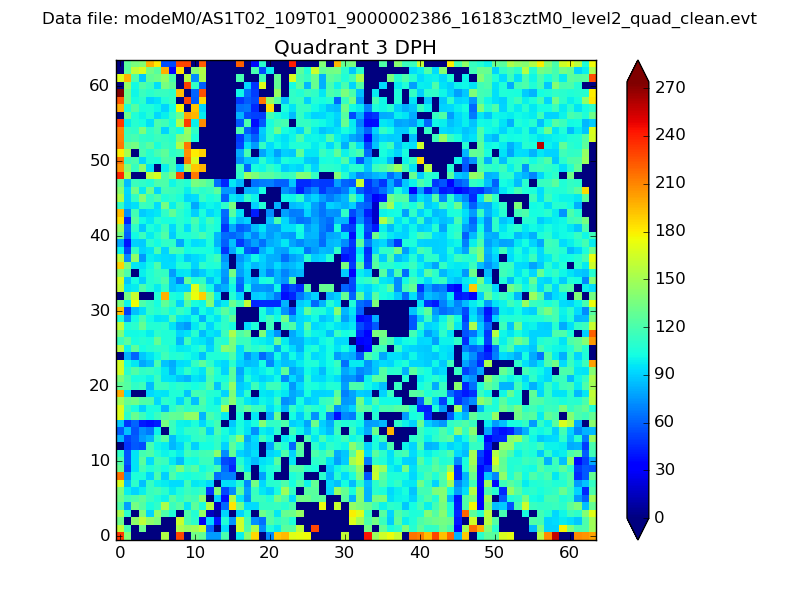 |
 |
Quadrant C |
| Plot type | Count rate plots | Images |
|---|---|---|
| Comparison with Poisson distribution Blue bars denote a histogram of data divided into 1 sec bins. Red curve is a Poisson curve with rate = median count rate of data. |
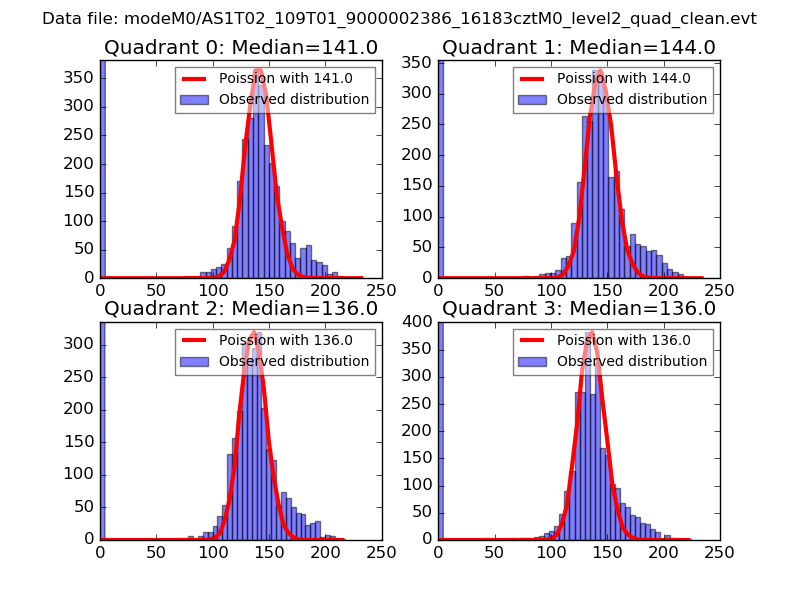 |
 |
| Quadrant-wise count rates Data is divided into 100 sec bins |
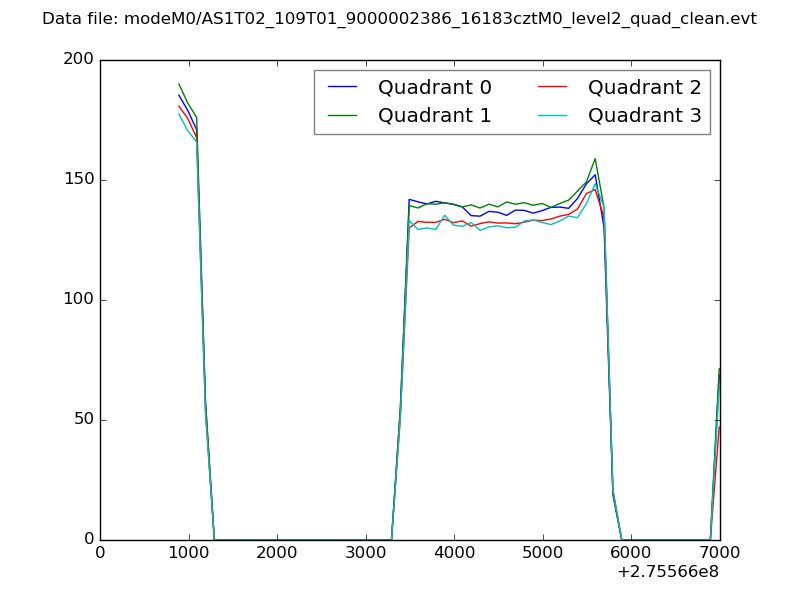 |
|
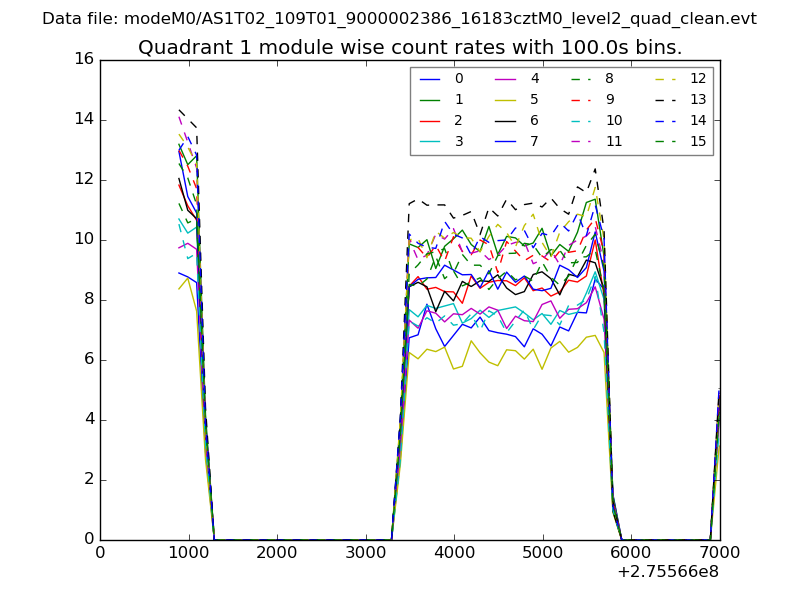
| Module-wise count rates for Quadrant A Data is divided into 100 sec bins |
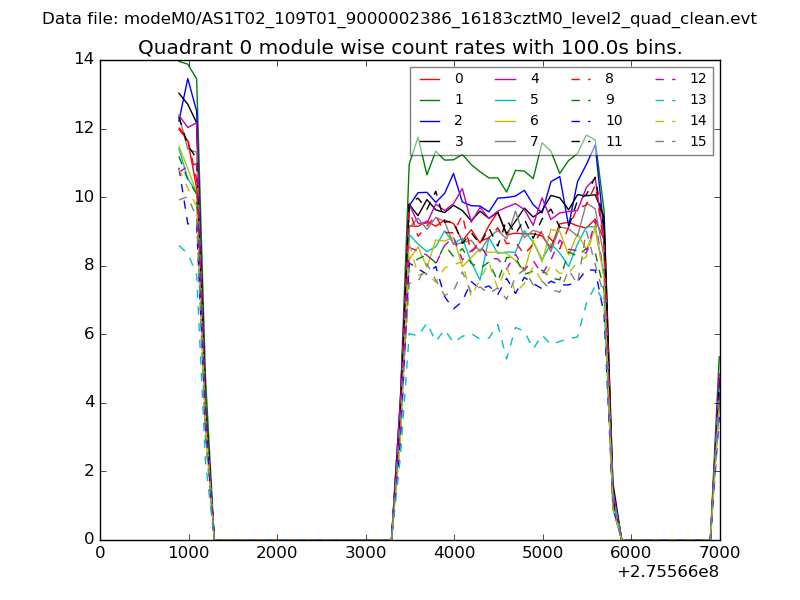 |
 |
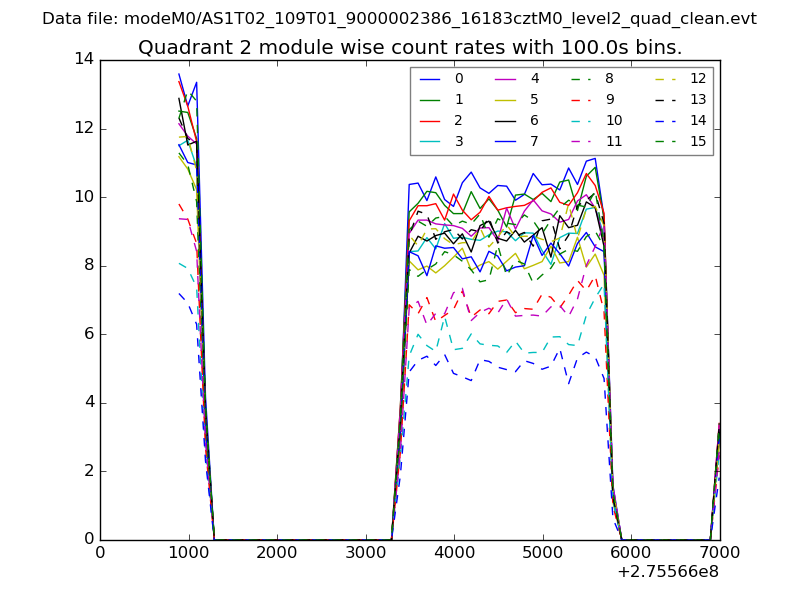
| Module-wise count rates for Quadrant B Data is divided into 100 sec bins |
 |
 |
| Module-wise count rates for Quadrant C Data is divided into 100 sec bins |
 |
 |
| Module-wise count rates for Quadrant D Data is divided into 100 sec bins |
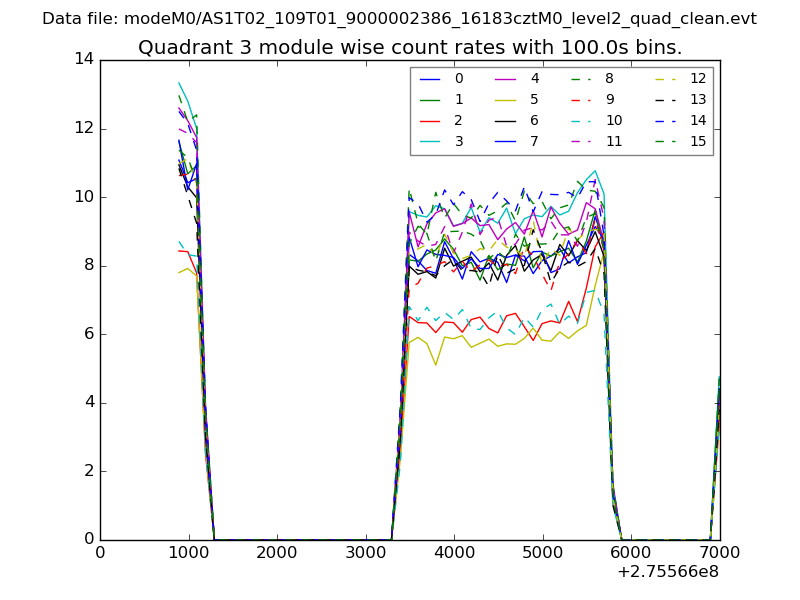 |
 |
| Parameter | Plot |
|---|---|
| CZT HV Monitor | 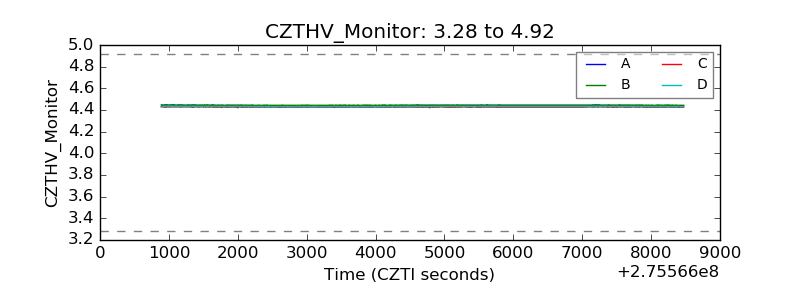 |
| D_VDD | 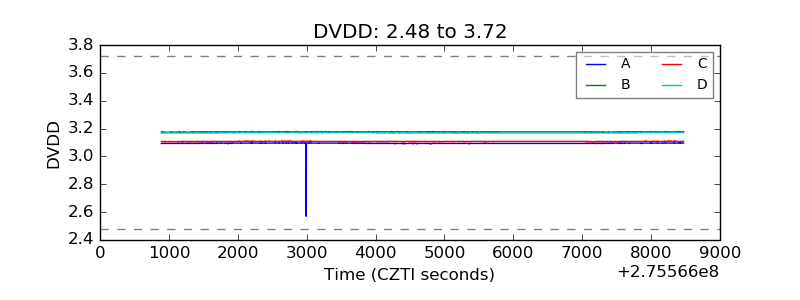 |
| Temperature 1 | 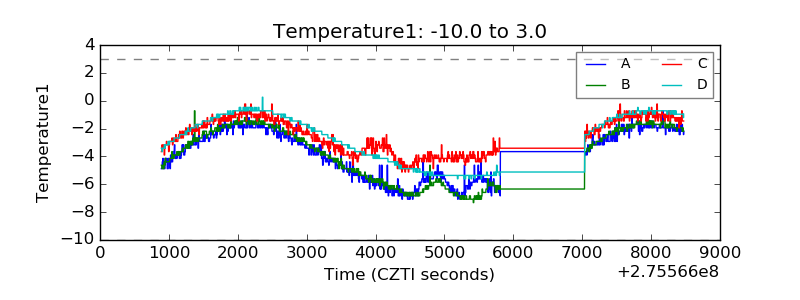 |
| Veto HV Monitor | 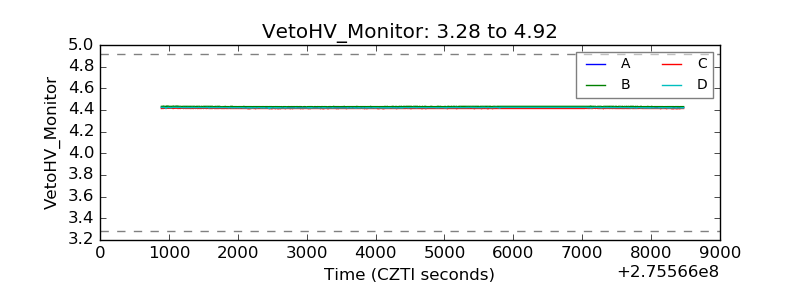 |
| Veto LLD | 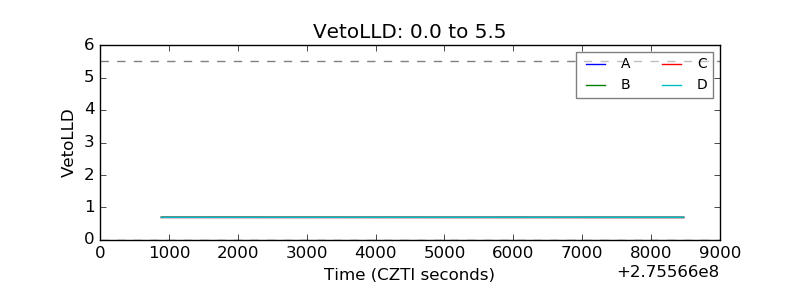 |
| Alpha Counter | 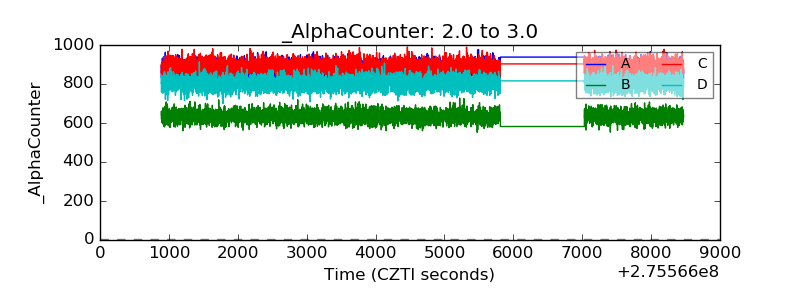 |
| _CPM_Rate | 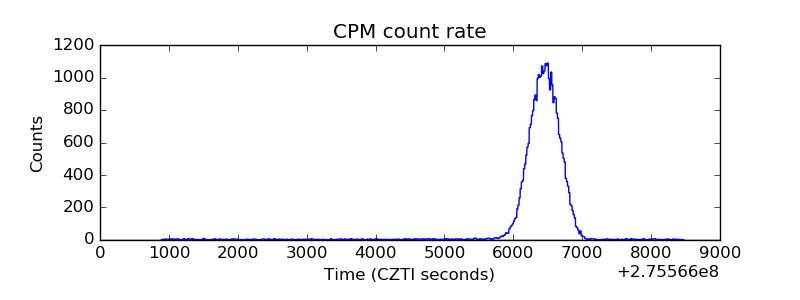 |
| CZT Counter |  |
| +2.5 Volts monitor |  |
| +5 Volts monitor | 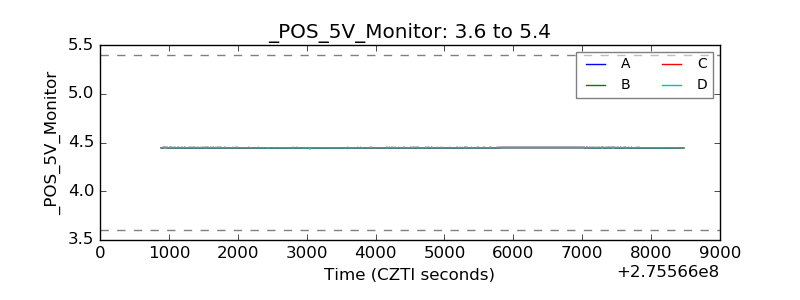 |
| _ROLL_ROT | 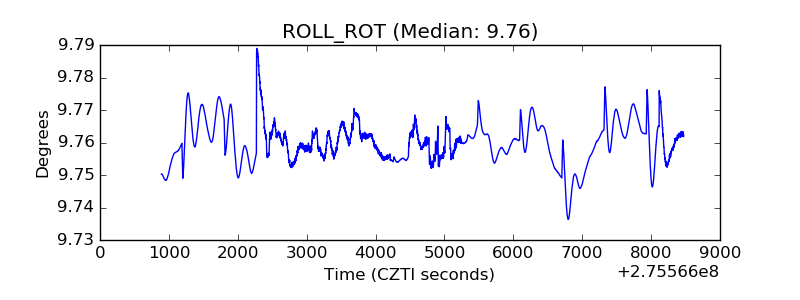 |
| _Roll_DEC |  |
| _Roll_RA |  |
| Veto Counter | 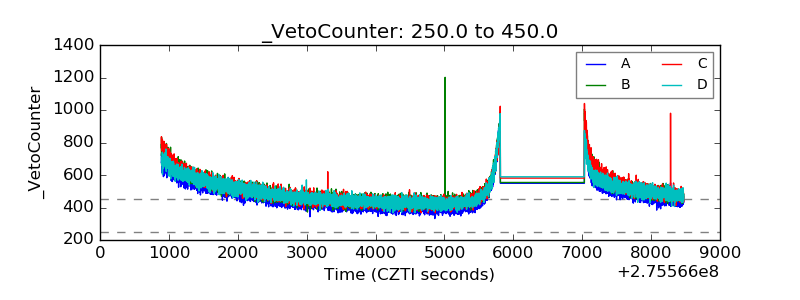 |