| Param | Original file | Final file |
|---|---|---|
| Filename | modeM0/AS1T02_109T01_9000002386_16185cztM0_level2.evt | modeM0/AS1T02_109T01_9000002386_16185cztM0_level2_quad_clean.evt |
| Size (bytes) | 526,046,400 | 75,568,320 |
| Size | 501.7 MB | 72.1 MB |
| Events in quadrant A | 4,392,266 | 447,563 |
| Events in quadrant B | 3,502,305 | 469,572 |
| Events in quadrant C | 3,768,702 | 451,351 |
| Events in quadrant D | 3,806,894 | 445,640 |
| Mode M0 | |||
|---|---|---|---|
| Quadrant | BADHDUFLAG | Total packets | Discarded packets |
| A | 0 | 17422 | 3 |
| B | 0 | 14607 | 2 |
| C | 0 | 15441 | 2 |
| D | 0 | 15865 | 2 |
| Mode SS | |||
|---|---|---|---|
| Quadrant | BADHDUFLAG | Total packets | Discarded packets |
| A | 0 | 136 | 0 |
| B | 0 | 136 | 0 |
| C | 0 | 136 | 0 |
| D | 0 | 136 | 0 |
| Mode M9 | |||
|---|---|---|---|
| Quadrant | BADHDUFLAG | Total packets | Discarded packets |
| A | 0 | 15 | 0 |
| B | 0 | 15 | 0 |
| C | 0 | 15 | 0 |
| D | 0 | 16 | 0 |
| Quadrant | Total seconds | Saturated seconds | Saturation percentage |
|---|---|---|---|
| A | 6807 | 283 | 4.157485% |
| B | 6807 | 66 | 0.969590% |
| C | 6807 | 106 | 1.557221% |
| D | 6807 | 67 | 0.984281% |
Noise dominated data is calculated using 1-second bins in cleaned event files. If a bin has >2000 counts, and if more than 50% of those come from <1% of pixels, then it is considered to be noise-dominated and hence unusable.
| Quadrant | # 1 sec bins | Bins with >0 counts | Bins with >2000 counts | High rate bins dominated by noise | Noise dominated (total time) | Noise dominated (detector-on time) | Marked lightcurve |
|---|---|---|---|---|---|---|---|
| A | 7578 | 6809 | 186 | 186 | 2.45% | 2.73% | 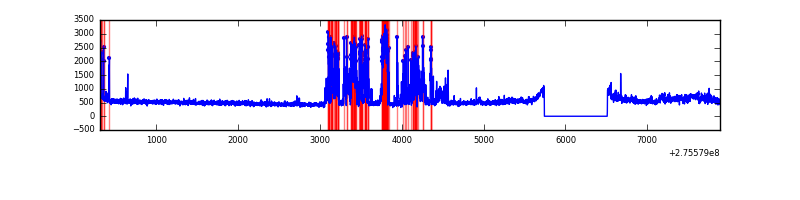 |
| B | 7578 | 6809 | 0 | 0 | 0.00% | 0.00% | 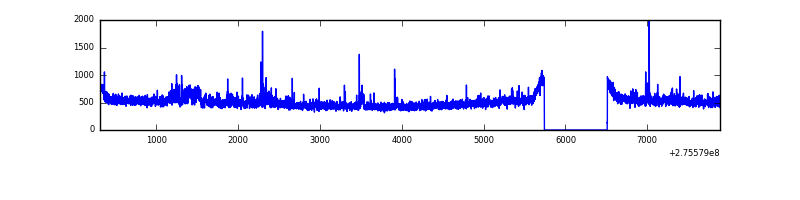 |
| C | 7578 | 6809 | 1 | 1 | 0.01% | 0.01% | 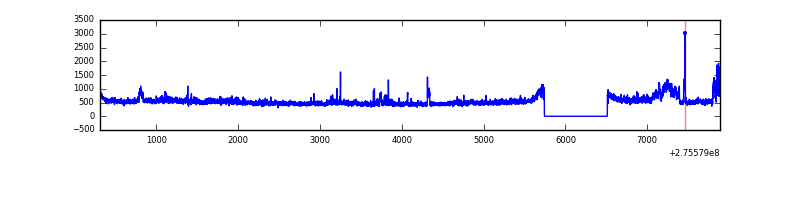 |
| D | 7578 | 6809 | 10 | 10 | 0.13% | 0.15% | 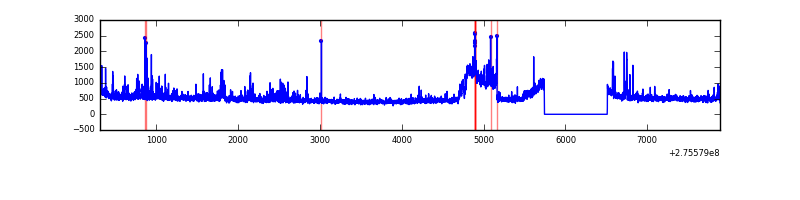 |
Top three noisy pixels from each quadrant. If the there are fewer than three noisy pixels in the level2.evt file, extra rows are filled as -1
| Pixel properties | Quadrant properties | ||||||
|---|---|---|---|---|---|---|---|
| Quadrant | DetID | PixID | Counts | Sigma | Mean | Median | Sigma |
| A | 15 | 174 | 968076 | 5689.57 | 840 | 822 | 170.0 |
| A | 8 | 247 | 191236 | 1120.05 | 840 | 822 | 170.0 |
| A | 0 | 226 | 7439 | 38.92 | 840 | 822 | 170.0 |
| B | 4 | 216 | 57462 | 346.9 | 849 | 829 | 163.3 |
| B | 3 | 64 | 29215 | 173.87 | 849 | 829 | 163.3 |
| B | 0 | 219 | 26206 | 155.44 | 849 | 829 | 163.3 |
| C | 3 | 233 | 283039 | 1481.04 | 813 | 818 | 190.6 |
| C | 7 | 247 | 167700 | 875.76 | 813 | 818 | 190.6 |
| C | 14 | 238 | 125918 | 656.5 | 813 | 818 | 190.6 |
| D | 15 | 0 | 293946 | 1437.66 | 831 | 808 | 203.9 |
| D | 1 | 52 | 247929 | 1211.97 | 831 | 808 | 203.9 |
| D | 10 | 70 | 55042 | 265.98 | 831 | 808 | 203.9 |
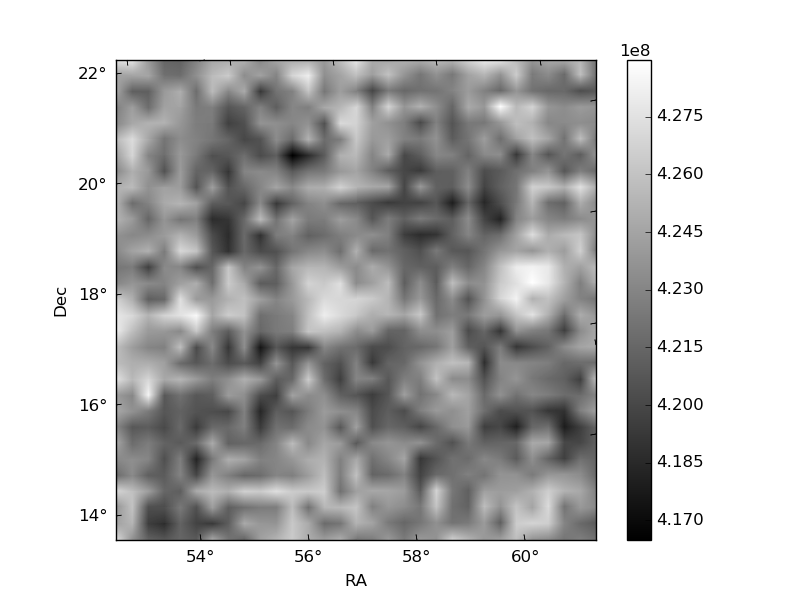
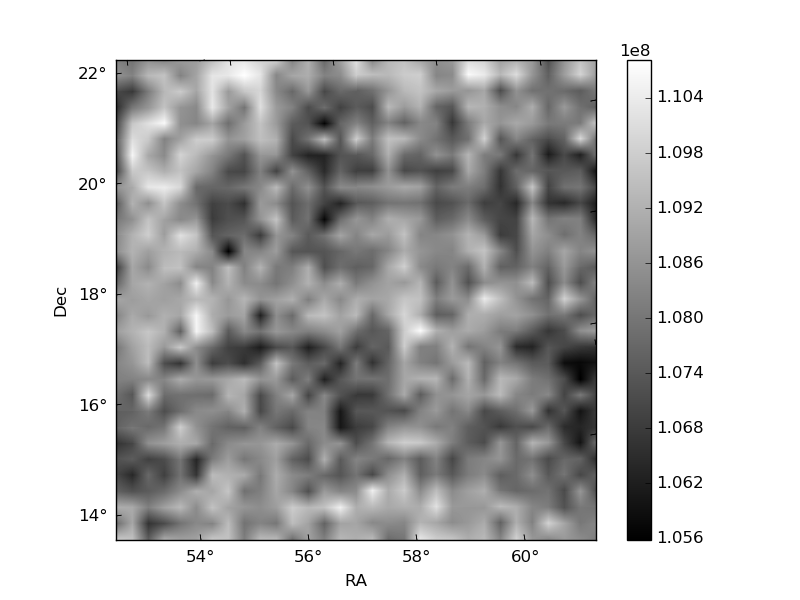
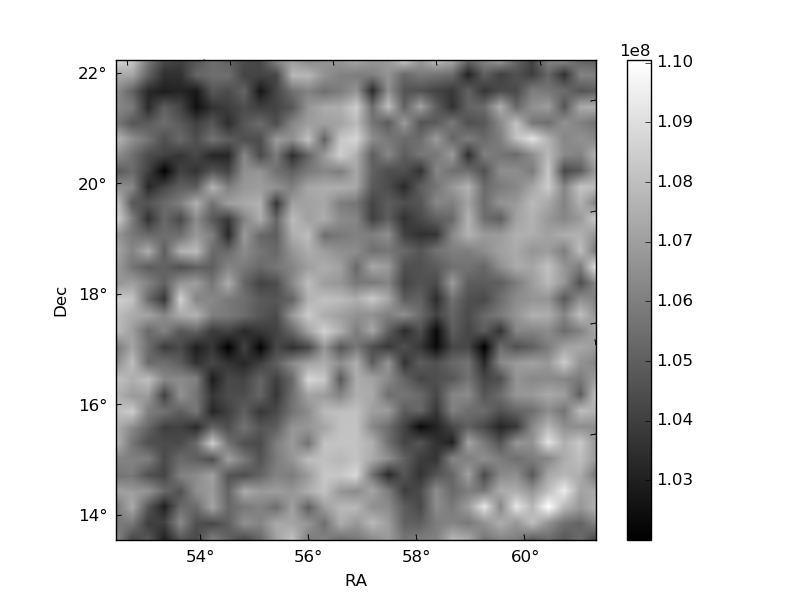
Histogram calculated using DETX and DETY for each event in the final _common_clean file
| Quadrant A | 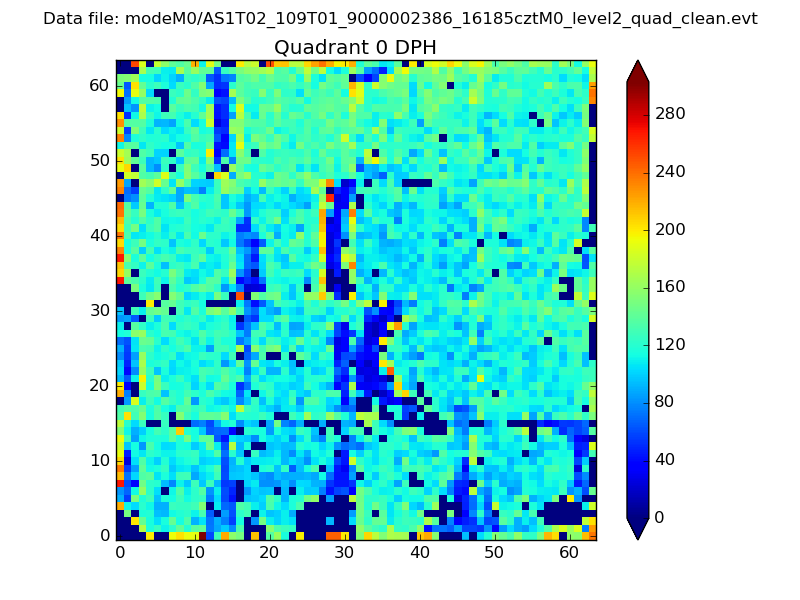 |
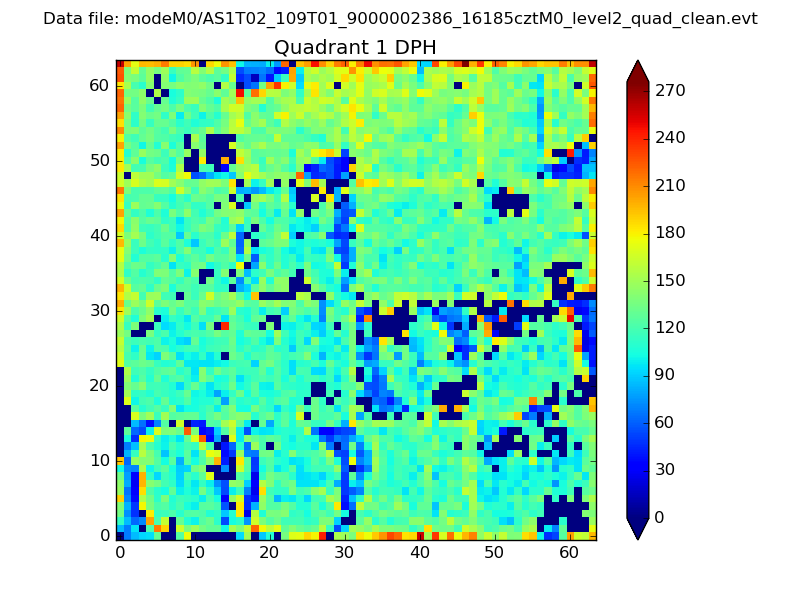 |
Quadrant B |
|---|---|---|---|
| Quadrant D |  |
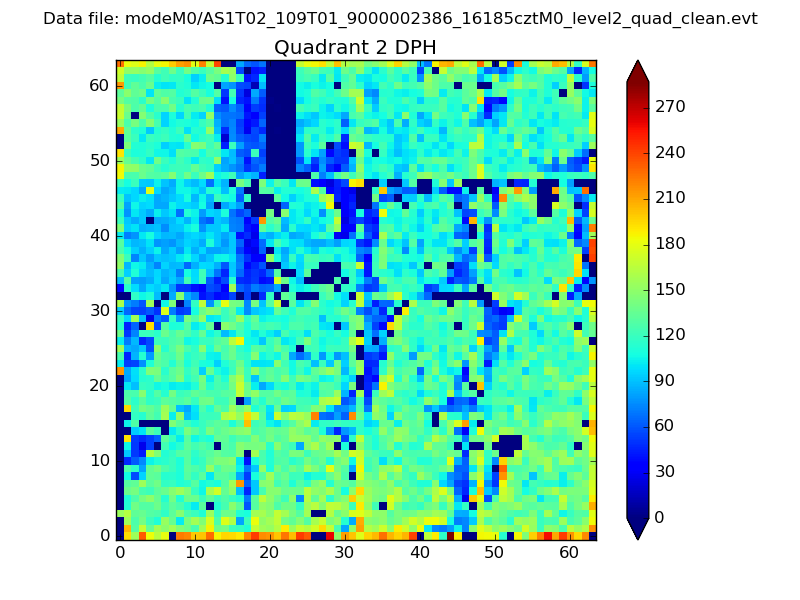 |
Quadrant C |
| Plot type | Count rate plots | Images |
|---|---|---|
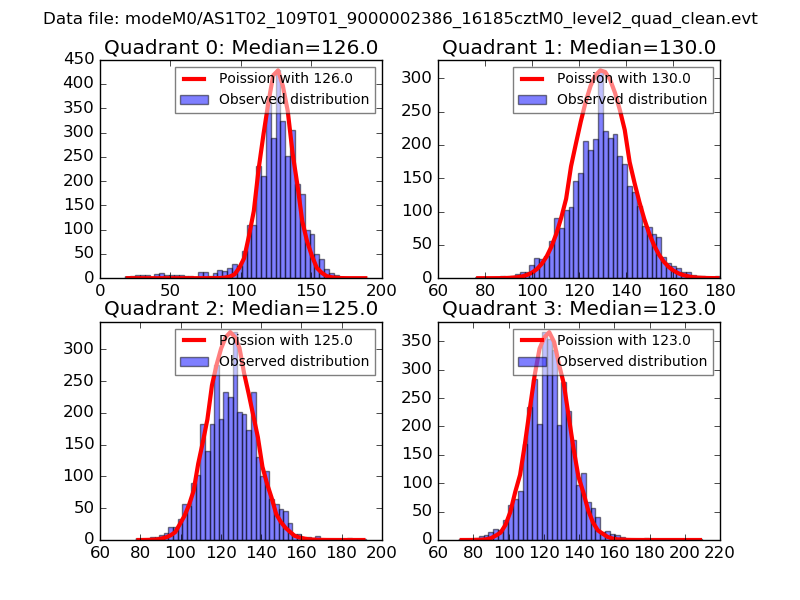
| Comparison with Poisson distribution Blue bars denote a histogram of data divided into 1 sec bins. Red curve is a Poisson curve with rate = median count rate of data. |
 |
 |
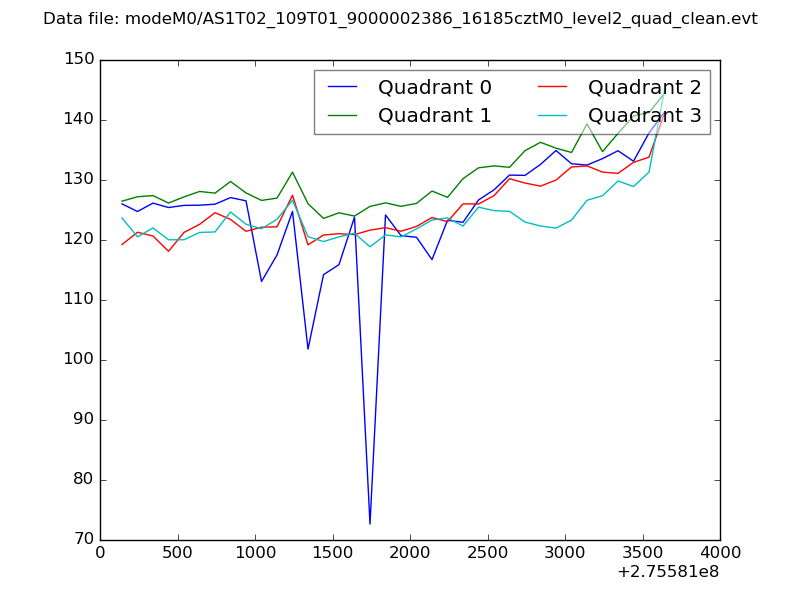
| Quadrant-wise count rates Data is divided into 100 sec bins |
 |
|
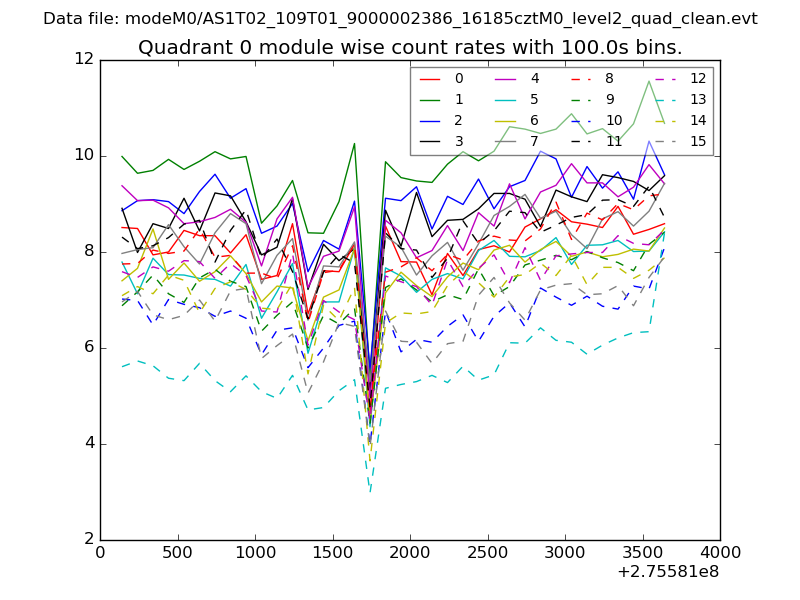
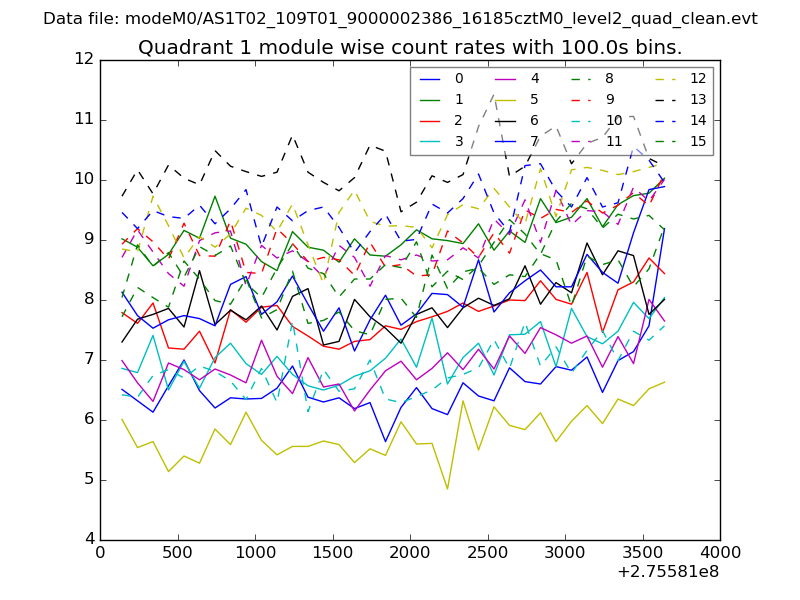
| Module-wise count rates for Quadrant A Data is divided into 100 sec bins |
 |
 |
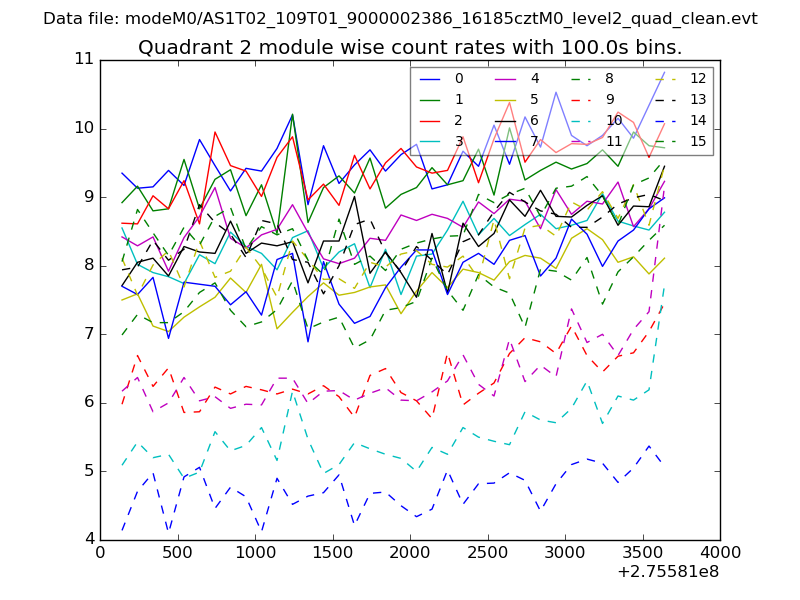
| Module-wise count rates for Quadrant B Data is divided into 100 sec bins |
 |
 |
| Module-wise count rates for Quadrant C Data is divided into 100 sec bins |
 |
 |
| Module-wise count rates for Quadrant D Data is divided into 100 sec bins |
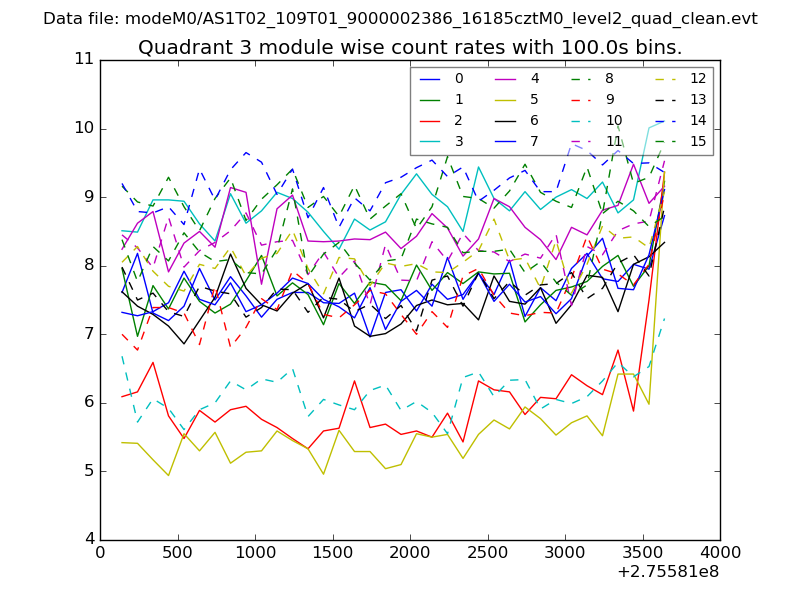 |
 |
| Parameter | Plot |
|---|---|
| CZT HV Monitor | 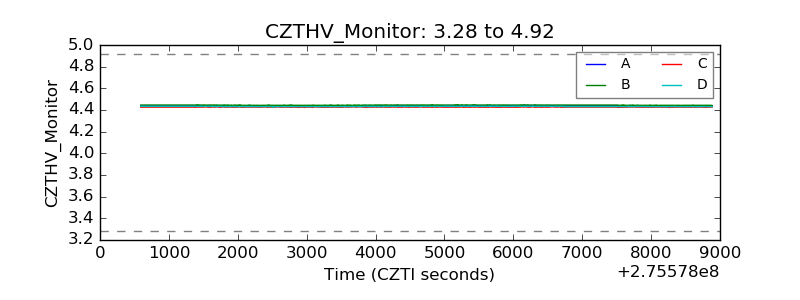 |
| D_VDD | 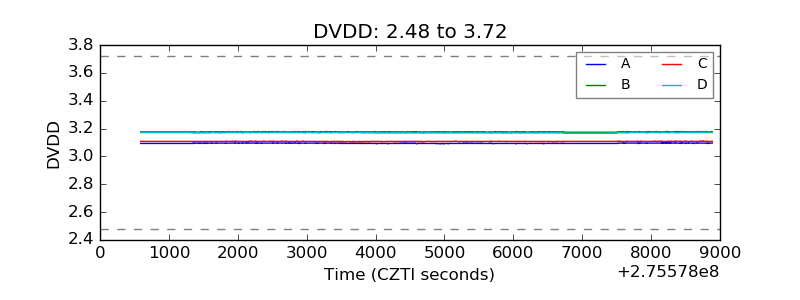 |
| Temperature 1 | 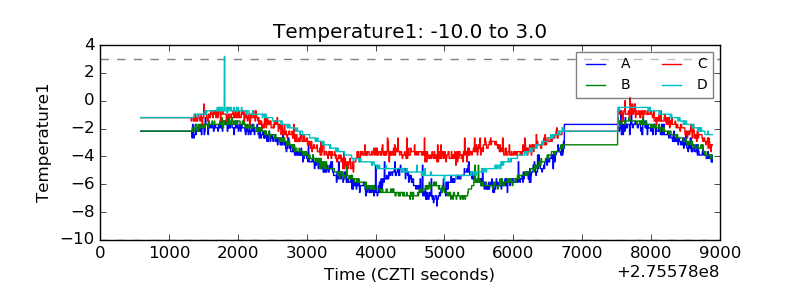 |
| Veto HV Monitor |  |
| Veto LLD | 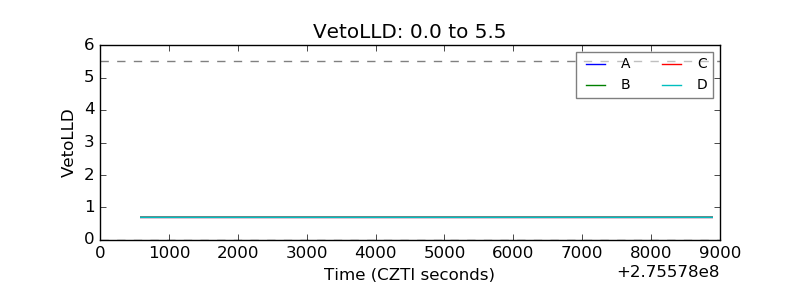 |
| Alpha Counter | 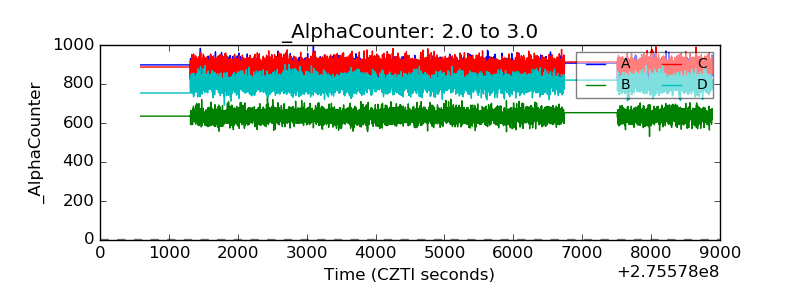 |
| _CPM_Rate | 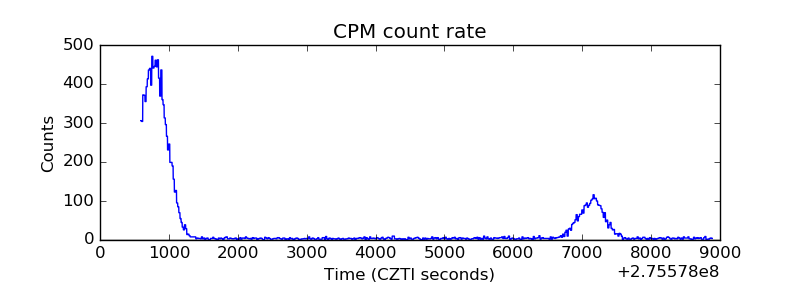 |
| CZT Counter | 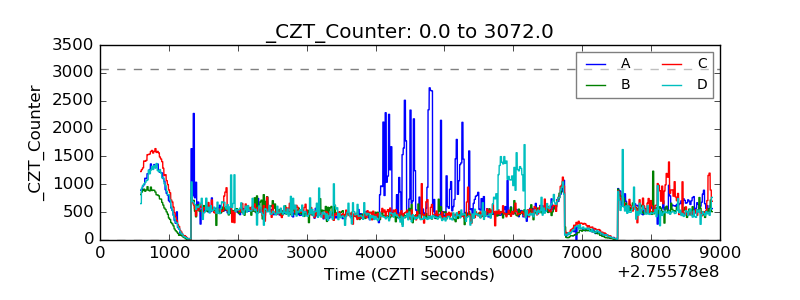 |
| +2.5 Volts monitor | 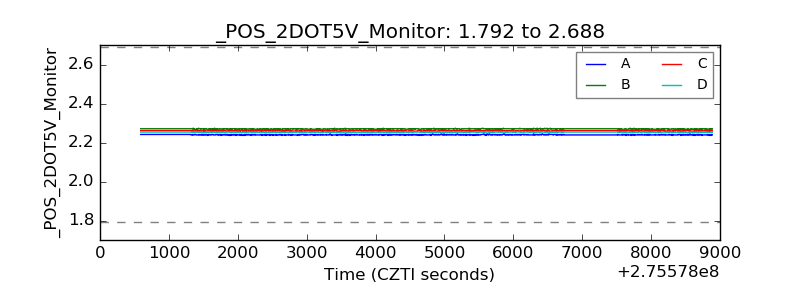 |
| +5 Volts monitor |  |
| _ROLL_ROT | 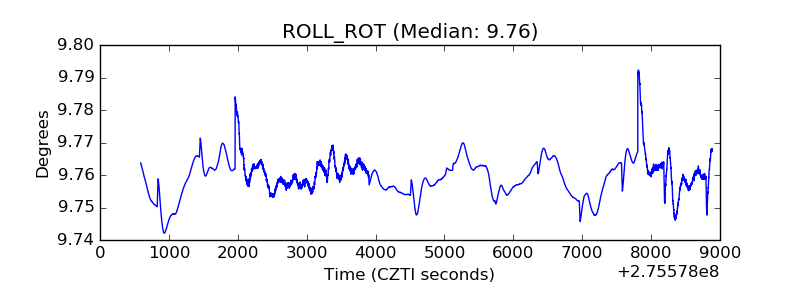 |
| _Roll_DEC | 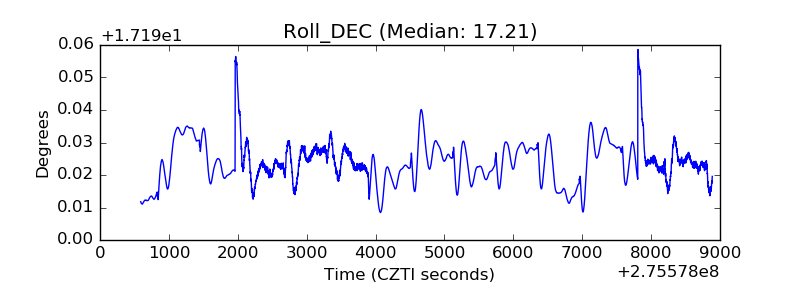 |
| _Roll_RA | 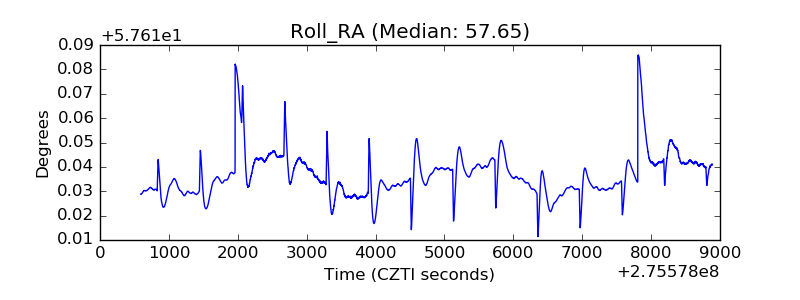 |
| Veto Counter | 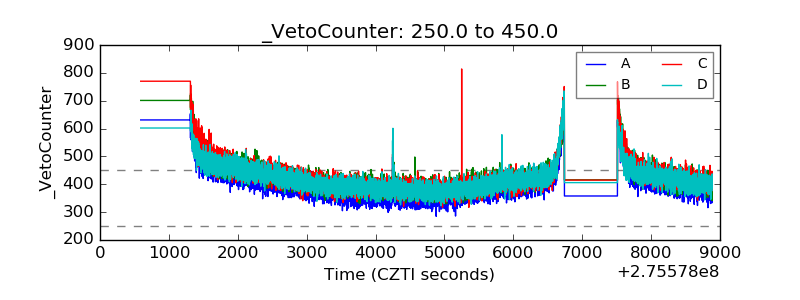 |