| Param | Original file | Final file |
|---|---|---|
| Filename | modeM0/AS1T02_109T01_9000002386_16186cztM0_level2.evt | modeM0/AS1T02_109T01_9000002386_16186cztM0_level2_quad_clean.evt |
| Size (bytes) | 225,656,640 | 32,195,520 |
| Size | 215.2 MB | 30.7 MB |
| Events in quadrant A | 1,485,337 | 196,549 |
| Events in quadrant B | 1,493,027 | 200,555 |
| Events in quadrant C | 1,936,534 | 186,116 |
| Events in quadrant D | 1,723,757 | 188,313 |
| Mode M0 | |||
|---|---|---|---|
| Quadrant | BADHDUFLAG | Total packets | Discarded packets |
| A | 0 | 9546 | 3316 |
| B | 0 | 9271 | 3078 |
| C | 0 | 11868 | 4165 |
| D | 0 | 11778 | 4783 |
| Mode SS | |||
|---|---|---|---|
| Quadrant | BADHDUFLAG | Total packets | Discarded packets |
| A | 0 | 88 | 32 |
| B | 0 | 86 | 30 |
| C | 0 | 88 | 30 |
| D | 0 | 88 | 28 |
| Mode M9 | |||
|---|---|---|---|
| Quadrant | BADHDUFLAG | Total packets | Discarded packets |
| A | 0 | 4 | 0 |
| B | 0 | 4 | 0 |
| C | 0 | 4 | 0 |
| D | 0 | 4 | 0 |
| Quadrant | Total seconds | Saturated seconds | Saturation percentage |
|---|---|---|---|
| A | 2861 | 68 | 2.376791% |
| B | 2883 | 86 | 2.983004% |
| C | 2822 | 139 | 4.925585% |
| D | 2789 | 150 | 5.378272% |
Noise dominated data is calculated using 1-second bins in cleaned event files. If a bin has >2000 counts, and if more than 50% of those come from <1% of pixels, then it is considered to be noise-dominated and hence unusable.
| Quadrant | # 1 sec bins | Bins with >0 counts | Bins with >2000 counts | High rate bins dominated by noise | Noise dominated (total time) | Noise dominated (detector-on time) | Marked lightcurve |
|---|---|---|---|---|---|---|---|
| A | 4595 | 3288 | 0 | 0 | 0.00% | 0.00% | 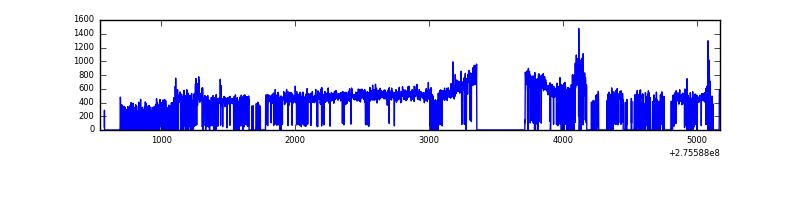 |
| B | 4589 | 3320 | 0 | 0 | 0.00% | 0.00% | 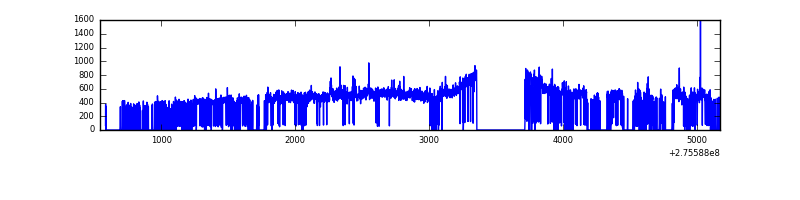 |
| C | 4605 | 3227 | 2 | 2 | 0.04% | 0.06% | 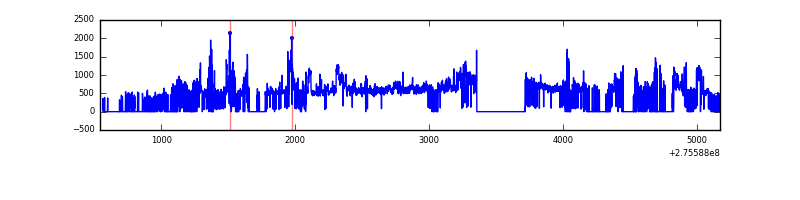 |
| D | 4622 | 3227 | 76 | 76 | 1.64% | 2.36% | 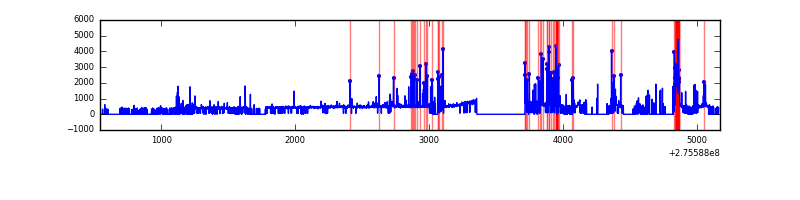 |
Top three noisy pixels from each quadrant. If the there are fewer than three noisy pixels in the level2.evt file, extra rows are filled as -1
| Pixel properties | Quadrant properties | ||||||
|---|---|---|---|---|---|---|---|
| Quadrant | DetID | PixID | Counts | Sigma | Mean | Median | Sigma |
| A | 15 | 174 | 39324 | 510.14 | 369 | 359 | 76.4 |
| A | 8 | 247 | 22080 | 284.38 | 369 | 359 | 76.4 |
| A | 0 | 226 | 3294 | 38.43 | 369 | 359 | 76.4 |
| B | 3 | 64 | 14625 | 194.89 | 370 | 360 | 73.2 |
| B | 0 | 229 | 8870 | 116.26 | 370 | 360 | 73.2 |
| B | 3 | 209 | 8258 | 107.9 | 370 | 360 | 73.2 |
| C | 3 | 233 | 312556 | 3819.62 | 344 | 345 | 81.7 |
| C | 7 | 247 | 198656 | 2426.16 | 344 | 345 | 81.7 |
| C | 14 | 238 | 52392 | 636.75 | 344 | 345 | 81.7 |
| D | 12 | 221 | 343126 | 4026.16 | 341 | 331 | 85.1 |
| D | 1 | 52 | 30840 | 358.33 | 341 | 331 | 85.1 |
| D | 15 | 0 | 27225 | 315.87 | 341 | 331 | 85.1 |
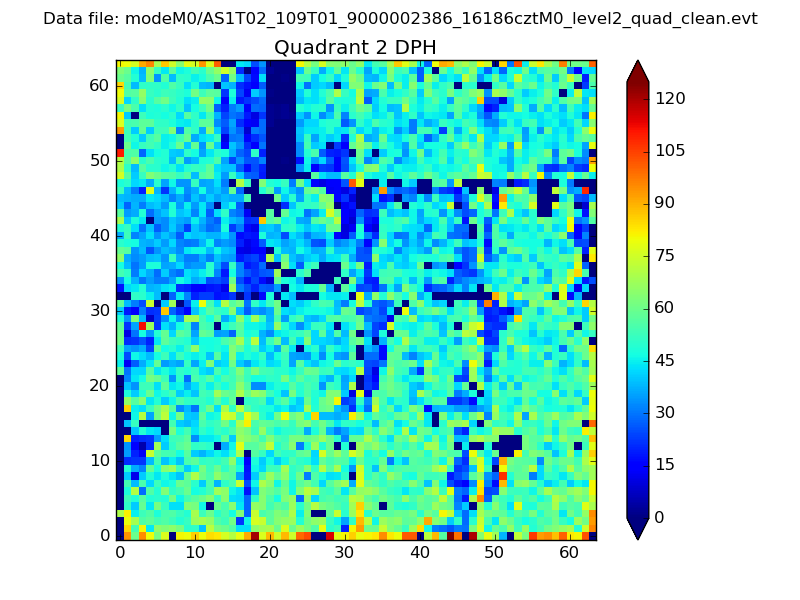
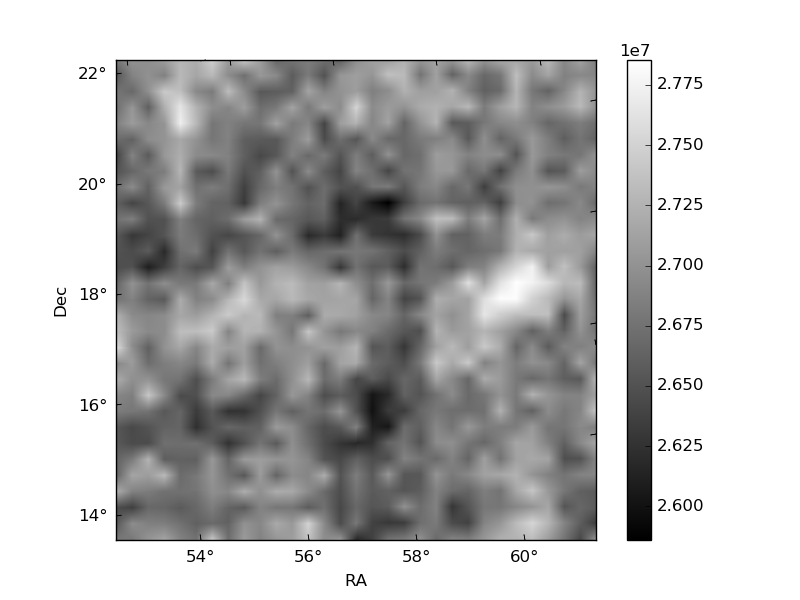
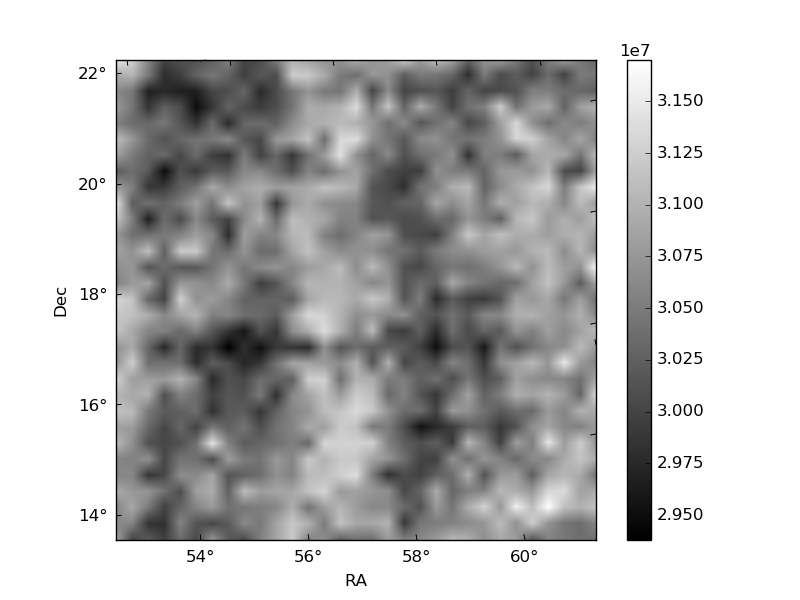
Histogram calculated using DETX and DETY for each event in the final _common_clean file
| Quadrant A | 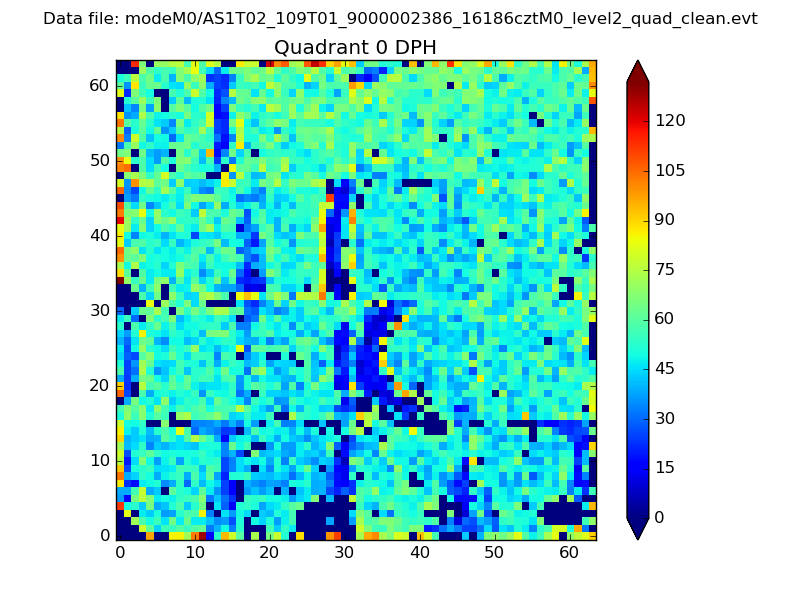 |
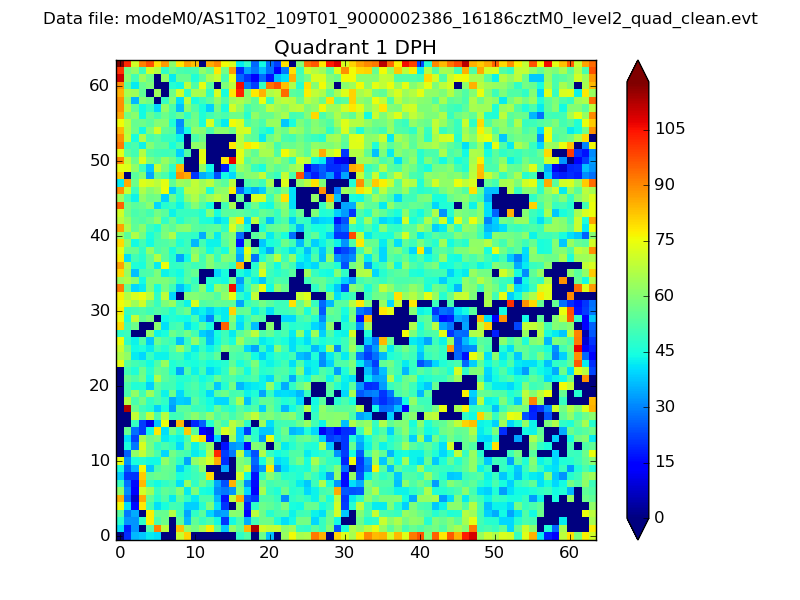 |
Quadrant B |
|---|---|---|---|
| Quadrant D | 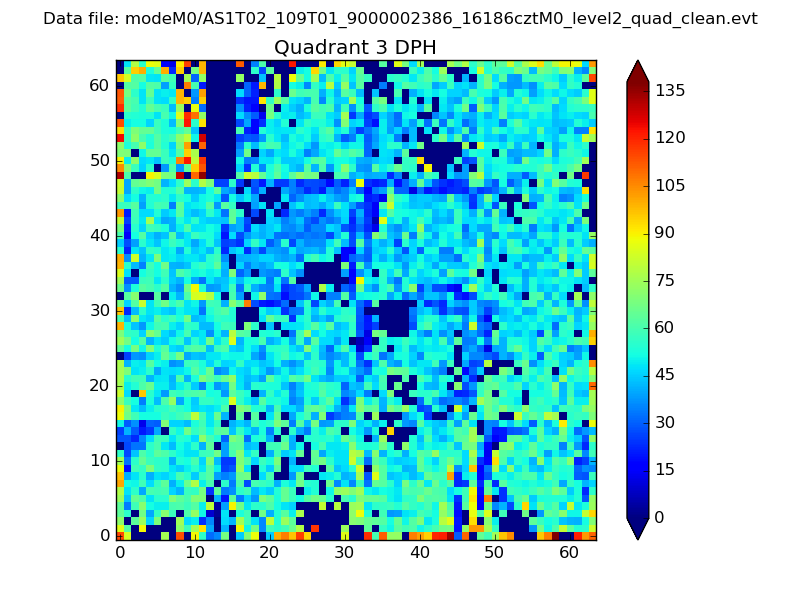 |
 |
Quadrant C |
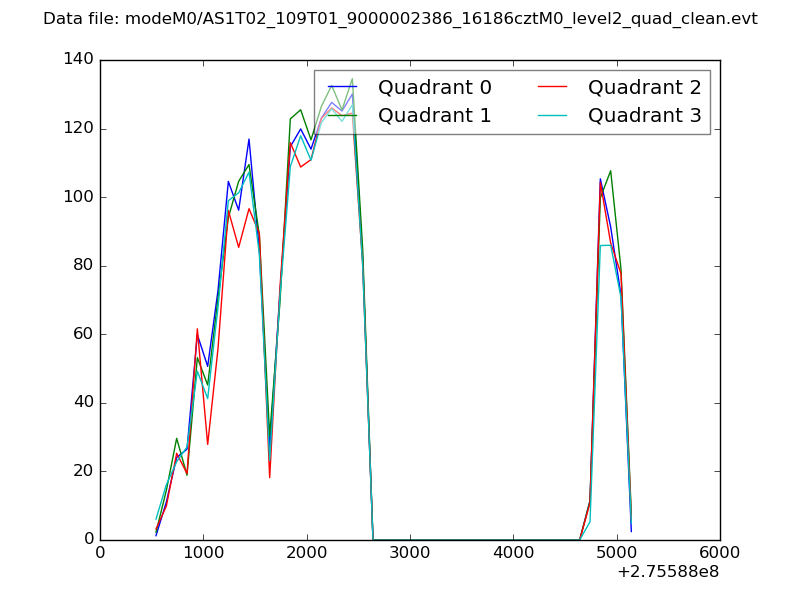
| Plot type | Count rate plots | Images |
|---|---|---|
| Comparison with Poisson distribution Blue bars denote a histogram of data divided into 1 sec bins. Red curve is a Poisson curve with rate = median count rate of data. |
 |
 |
| Quadrant-wise count rates Data is divided into 100 sec bins |
 |
|
| Module-wise count rates for Quadrant A Data is divided into 100 sec bins |
 |
 |
| Module-wise count rates for Quadrant B Data is divided into 100 sec bins |
 |
 |
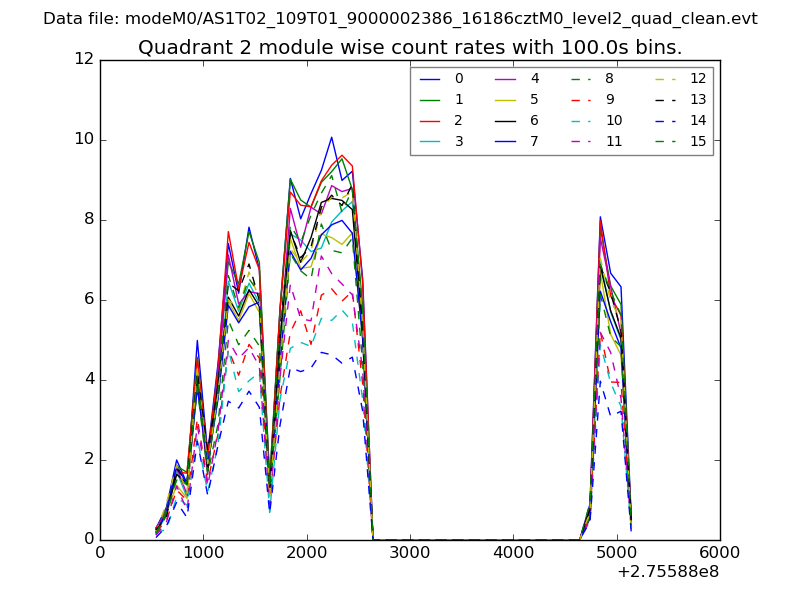
| Module-wise count rates for Quadrant C Data is divided into 100 sec bins |
 |
 |
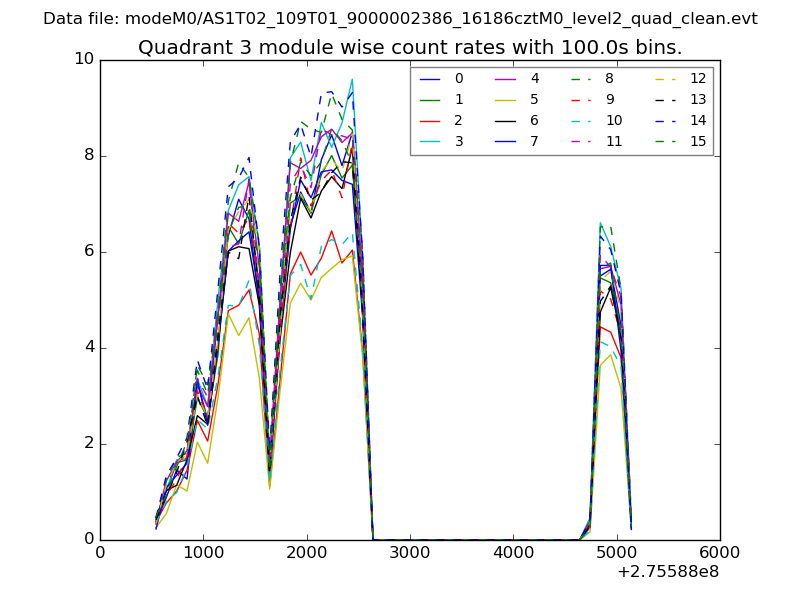
| Module-wise count rates for Quadrant D Data is divided into 100 sec bins |
 |
 |
| Parameter | Plot |
|---|---|
| CZT HV Monitor |  |
| D_VDD | 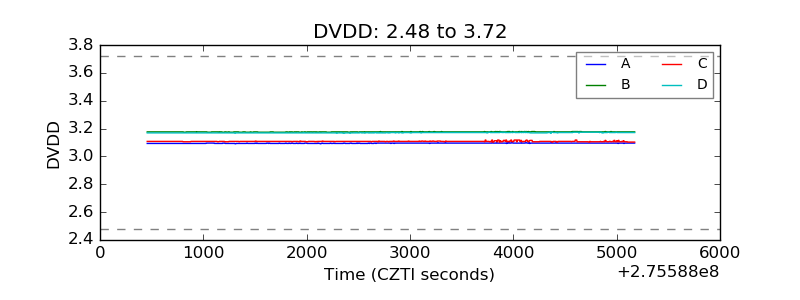 |
| Temperature 1 | 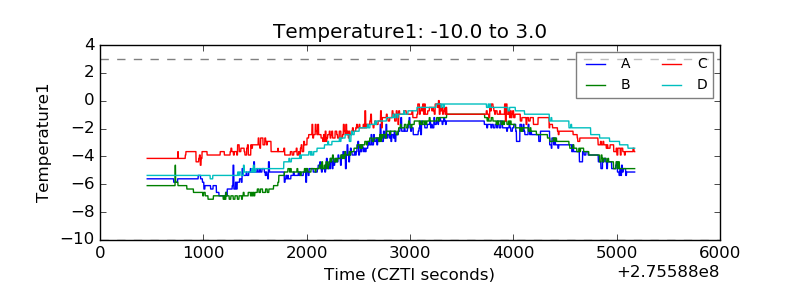 |
| Veto HV Monitor | 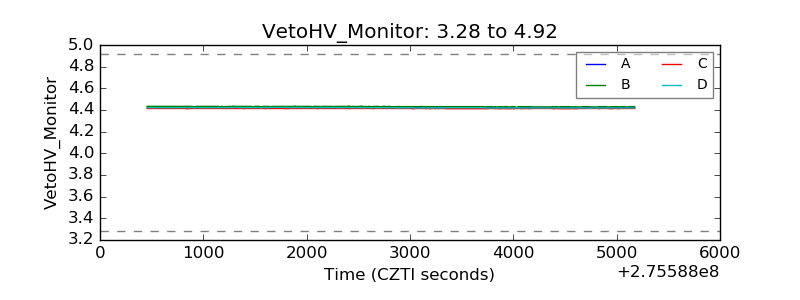 |
| Veto LLD | 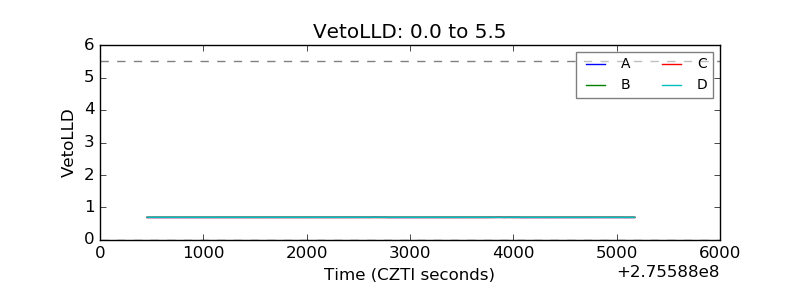 |
| Alpha Counter | 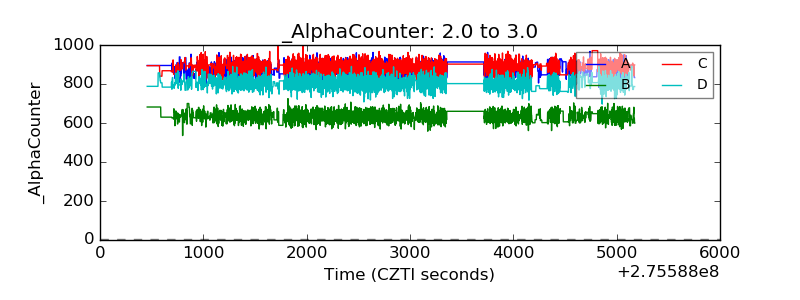 |
| _CPM_Rate | 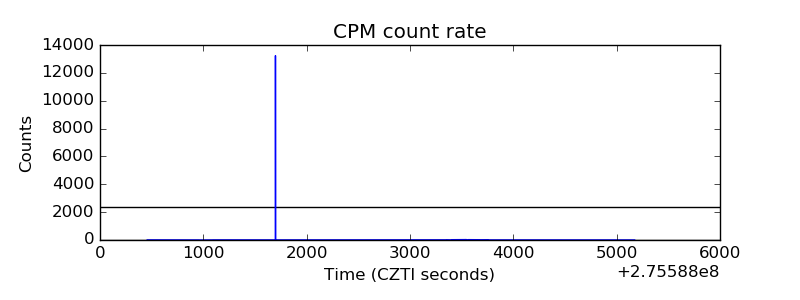 |
| CZT Counter | 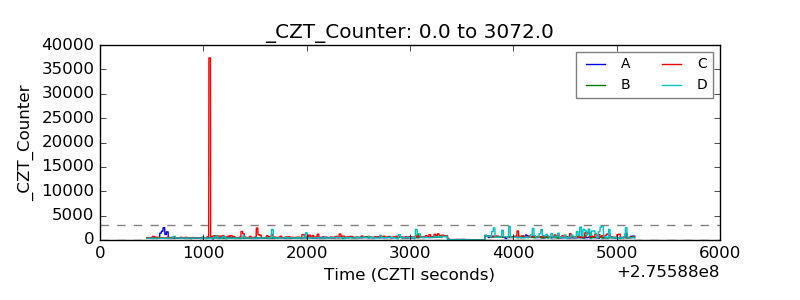 |
| +2.5 Volts monitor |  |
| +5 Volts monitor |  |
| _ROLL_ROT | 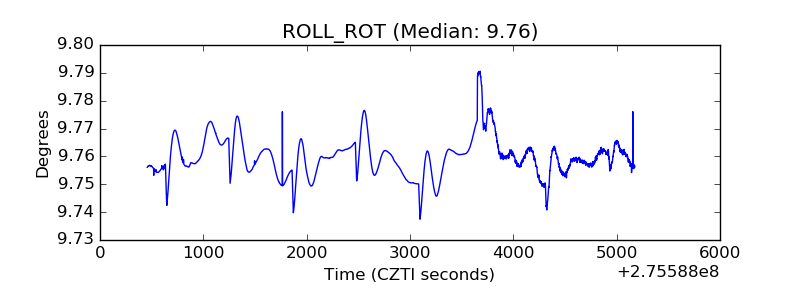 |
| _Roll_DEC | 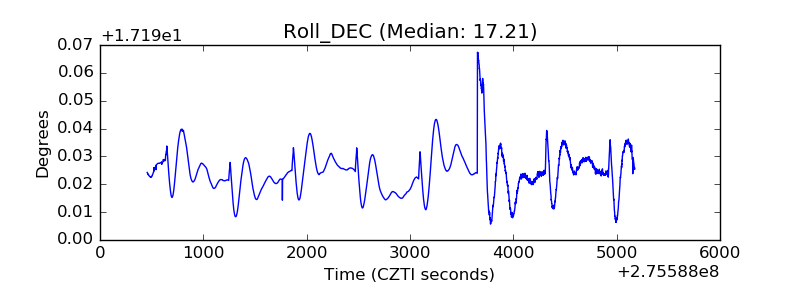 |
| _Roll_RA | 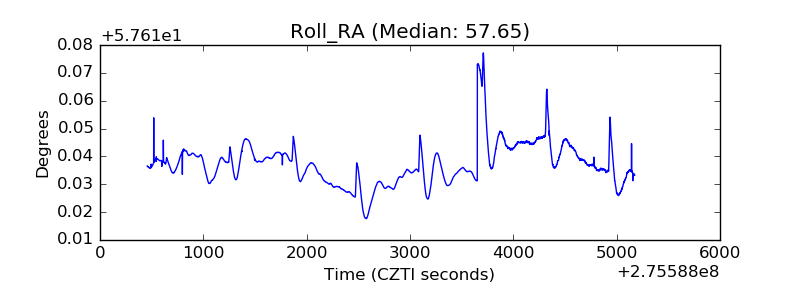 |
| Veto Counter | 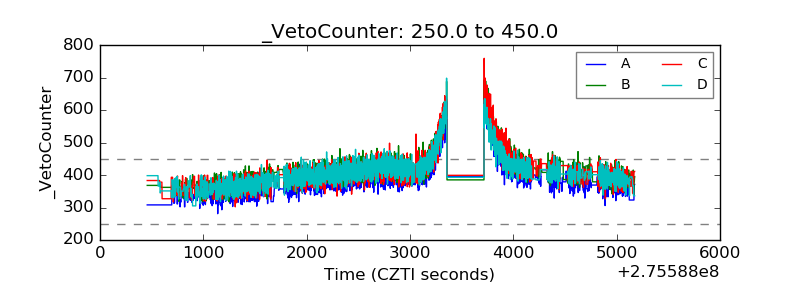 |