| Param | Original file | Final file |
|---|---|---|
| Filename | modeM0/AS1T02_109T01_9000002386_16188cztM0_level2.evt | modeM0/AS1T02_109T01_9000002386_16188cztM0_level2_quad_clean.evt |
| Size (bytes) | 542,790,720 | 96,301,440 |
| Size | 517.6 MB | 91.8 MB |
| Events in quadrant A | 3,879,564 | 606,858 |
| Events in quadrant B | 3,781,562 | 615,984 |
| Events in quadrant C | 4,212,489 | 590,971 |
| Events in quadrant D | 4,053,110 | 578,146 |
| Mode M0 | |||
|---|---|---|---|
| Quadrant | BADHDUFLAG | Total packets | Discarded packets |
| A | 0 | 16685 | 3 |
| B | 0 | 16221 | 2 |
| C | 0 | 17338 | 2 |
| D | 0 | 17371 | 2 |
| Mode SS | |||
|---|---|---|---|
| Quadrant | BADHDUFLAG | Total packets | Discarded packets |
| A | 0 | 152 | 0 |
| B | 0 | 152 | 0 |
| C | 0 | 152 | 0 |
| D | 0 | 152 | 0 |
| Mode M9 | |||
|---|---|---|---|
| Quadrant | BADHDUFLAG | Total packets | Discarded packets |
| A | 0 | 8 | 0 |
| B | 0 | 8 | 0 |
| C | 0 | 8 | 0 |
| D | 0 | 8 | 0 |
| Quadrant | Total seconds | Saturated seconds | Saturation percentage |
|---|---|---|---|
| A | 7546 | 186 | 2.464882% |
| B | 7546 | 124 | 1.643255% |
| C | 7546 | 255 | 3.379274% |
| D | 7546 | 237 | 3.140737% |
Noise dominated data is calculated using 1-second bins in cleaned event files. If a bin has >2000 counts, and if more than 50% of those come from <1% of pixels, then it is considered to be noise-dominated and hence unusable.
| Quadrant | # 1 sec bins | Bins with >0 counts | Bins with >2000 counts | High rate bins dominated by noise | Noise dominated (total time) | Noise dominated (detector-on time) | Marked lightcurve |
|---|---|---|---|---|---|---|---|
| A | 8242 | 7549 | 58 | 58 | 0.70% | 0.77% | 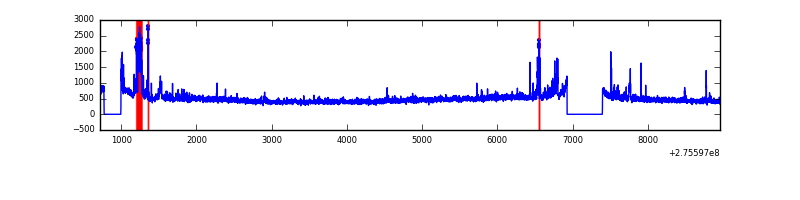 |
| B | 8242 | 7549 | 2 | 2 | 0.02% | 0.03% | 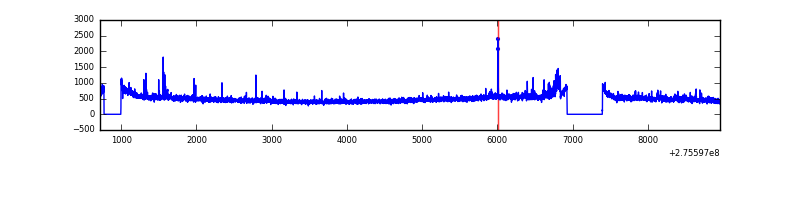 |
| C | 8242 | 7549 | 52 | 52 | 0.63% | 0.69% | 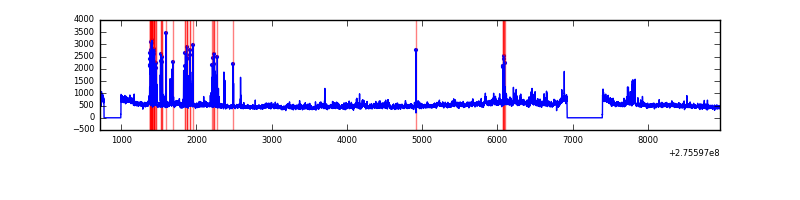 |
| D | 8242 | 7549 | 182 | 182 | 2.21% | 2.41% | 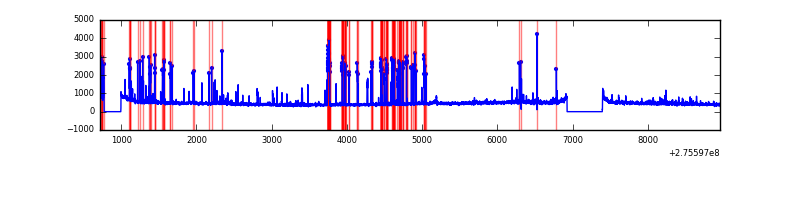 |
Top three noisy pixels from each quadrant. If the there are fewer than three noisy pixels in the level2.evt file, extra rows are filled as -1
| Pixel properties | Quadrant properties | ||||||
|---|---|---|---|---|---|---|---|
| Quadrant | DetID | PixID | Counts | Sigma | Mean | Median | Sigma |
| A | 15 | 174 | 317247 | 1711.31 | 907 | 888 | 184.9 |
| A | 8 | 247 | 34587 | 182.29 | 907 | 888 | 184.9 |
| A | 3 | 1 | 20916 | 108.34 | 907 | 888 | 184.9 |
| B | 4 | 216 | 53695 | 299.15 | 916 | 891 | 176.5 |
| B | 3 | 209 | 50193 | 279.31 | 916 | 891 | 176.5 |
| B | 0 | 189 | 25292 | 138.24 | 916 | 891 | 176.5 |
| C | 7 | 247 | 362795 | 1767.88 | 871 | 878 | 204.7 |
| C | 3 | 233 | 232030 | 1129.12 | 871 | 878 | 204.7 |
| C | 14 | 238 | 132546 | 643.17 | 871 | 878 | 204.7 |
| D | 12 | 221 | 499864 | 2285.56 | 878 | 851 | 218.3 |
| D | 10 | 70 | 101277 | 459.97 | 878 | 851 | 218.3 |
| D | 1 | 52 | 54212 | 244.4 | 878 | 851 | 218.3 |
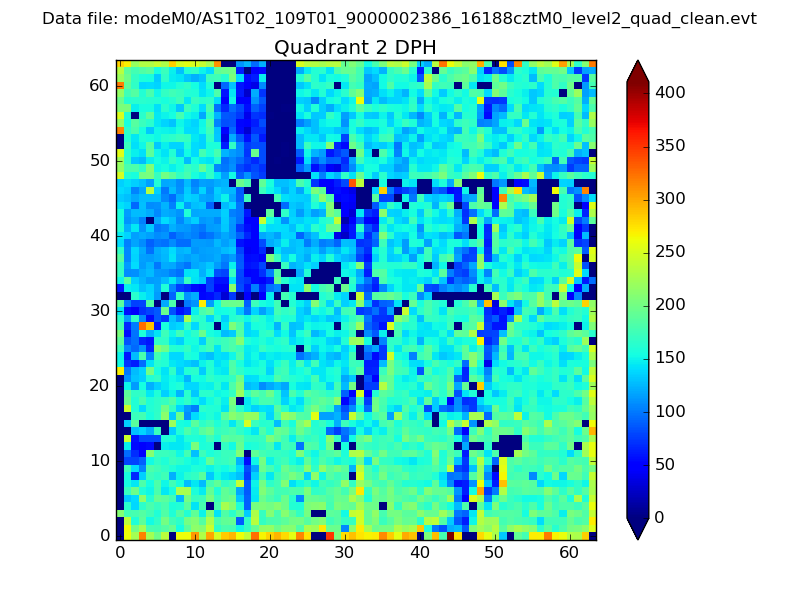
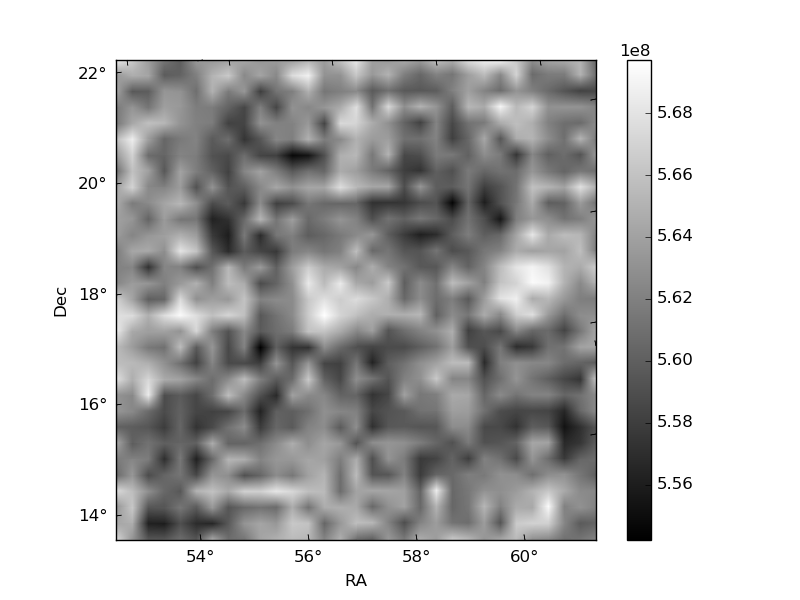
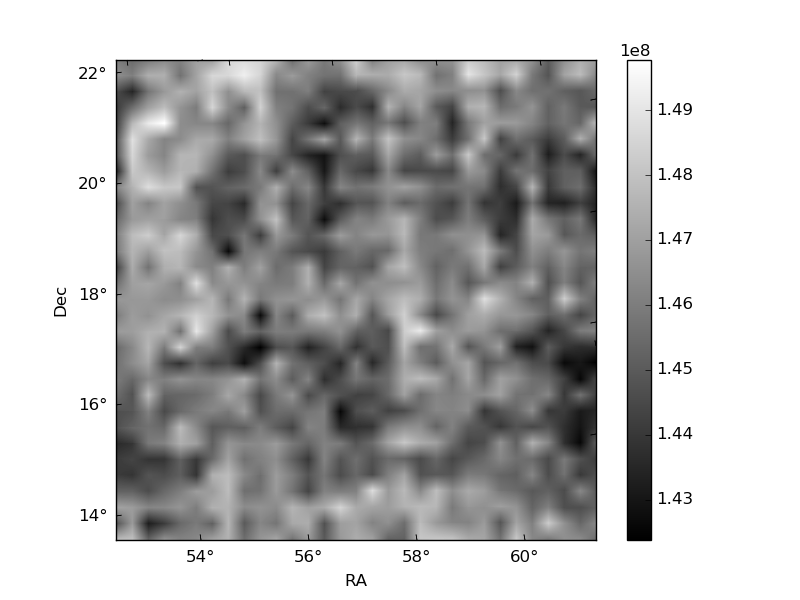
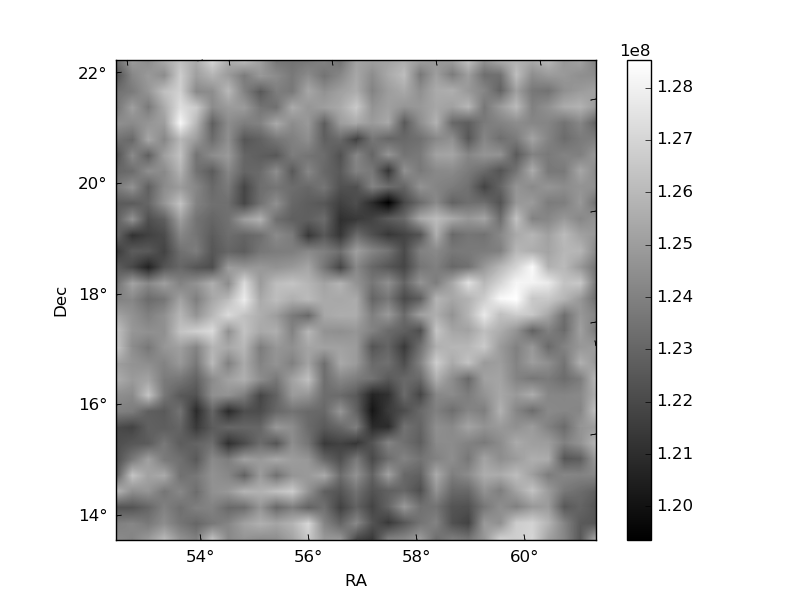
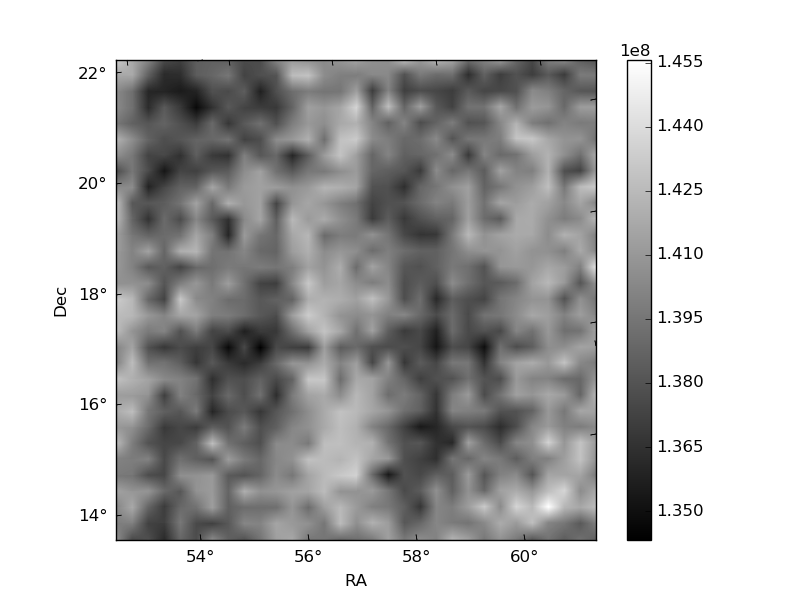
Histogram calculated using DETX and DETY for each event in the final _common_clean file
| Quadrant A | 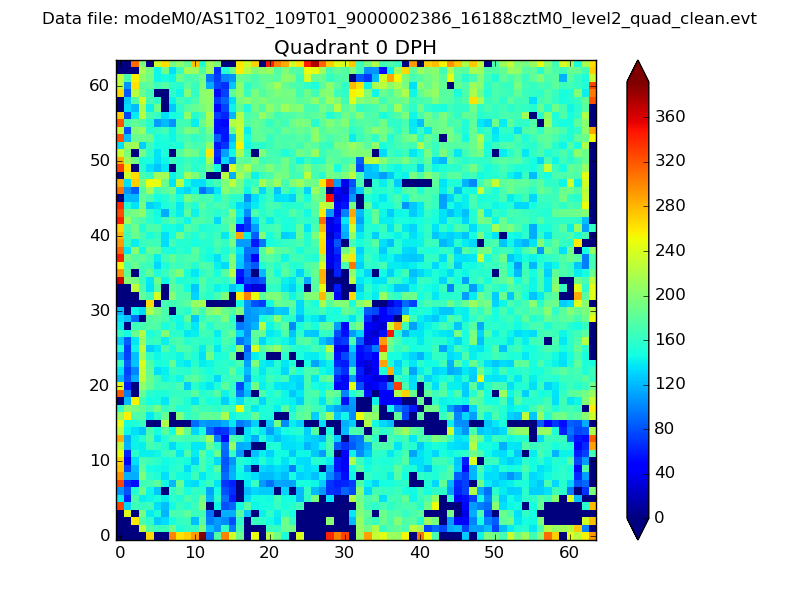 |
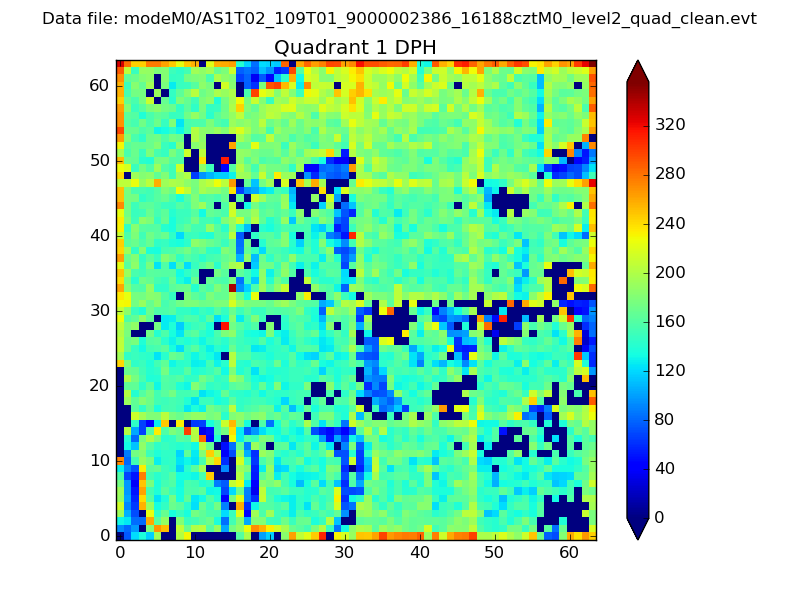 |
Quadrant B |
|---|---|---|---|
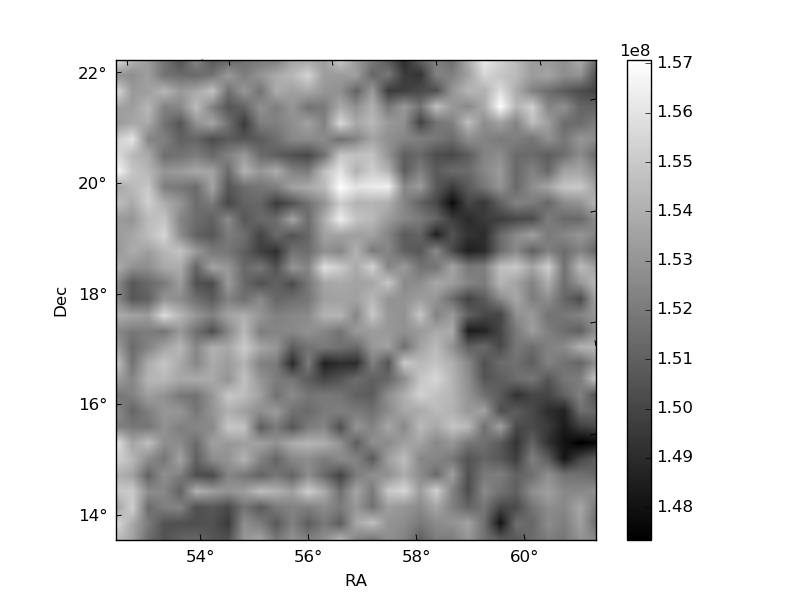
| Quadrant D | 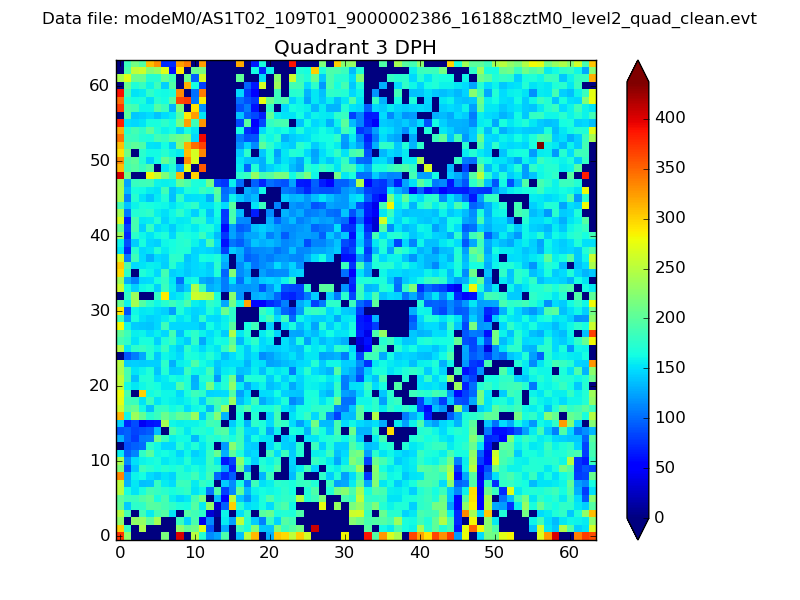 |
 |
Quadrant C |
| Plot type | Count rate plots | Images |
|---|---|---|
| Comparison with Poisson distribution Blue bars denote a histogram of data divided into 1 sec bins. Red curve is a Poisson curve with rate = median count rate of data. |
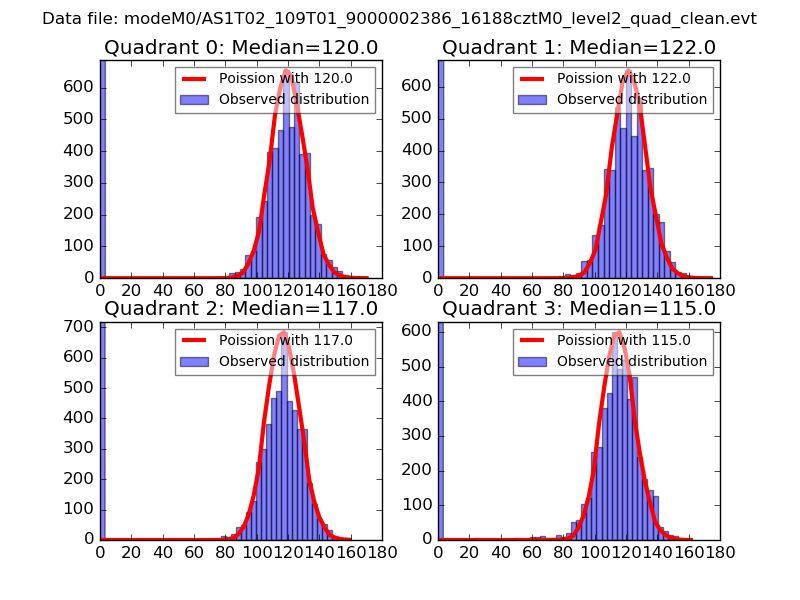 |
 |
| Quadrant-wise count rates Data is divided into 100 sec bins |
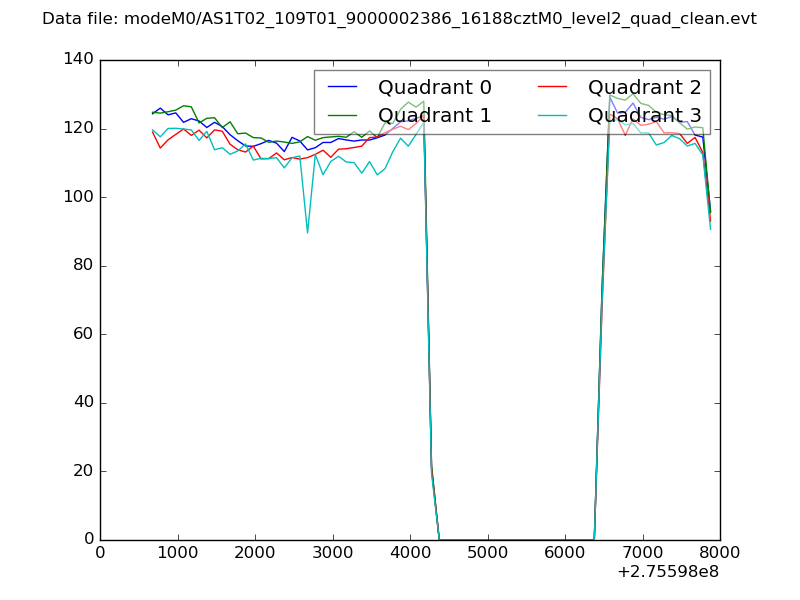 |
|
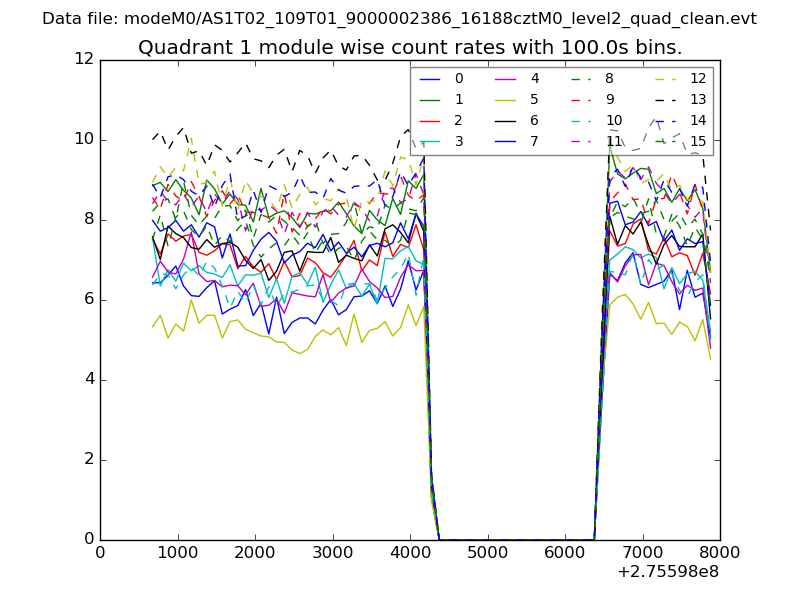
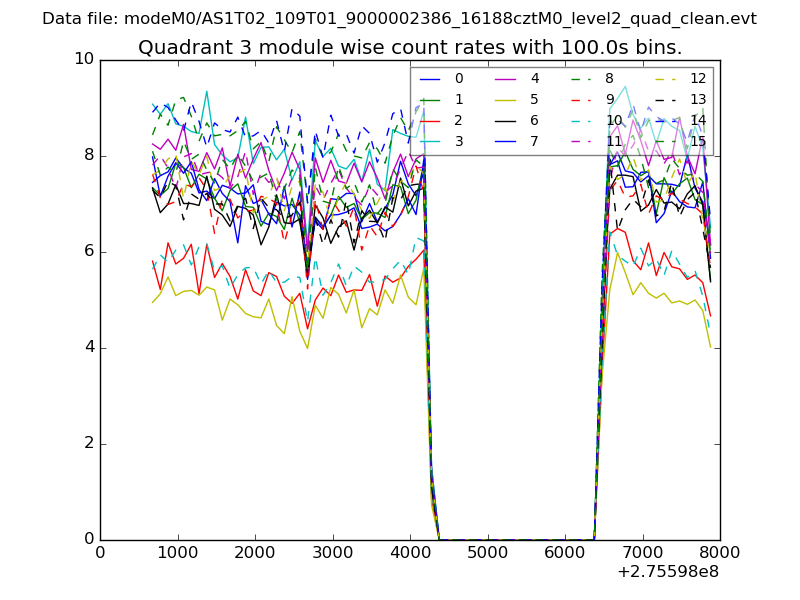
| Module-wise count rates for Quadrant A Data is divided into 100 sec bins |
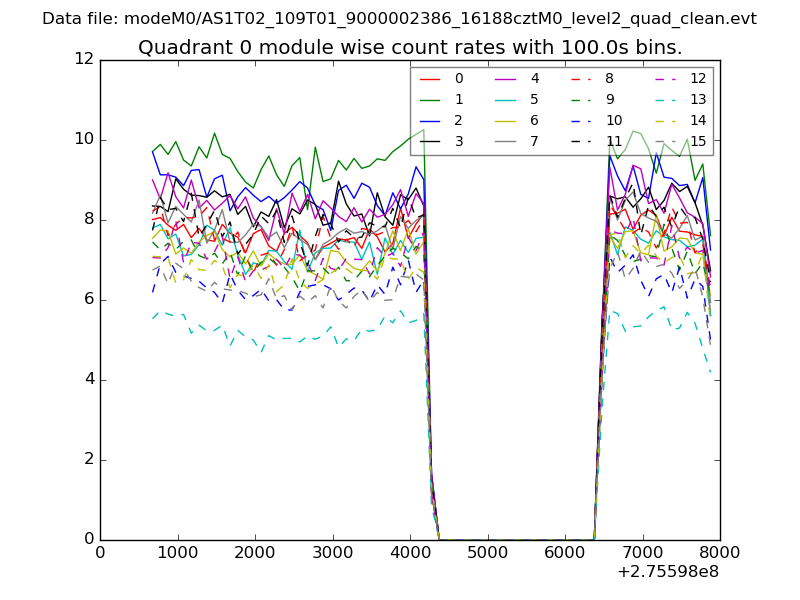 |
 |
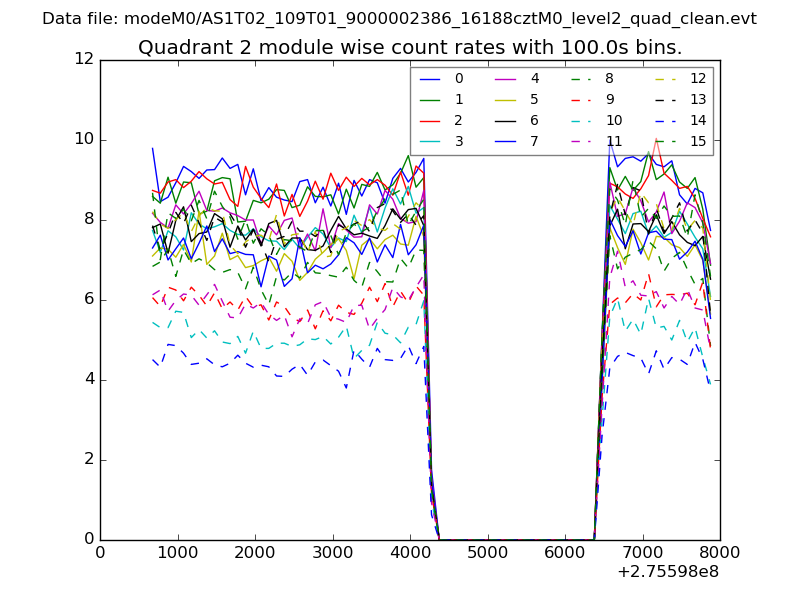
| Module-wise count rates for Quadrant B Data is divided into 100 sec bins |
 |
 |
| Module-wise count rates for Quadrant C Data is divided into 100 sec bins |
 |
 |
| Module-wise count rates for Quadrant D Data is divided into 100 sec bins |
 |
 |
| Parameter | Plot |
|---|---|
| CZT HV Monitor | 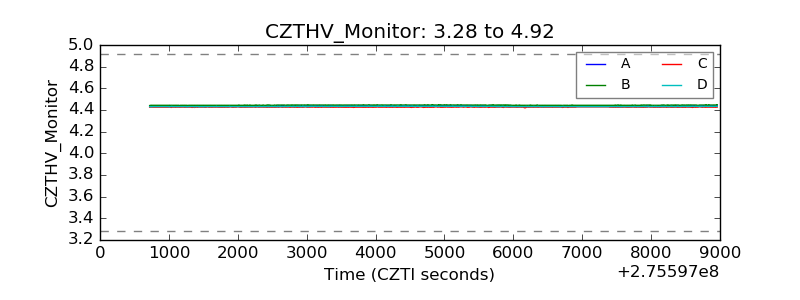 |
| D_VDD | 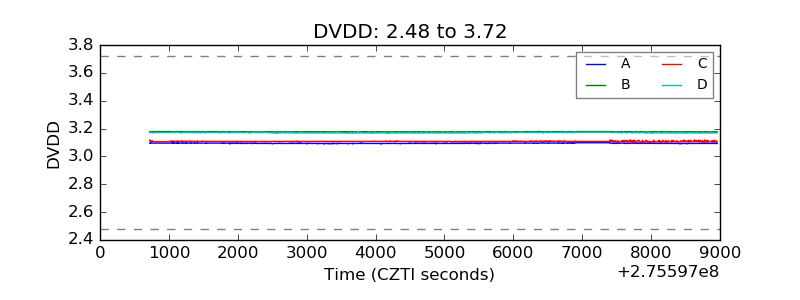 |
| Temperature 1 | 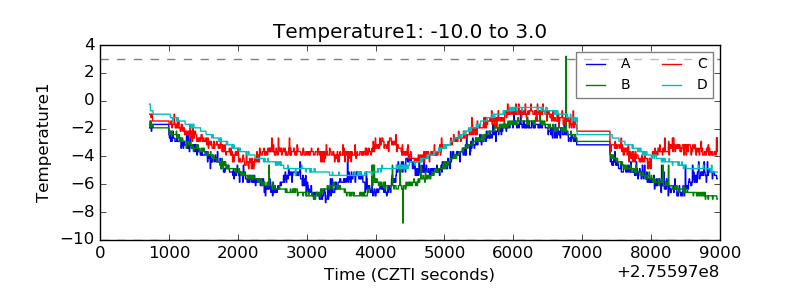 |
| Veto HV Monitor | 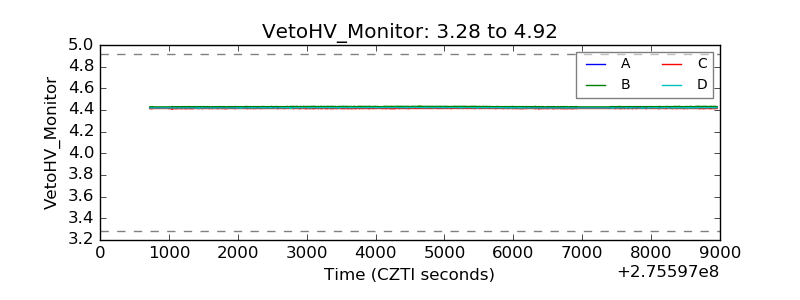 |
| Veto LLD | 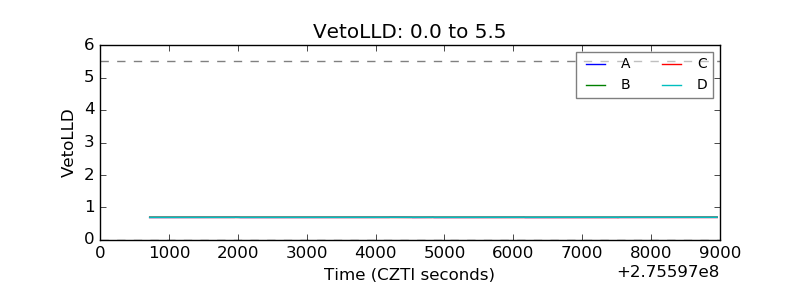 |
| Alpha Counter | 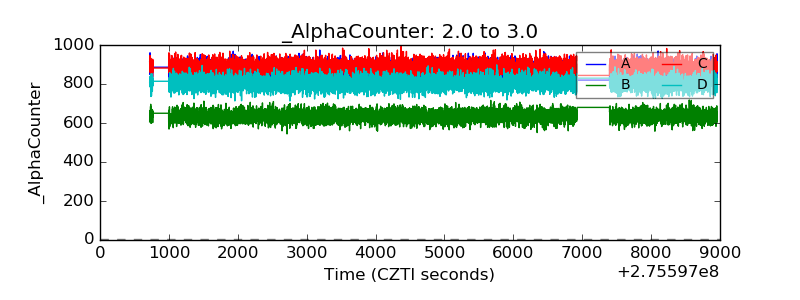 |
| _CPM_Rate | 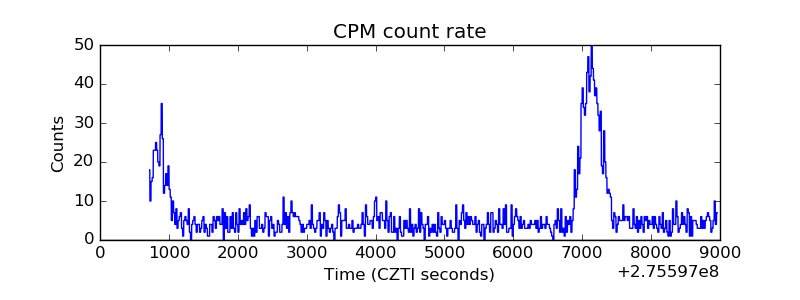 |
| CZT Counter | 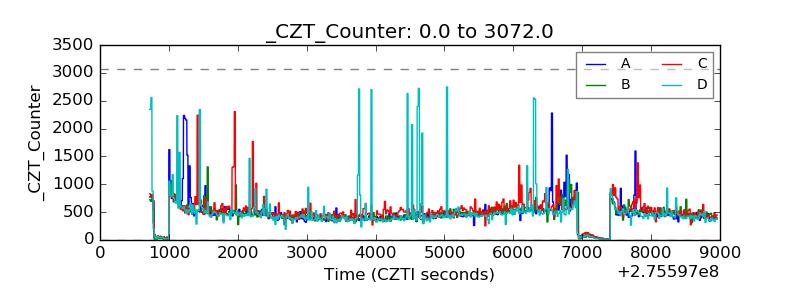 |
| +2.5 Volts monitor |  |
| +5 Volts monitor |  |
| _ROLL_ROT | 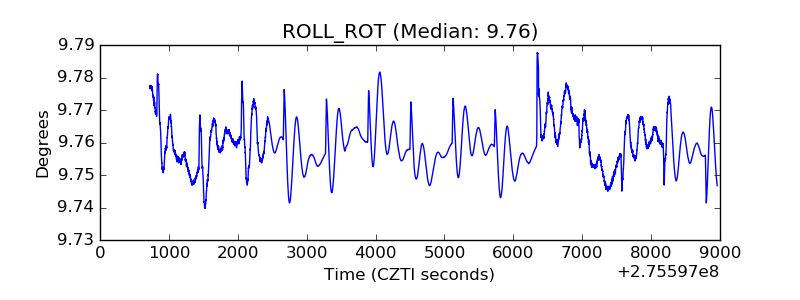 |
| _Roll_DEC |  |
| _Roll_RA | 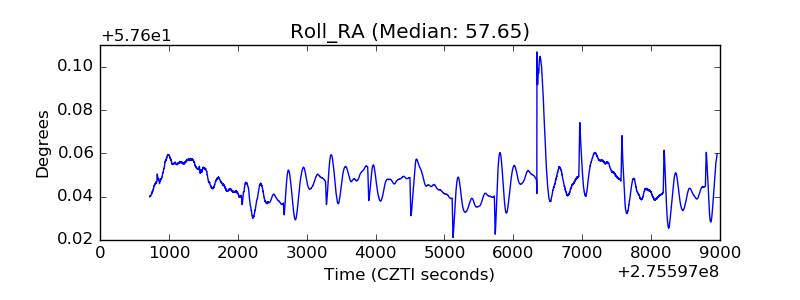 |
| Veto Counter | 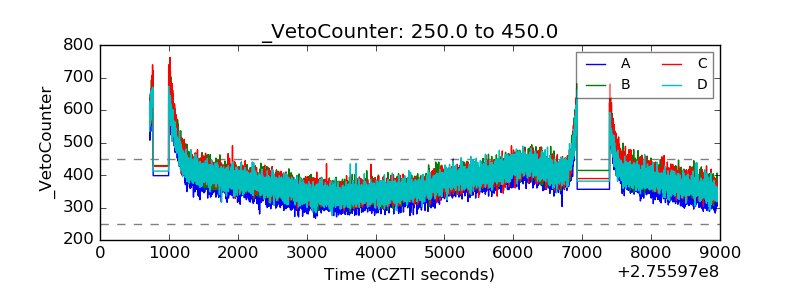 |