| Param | Original file | Final file |
|---|---|---|
| Filename | modeM0/AS1T02_109T01_9000002386_16192cztM0_level2.evt | modeM0/AS1T02_109T01_9000002386_16192cztM0_level2_quad_clean.evt |
| Size (bytes) | 2,649,888,000 | 454,579,200 |
| Size | 2.5 GB | 433.5 MB |
| Events in quadrant A | 18,658,882 | 2,811,988 |
| Events in quadrant B | 18,449,649 | 2,886,547 |
| Events in quadrant C | 20,978,556 | 2,761,527 |
| Events in quadrant D | 19,611,721 | 2,711,577 |
| Mode M0 | |||
|---|---|---|---|
| Quadrant | BADHDUFLAG | Total packets | Discarded packets |
| A | 0 | 88570 | 7327 |
| B | 0 | 84612 | 5005 |
| C | 0 | 91622 | 4646 |
| D | 0 | 91392 | 5738 |
| Mode SS | |||
|---|---|---|---|
| Quadrant | BADHDUFLAG | Total packets | Discarded packets |
| A | 0 | 815 | 52 |
| B | 0 | 814 | 52 |
| C | 0 | 813 | 52 |
| D | 0 | 815 | 45 |
| Mode M9 | |||
|---|---|---|---|
| Quadrant | BADHDUFLAG | Total packets | Discarded packets |
| A | 0 | 44 | 8 |
| B | 0 | 45 | 11 |
| C | 0 | 44 | 10 |
| D | 0 | 44 | 8 |
| Quadrant | Total seconds | Saturated seconds | Saturation percentage |
|---|---|---|---|
| A | 37788 | 426 | 1.127342% |
| B | 37826 | 389 | 1.028393% |
| C | 37861 | 990 | 2.614828% |
| D | 37813 | 870 | 2.300796% |
Noise dominated data is calculated using 1-second bins in cleaned event files. If a bin has >2000 counts, and if more than 50% of those come from <1% of pixels, then it is considered to be noise-dominated and hence unusable.
| Quadrant | # 1 sec bins | Bins with >0 counts | Bins with >2000 counts | High rate bins dominated by noise | Noise dominated (total time) | Noise dominated (detector-on time) | Marked lightcurve |
|---|---|---|---|---|---|---|---|
| A | 44426 | 38221 | 81 | 81 | 0.18% | 0.21% | 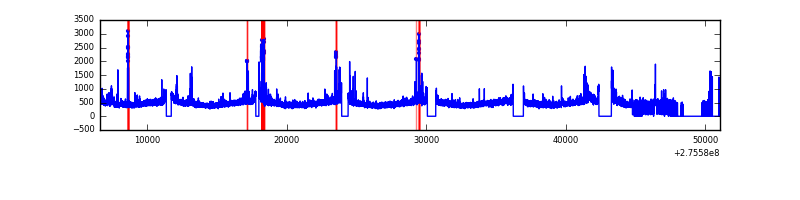 |
| B | 44464 | 38278 | 3 | 3 | 0.01% | 0.01% | 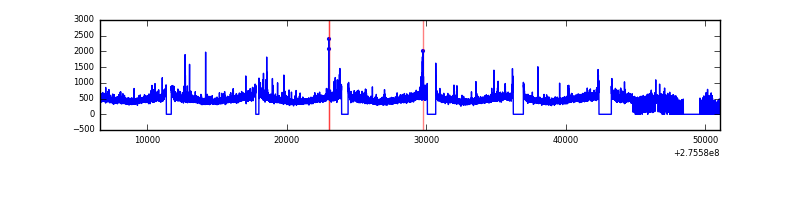 |
| C | 44461 | 38332 | 258 | 258 | 0.58% | 0.67% | 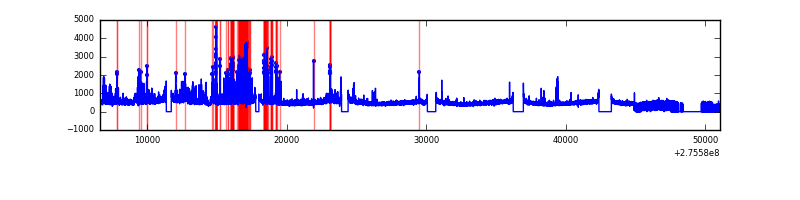 |
| D | 44463 | 38264 | 607 | 607 | 1.37% | 1.59% | 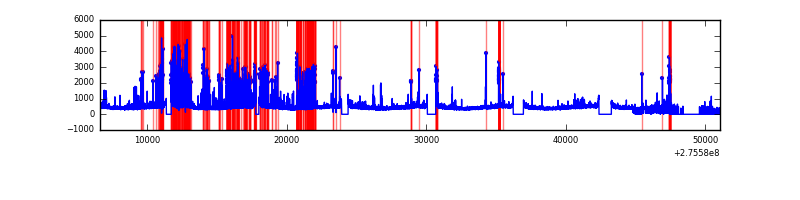 |
Top three noisy pixels from each quadrant. If the there are fewer than three noisy pixels in the level2.evt file, extra rows are filled as -1
| Pixel properties | Quadrant properties | ||||||
|---|---|---|---|---|---|---|---|
| Quadrant | DetID | PixID | Counts | Sigma | Mean | Median | Sigma |
| A | 15 | 174 | 651710 | 718.79 | 4484 | 4385 | 900.6 |
| A | 8 | 247 | 533261 | 587.26 | 4484 | 4385 | 900.6 |
| A | 15 | 157 | 197524 | 214.46 | 4484 | 4385 | 900.6 |
| B | 0 | 229 | 217805 | 248.3 | 4509 | 4390 | 859.5 |
| B | 4 | 216 | 169078 | 191.61 | 4509 | 4390 | 859.5 |
| B | 3 | 209 | 139028 | 156.65 | 4509 | 4390 | 859.5 |
| C | 3 | 233 | 2136569 | 2130.13 | 4288 | 4316 | 1001.0 |
| C | 7 | 247 | 1268638 | 1263.06 | 4288 | 4316 | 1001.0 |
| C | 14 | 238 | 664719 | 659.75 | 4288 | 4316 | 1001.0 |
| D | 12 | 221 | 2039506 | 1939.29 | 4329 | 4208 | 1049.5 |
| D | 1 | 52 | 308555 | 289.99 | 4329 | 4208 | 1049.5 |
| D | 7 | 38 | 308514 | 289.95 | 4329 | 4208 | 1049.5 |
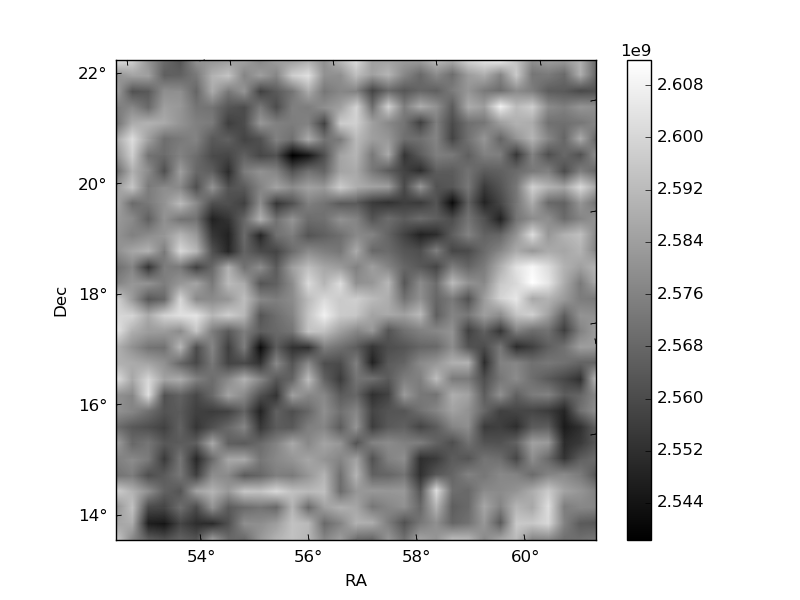
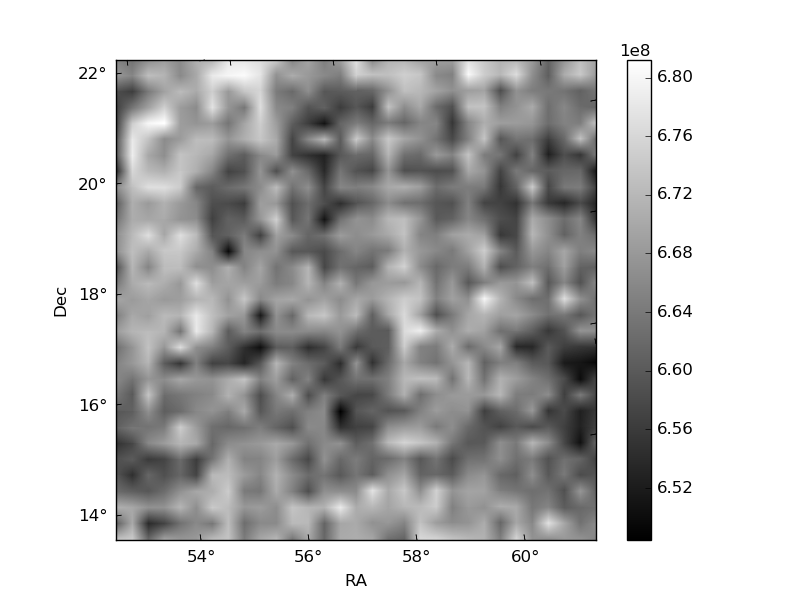
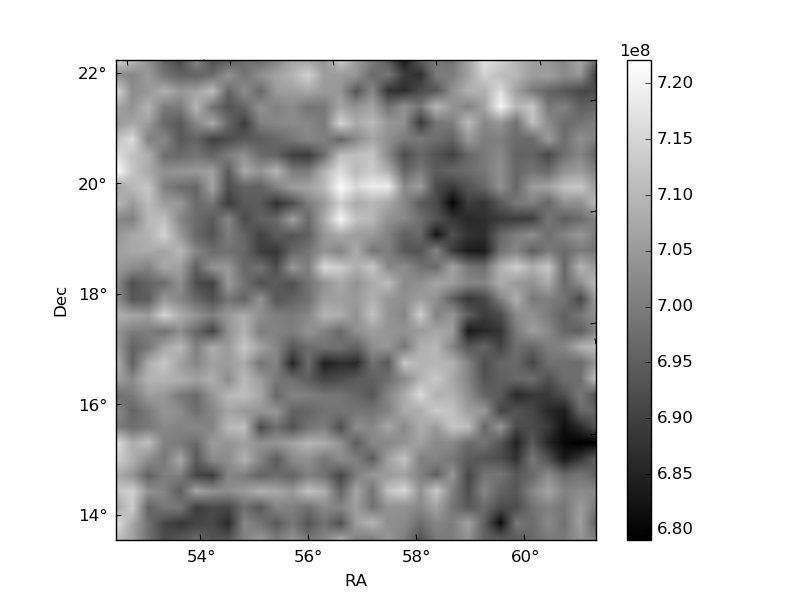
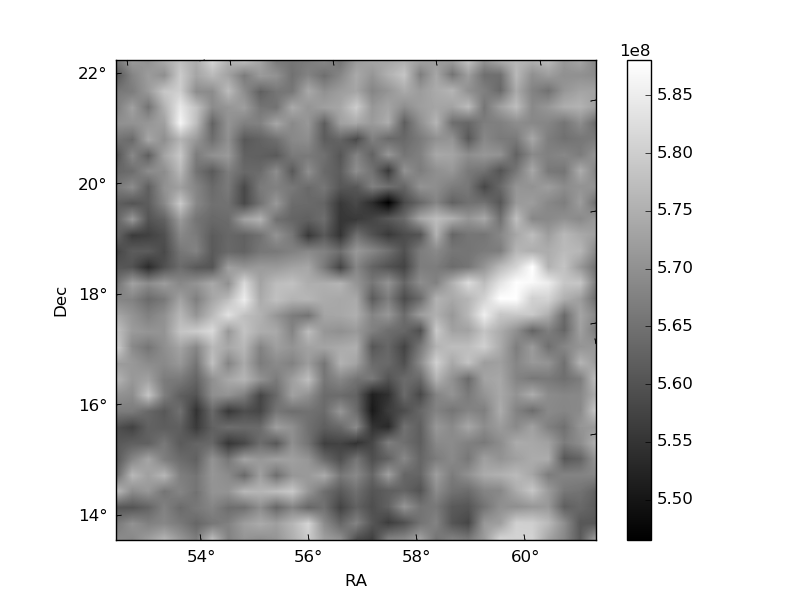
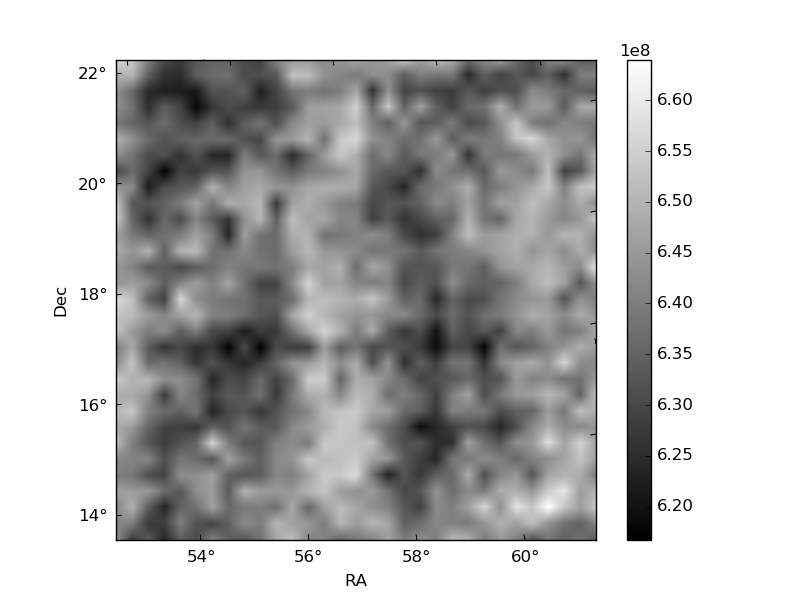
Histogram calculated using DETX and DETY for each event in the final _common_clean file
| Quadrant A | 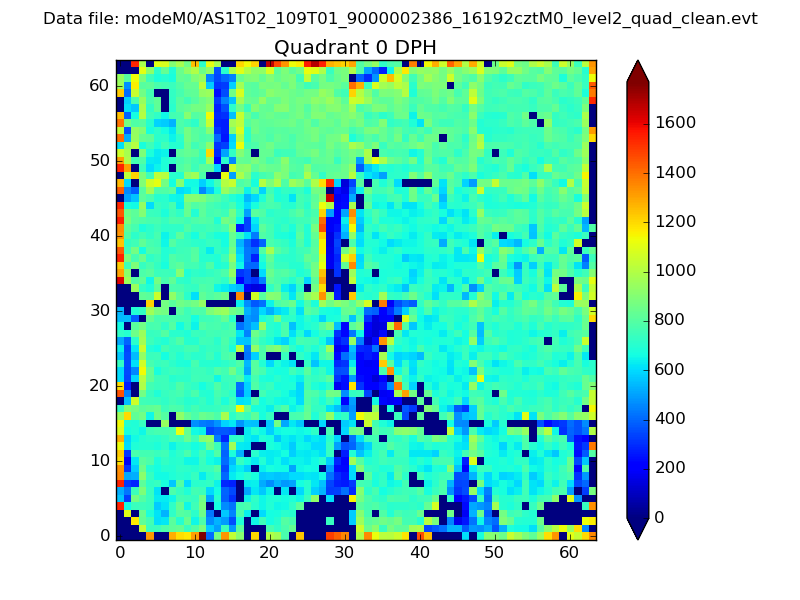 |
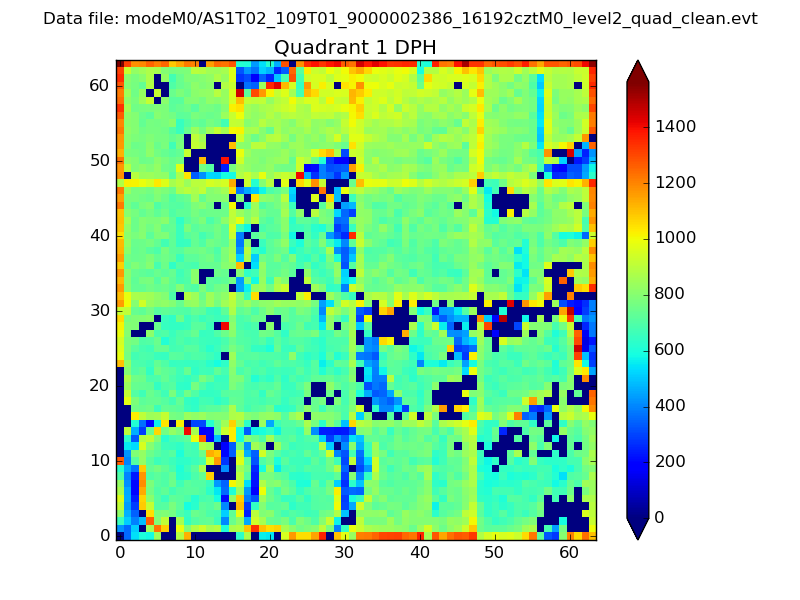 |
Quadrant B |
|---|---|---|---|
| Quadrant D | 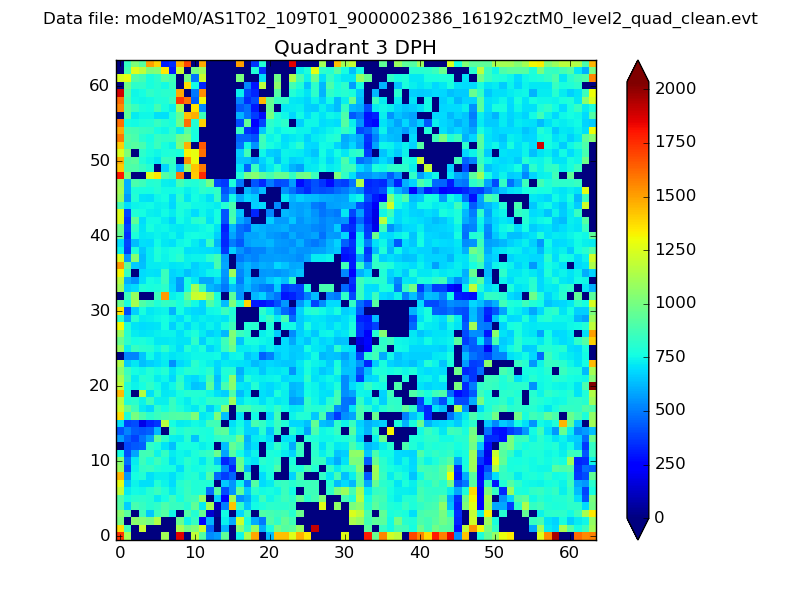 |
 |
Quadrant C |
| Plot type | Count rate plots | Images |
|---|---|---|
| Comparison with Poisson distribution Blue bars denote a histogram of data divided into 1 sec bins. Red curve is a Poisson curve with rate = median count rate of data. |
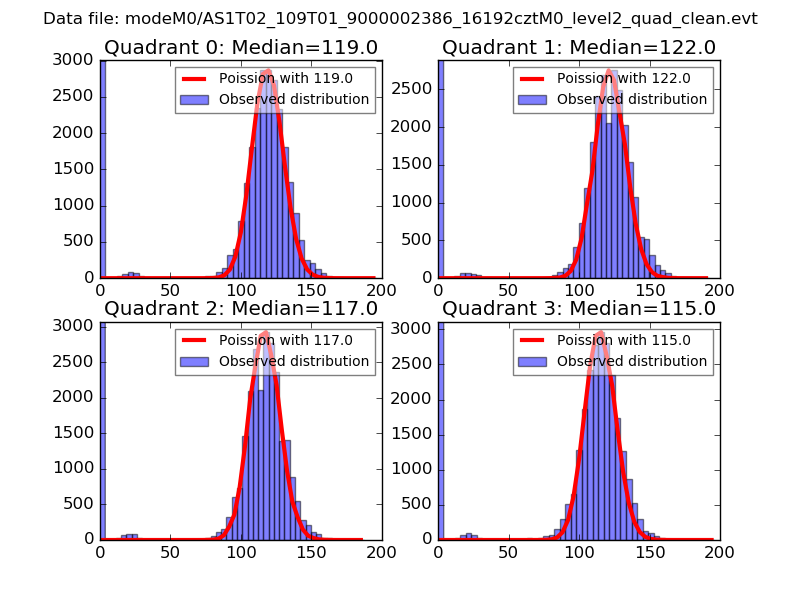 |
 |
| Quadrant-wise count rates Data is divided into 100 sec bins |
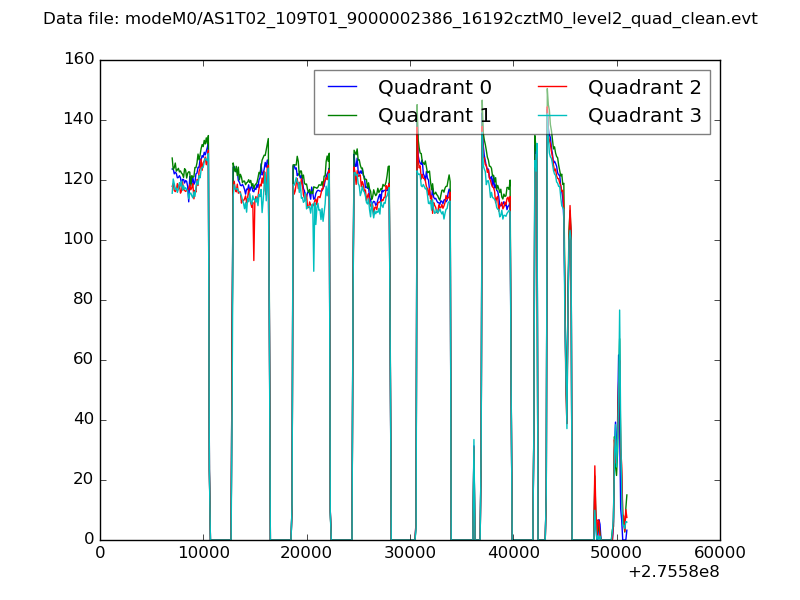 |
|
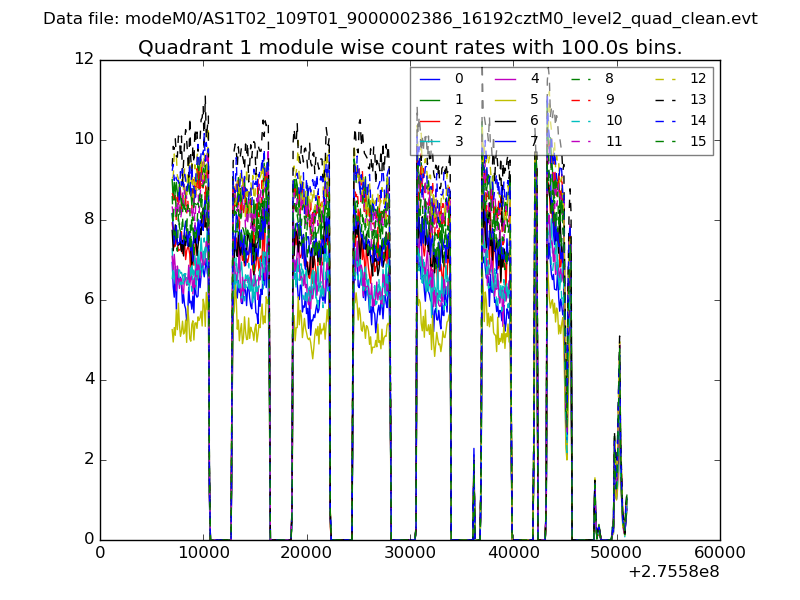
| Module-wise count rates for Quadrant A Data is divided into 100 sec bins |
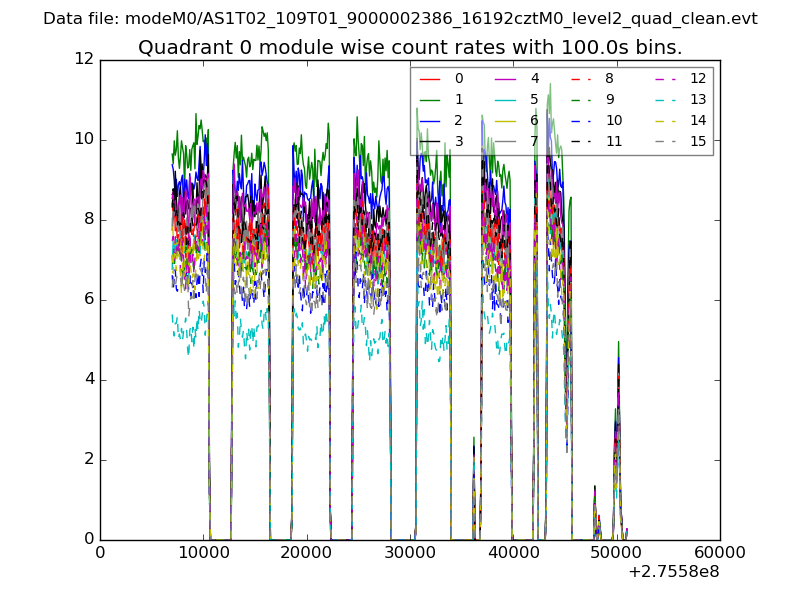 |
 |
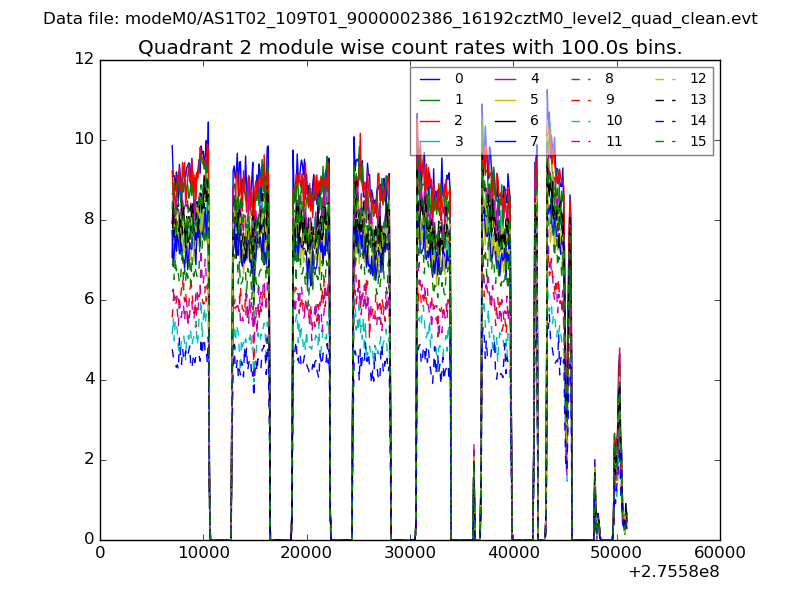
| Module-wise count rates for Quadrant B Data is divided into 100 sec bins |
 |
 |
| Module-wise count rates for Quadrant C Data is divided into 100 sec bins |
 |
 |
| Module-wise count rates for Quadrant D Data is divided into 100 sec bins |
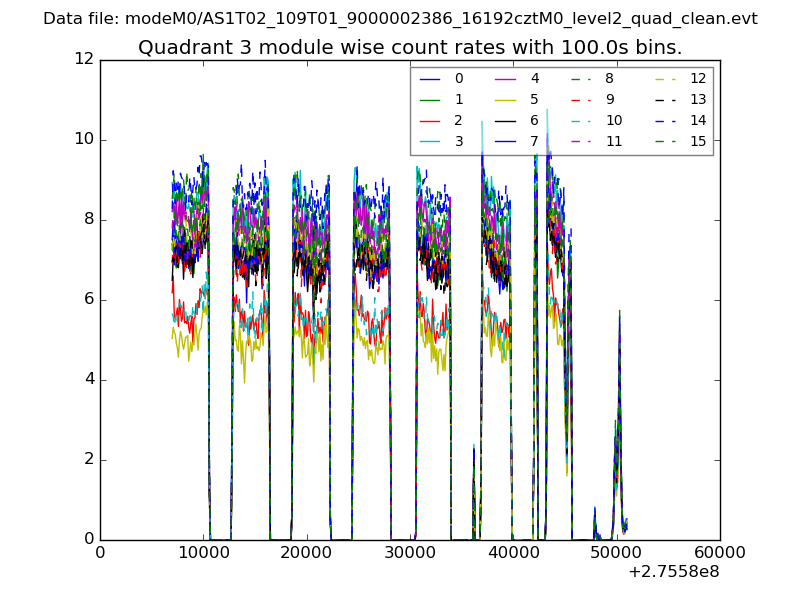 |
 |
| Parameter | Plot |
|---|---|
| CZT HV Monitor | 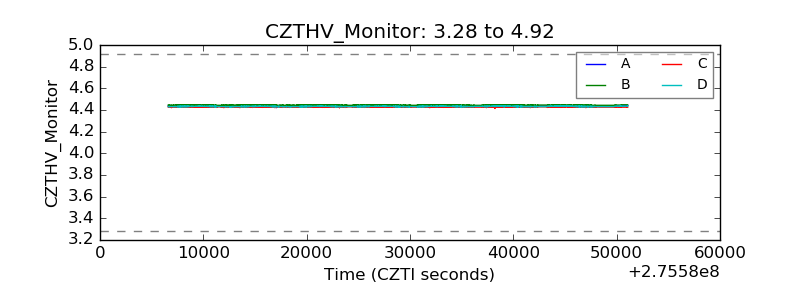 |
| D_VDD | 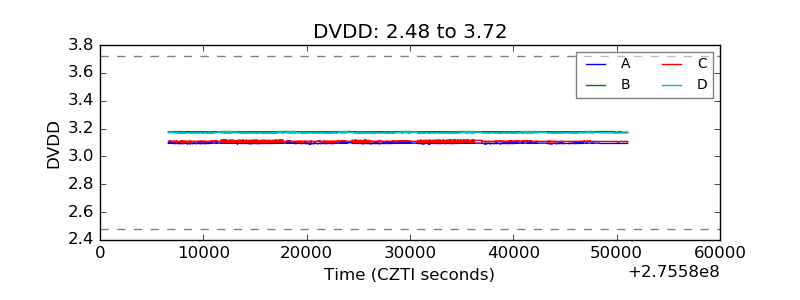 |
| Temperature 1 | 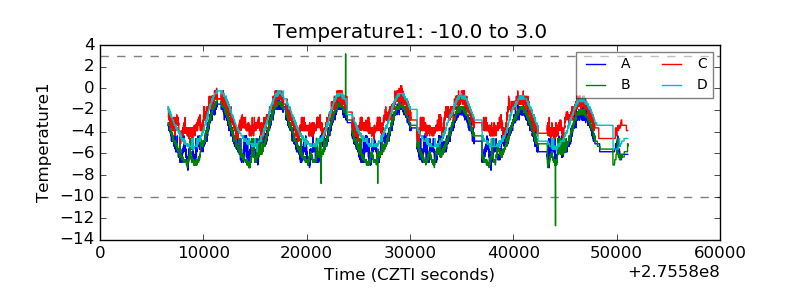 |
| Veto HV Monitor | 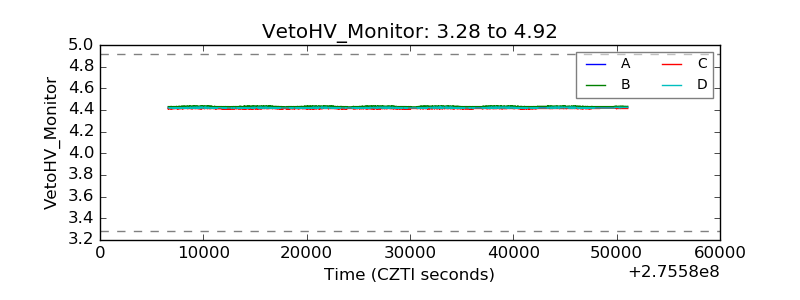 |
| Veto LLD | 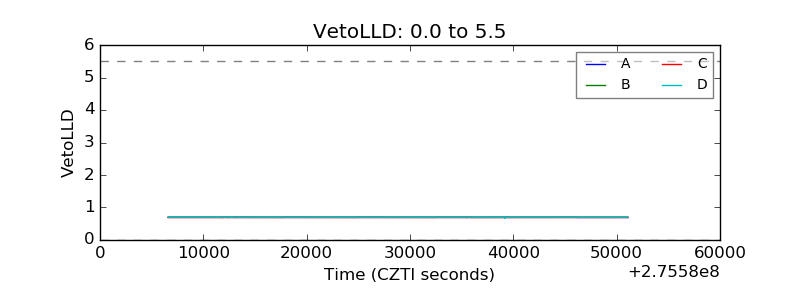 |
| Alpha Counter | 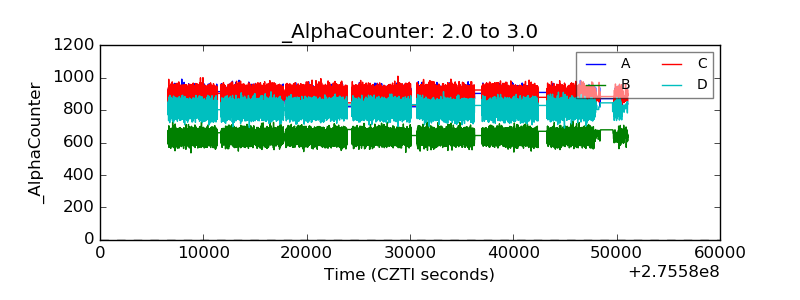 |
| _CPM_Rate | 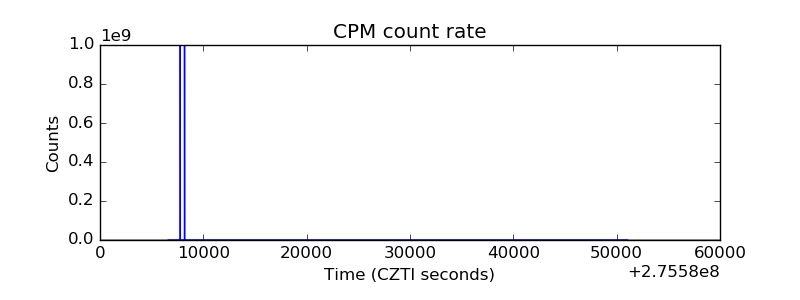 |
| CZT Counter | 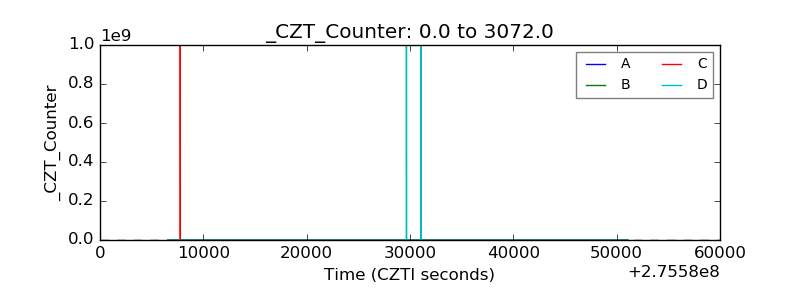 |
| +2.5 Volts monitor |  |
| +5 Volts monitor | 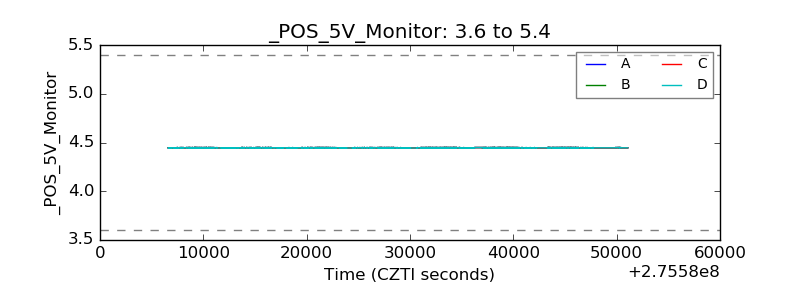 |
| _ROLL_ROT | 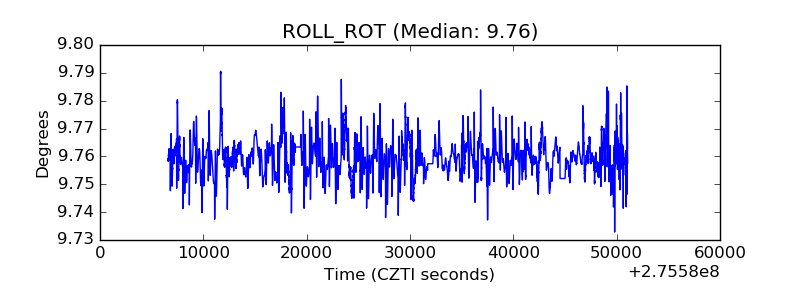 |
| _Roll_DEC |  |
| _Roll_RA | 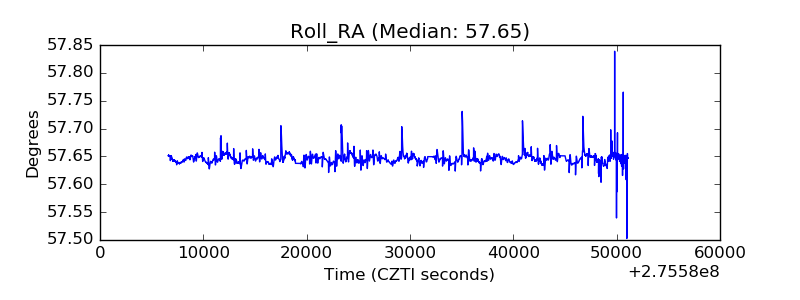 |
| Veto Counter | 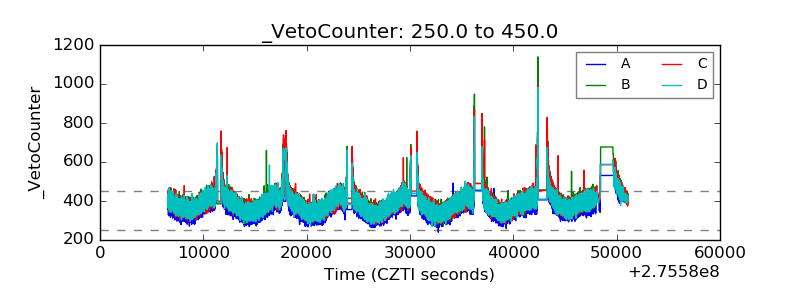 |