| Param | Original file | Final file |
|---|---|---|
| Filename | modeM0/AS1T02_109T01_9000002386_16194cztM0_level2.evt | modeM0/AS1T02_109T01_9000002386_16194cztM0_level2_quad_clean.evt |
| Size (bytes) | 485,467,200 | 94,000,320 |
| Size | 463.0 MB | 89.6 MB |
| Events in quadrant A | 4,388,609 | 603,068 |
| Events in quadrant B | 3,389,553 | 618,717 |
| Events in quadrant C | 3,177,334 | 588,659 |
| Events in quadrant D | 3,301,242 | 578,201 |
| Mode M0 | |||
|---|---|---|---|
| Quadrant | BADHDUFLAG | Total packets | Discarded packets |
| A | 0 | 16956 | 2 |
| B | 0 | 13909 | 1 |
| C | 0 | 13414 | 1 |
| D | 0 | 14100 | 1 |
| Mode SS | |||
|---|---|---|---|
| Quadrant | BADHDUFLAG | Total packets | Discarded packets |
| A | 0 | 134 | 0 |
| B | 0 | 134 | 0 |
| C | 0 | 134 | 0 |
| D | 0 | 134 | 0 |
| Mode M9 | |||
|---|---|---|---|
| Quadrant | BADHDUFLAG | Total packets | Discarded packets |
| A | 0 | 12 | 0 |
| B | 0 | 12 | 0 |
| C | 0 | 12 | 0 |
| D | 0 | 12 | 0 |
| Quadrant | Total seconds | Saturated seconds | Saturation percentage |
|---|---|---|---|
| A | 6564 | 207 | 3.153565% |
| B | 6564 | 36 | 0.548446% |
| C | 6564 | 53 | 0.807434% |
| D | 6564 | 44 | 0.670323% |
Noise dominated data is calculated using 1-second bins in cleaned event files. If a bin has >2000 counts, and if more than 50% of those come from <1% of pixels, then it is considered to be noise-dominated and hence unusable.
| Quadrant | # 1 sec bins | Bins with >0 counts | Bins with >2000 counts | High rate bins dominated by noise | Noise dominated (total time) | Noise dominated (detector-on time) | Marked lightcurve |
|---|---|---|---|---|---|---|---|
| A | 7730 | 6566 | 217 | 217 | 2.81% | 3.30% | 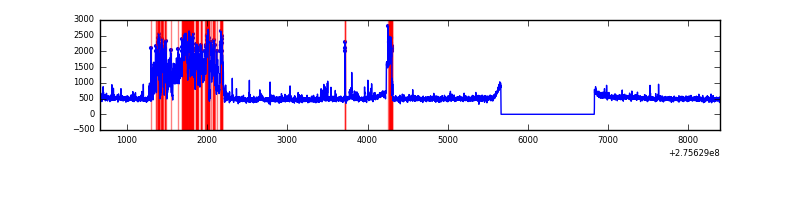 |
| B | 7730 | 6566 | 0 | 0 | 0.00% | 0.00% | 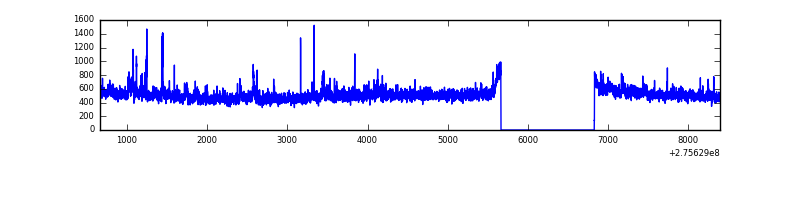 |
| C | 7730 | 6566 | 0 | 0 | 0.00% | 0.00% | 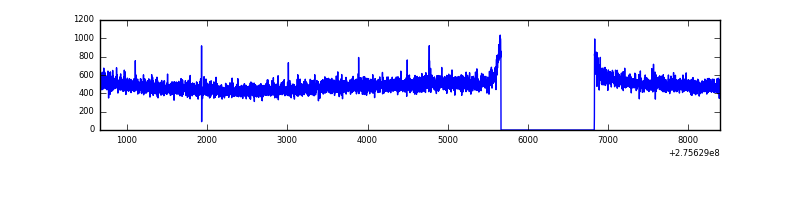 |
| D | 7730 | 6566 | 40 | 40 | 0.52% | 0.61% | 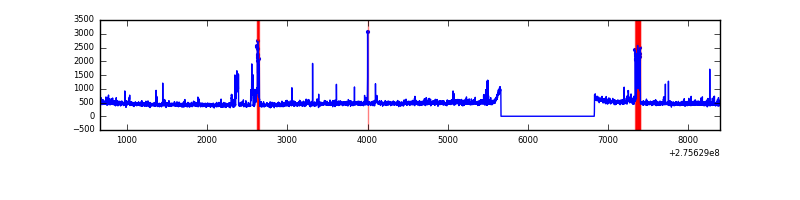 |
Top three noisy pixels from each quadrant. If the there are fewer than three noisy pixels in the level2.evt file, extra rows are filled as -1
| Pixel properties | Quadrant properties | ||||||
|---|---|---|---|---|---|---|---|
| Quadrant | DetID | PixID | Counts | Sigma | Mean | Median | Sigma |
| A | 15 | 157 | 1198048 | 7306.69 | 817 | 801 | 163.9 |
| A | 8 | 247 | 25749 | 152.26 | 817 | 801 | 163.9 |
| A | 9 | 143 | 13084 | 74.96 | 817 | 801 | 163.9 |
| B | 3 | 64 | 99749 | 638.32 | 816 | 797 | 155.0 |
| B | 0 | 229 | 48434 | 307.29 | 816 | 797 | 155.0 |
| B | 12 | 111 | 17948 | 110.64 | 816 | 797 | 155.0 |
| C | 14 | 238 | 125120 | 687.1 | 776 | 781 | 181.0 |
| C | 3 | 233 | 14770 | 77.3 | 776 | 781 | 181.0 |
| C | 7 | 247 | 5727 | 27.33 | 776 | 781 | 181.0 |
| D | 1 | 52 | 106920 | 549.34 | 793 | 769 | 193.2 |
| D | 10 | 70 | 106071 | 544.95 | 793 | 769 | 193.2 |
| D | 13 | 112 | 57553 | 293.86 | 793 | 769 | 193.2 |
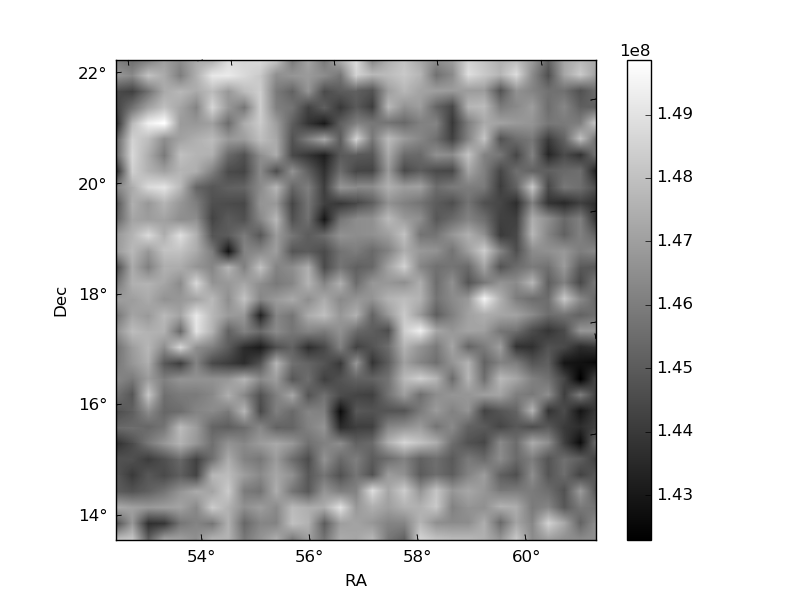
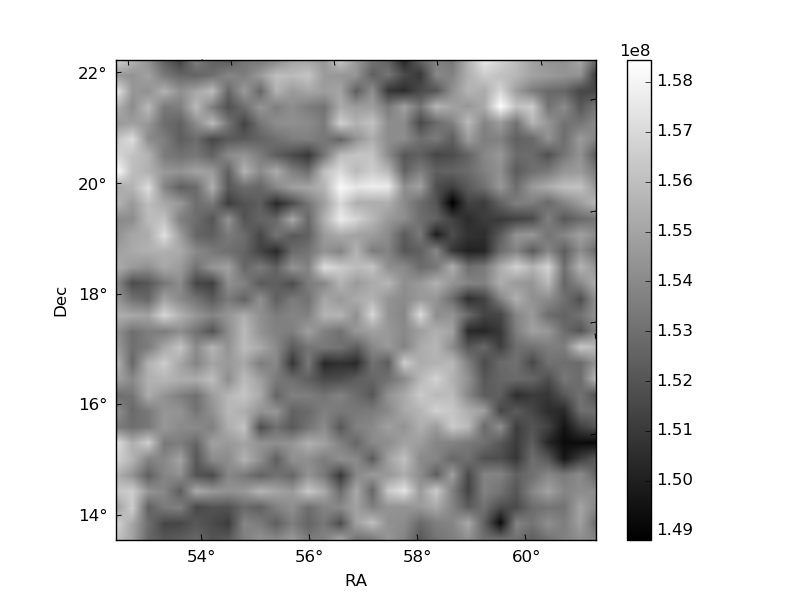
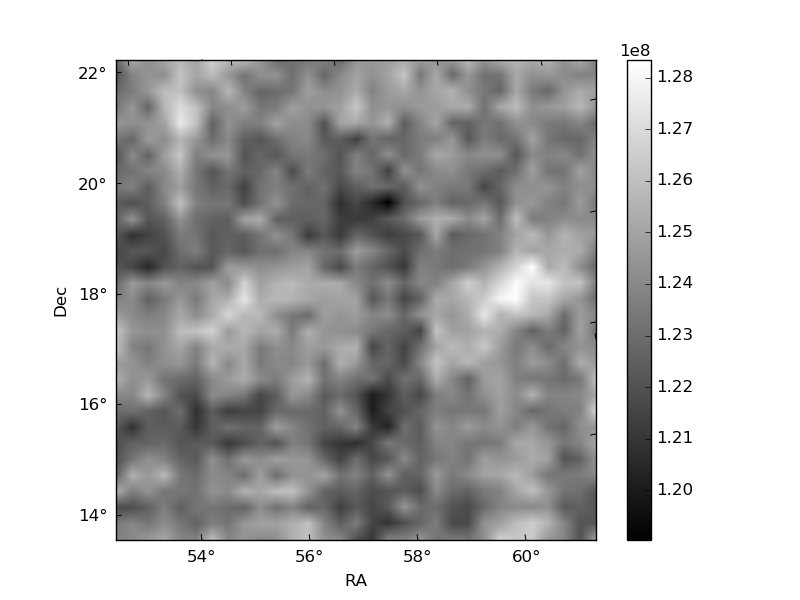
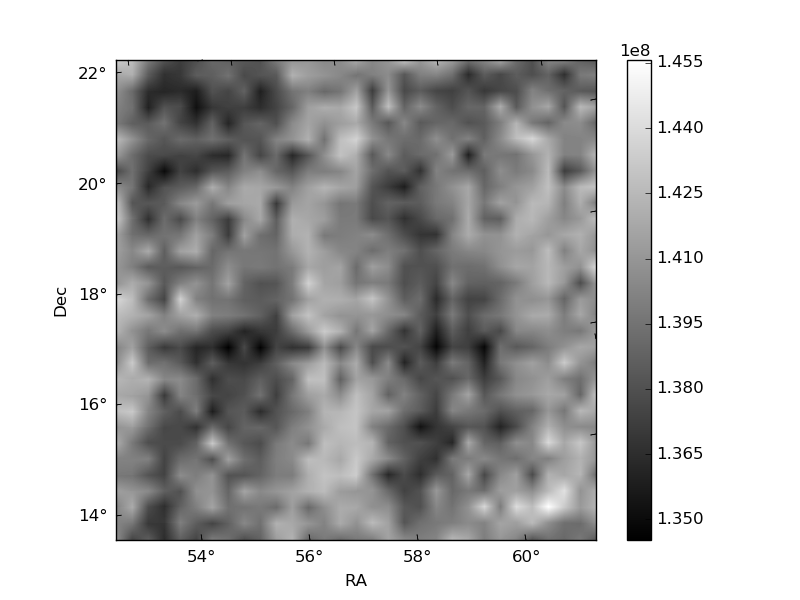
Histogram calculated using DETX and DETY for each event in the final _common_clean file
| Quadrant A | 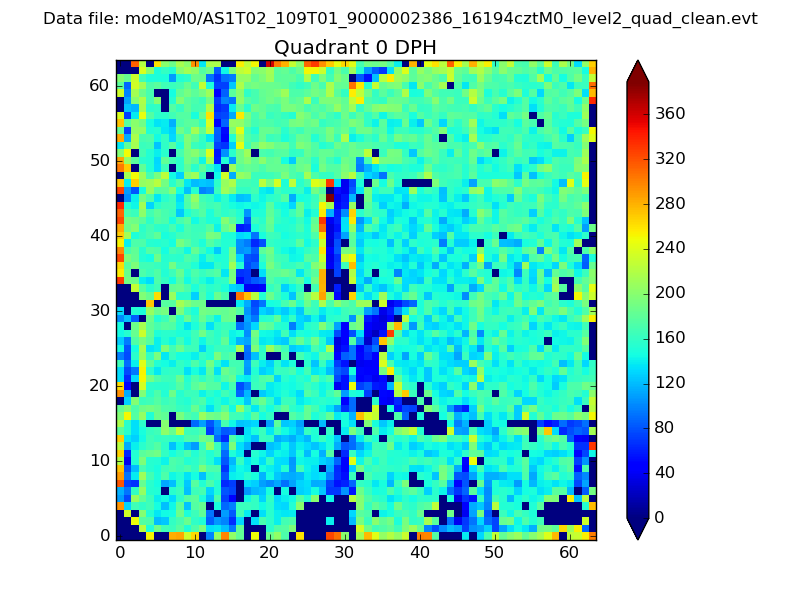 |
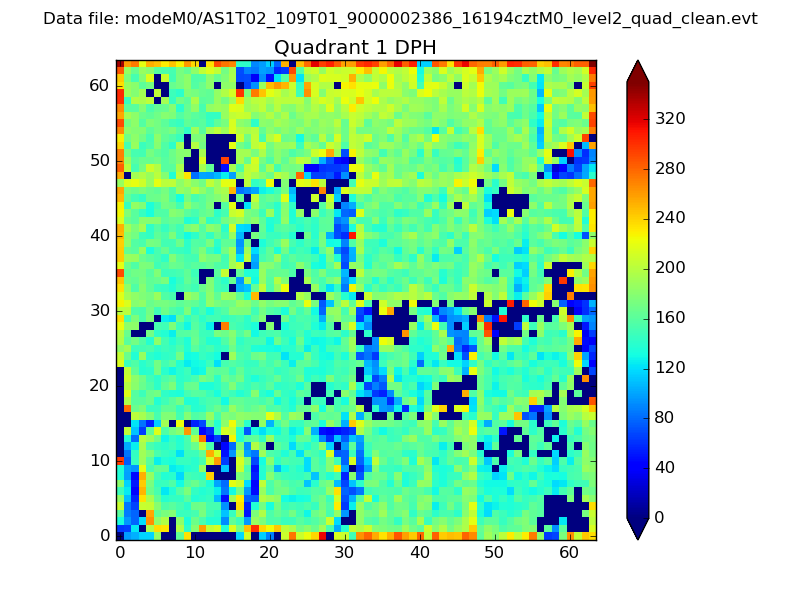 |
Quadrant B |
|---|---|---|---|
| Quadrant D | 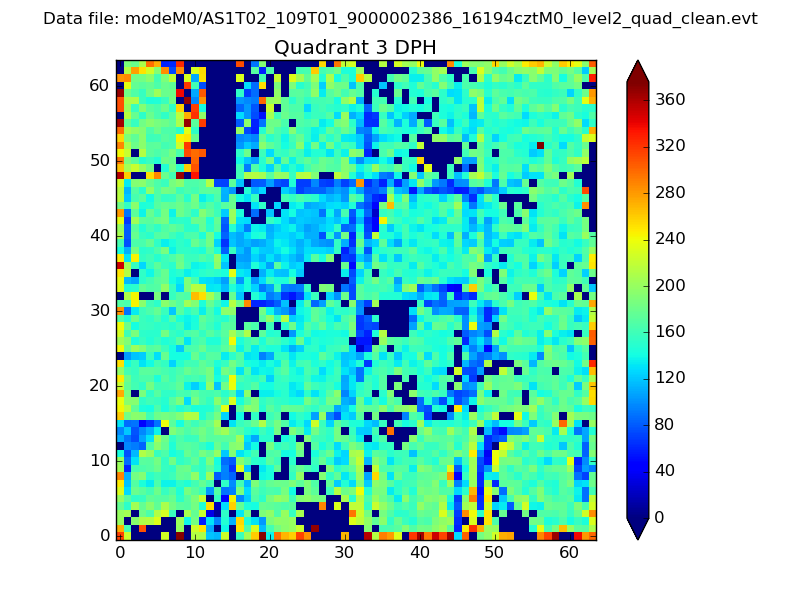 |
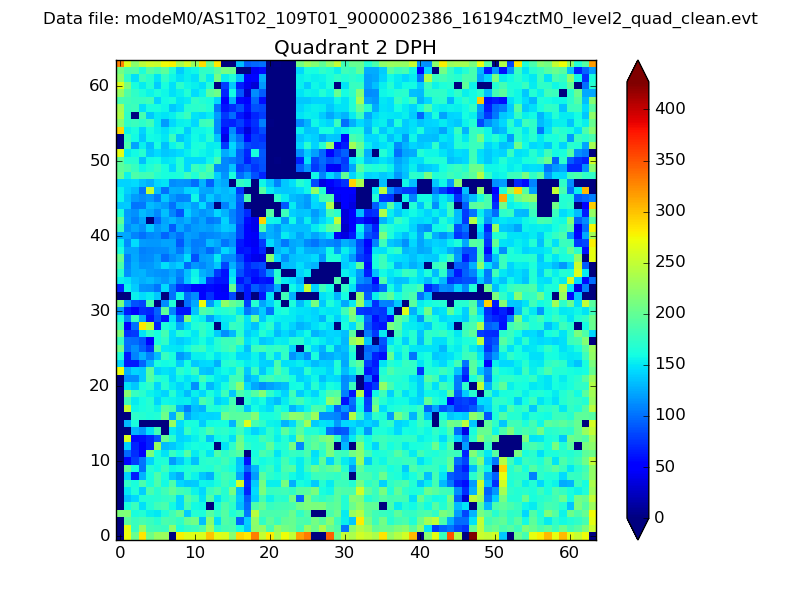 |
Quadrant C |
| Plot type | Count rate plots | Images |
|---|---|---|
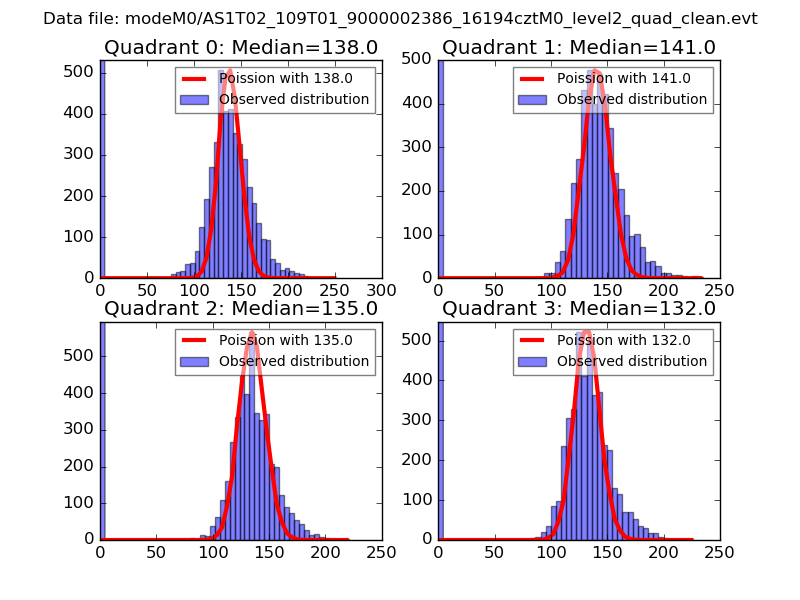
| Comparison with Poisson distribution Blue bars denote a histogram of data divided into 1 sec bins. Red curve is a Poisson curve with rate = median count rate of data. |
 |
 |
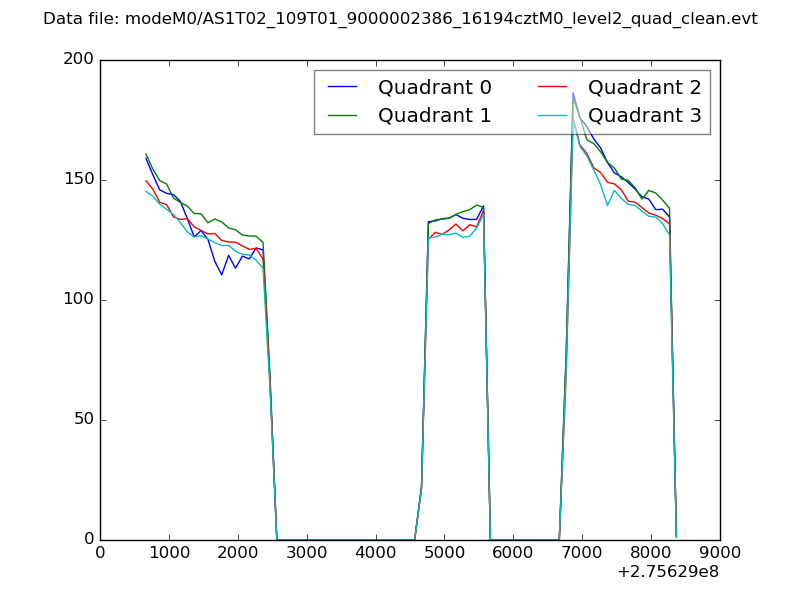
| Quadrant-wise count rates Data is divided into 100 sec bins |
 |
|
| Module-wise count rates for Quadrant A Data is divided into 100 sec bins |
 |
 |
| Module-wise count rates for Quadrant B Data is divided into 100 sec bins |
 |
 |
| Module-wise count rates for Quadrant C Data is divided into 100 sec bins |
 |
 |
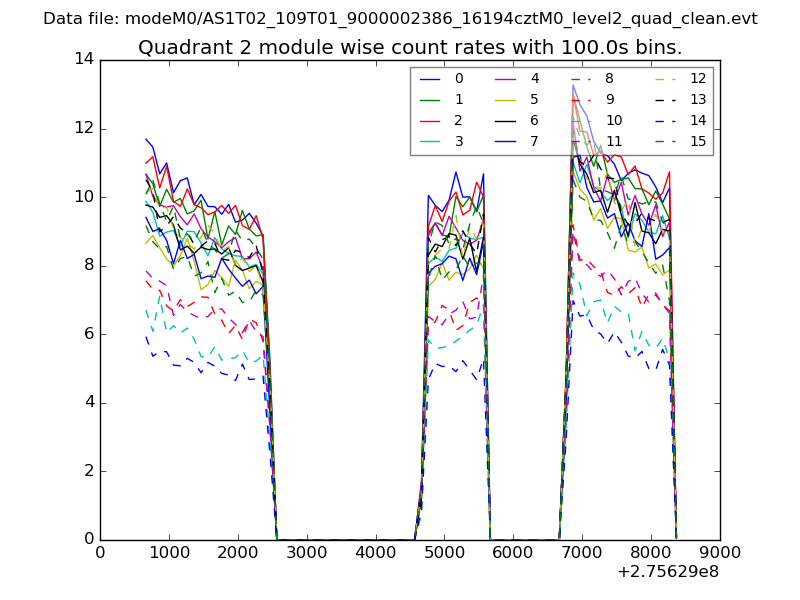
| Module-wise count rates for Quadrant D Data is divided into 100 sec bins |
 |
 |
| Parameter | Plot |
|---|---|
| CZT HV Monitor | 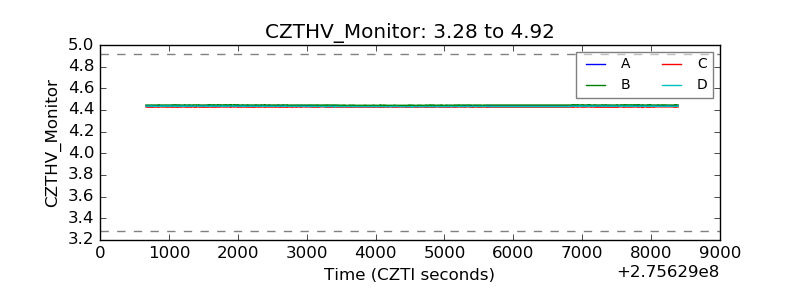 |
| D_VDD | 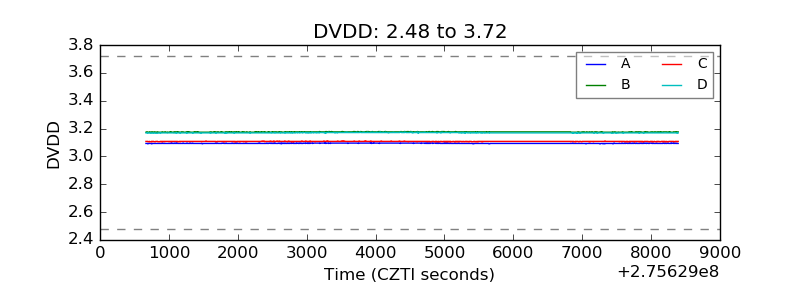 |
| Temperature 1 | 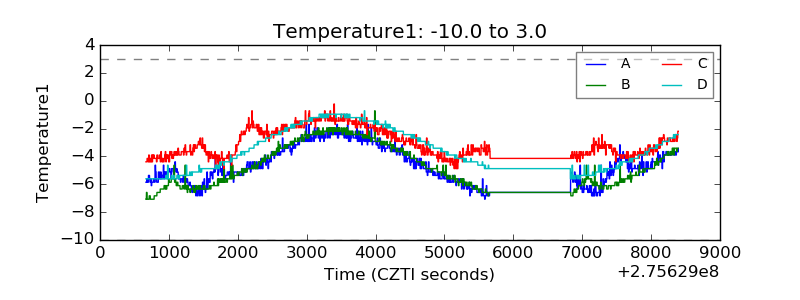 |
| Veto HV Monitor |  |
| Veto LLD | 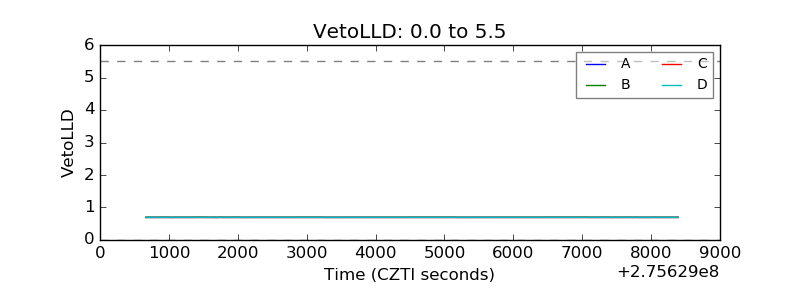 |
| Alpha Counter | 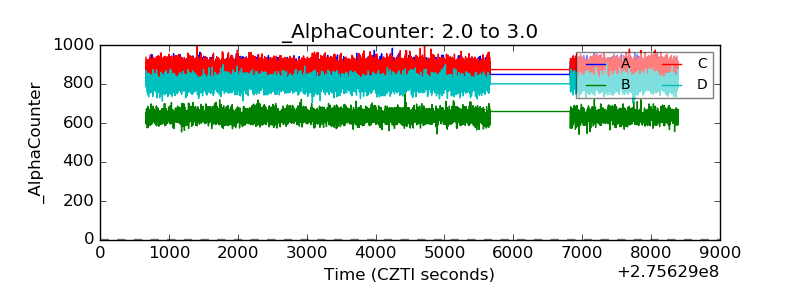 |
| _CPM_Rate | 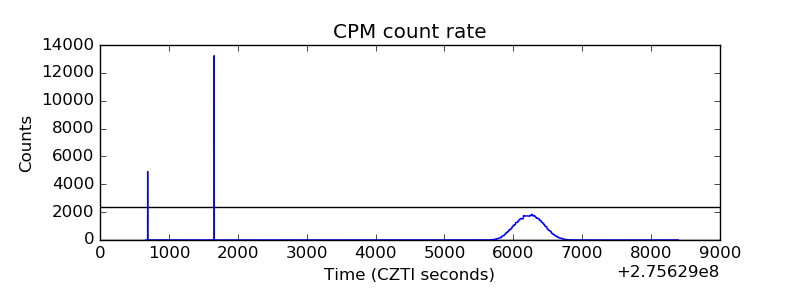 |
| CZT Counter | 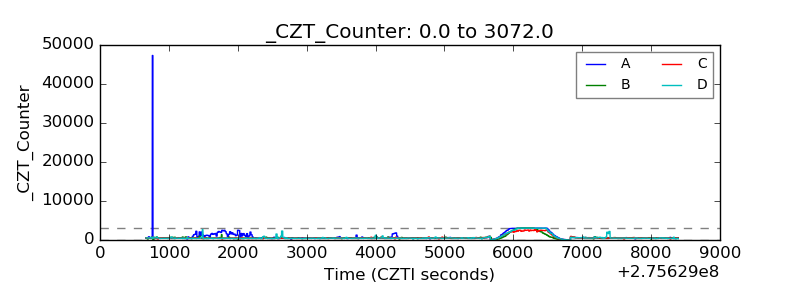 |
| +2.5 Volts monitor | 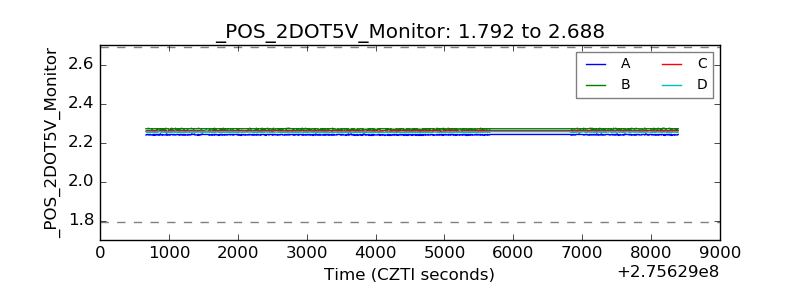 |
| +5 Volts monitor |  |
| _ROLL_ROT | 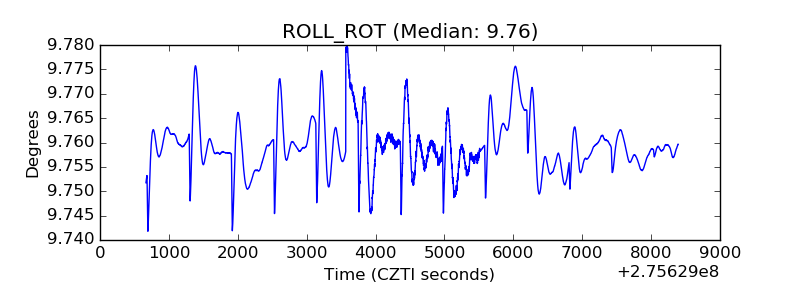 |
| _Roll_DEC | 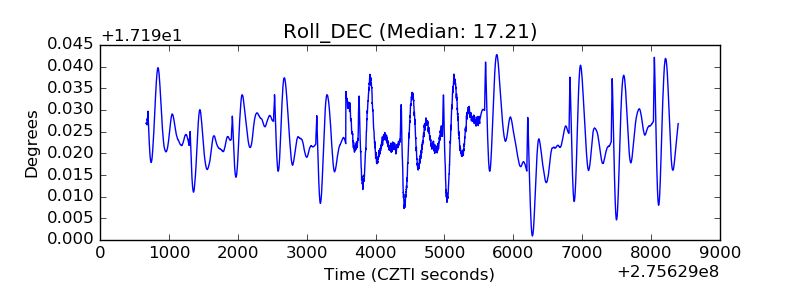 |
| _Roll_RA |  |
| Veto Counter | 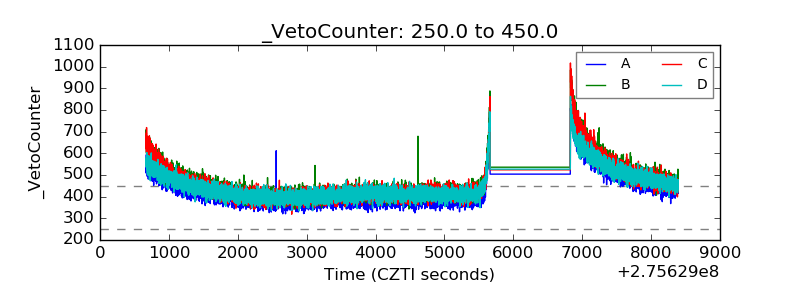 |