| Param | Original file | Final file |
|---|---|---|
| Filename | modeM0/AS1T02_109T01_9000002386_16195cztM0_level2.evt | modeM0/AS1T02_109T01_9000002386_16195cztM0_level2_quad_clean.evt |
| Size (bytes) | 385,318,080 | 73,589,760 |
| Size | 367.5 MB | 70.2 MB |
| Events in quadrant A | 2,800,921 | 469,581 |
| Events in quadrant B | 2,897,480 | 476,019 |
| Events in quadrant C | 2,816,910 | 450,060 |
| Events in quadrant D | 2,778,335 | 446,346 |
| Mode M0 | |||
|---|---|---|---|
| Quadrant | BADHDUFLAG | Total packets | Discarded packets |
| A | 0 | 11501 | 2 |
| B | 0 | 11724 | 1 |
| C | 0 | 11573 | 1 |
| D | 0 | 11662 | 1 |
| Mode SS | |||
|---|---|---|---|
| Quadrant | BADHDUFLAG | Total packets | Discarded packets |
| A | 0 | 114 | 0 |
| B | 0 | 114 | 0 |
| C | 0 | 114 | 0 |
| D | 0 | 114 | 0 |
| Mode M9 | |||
|---|---|---|---|
| Quadrant | BADHDUFLAG | Total packets | Discarded packets |
| A | 0 | 12 | 0 |
| B | 0 | 12 | 0 |
| C | 0 | 12 | 0 |
| D | 0 | 12 | 0 |
| Quadrant | Total seconds | Saturated seconds | Saturation percentage |
|---|---|---|---|
| A | 5516 | 27 | 0.489485% |
| B | 5516 | 40 | 0.725163% |
| C | 5516 | 46 | 0.833938% |
| D | 5516 | 37 | 0.670776% |
Noise dominated data is calculated using 1-second bins in cleaned event files. If a bin has >2000 counts, and if more than 50% of those come from <1% of pixels, then it is considered to be noise-dominated and hence unusable.
| Quadrant | # 1 sec bins | Bins with >0 counts | Bins with >2000 counts | High rate bins dominated by noise | Noise dominated (total time) | Noise dominated (detector-on time) | Marked lightcurve |
|---|---|---|---|---|---|---|---|
| A | 6782 | 5518 | 0 | 0 | 0.00% | 0.00% | 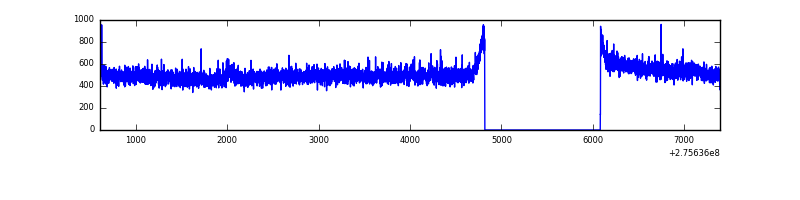 |
| B | 6782 | 5518 | 5 | 5 | 0.07% | 0.09% | 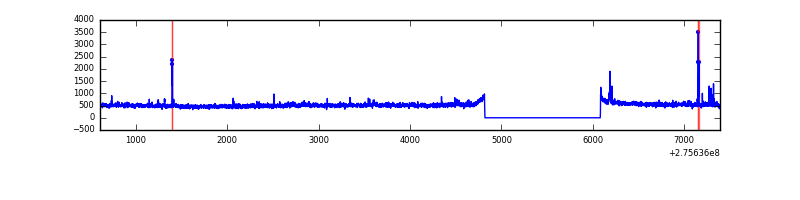 |
| C | 6782 | 5518 | 0 | 0 | 0.00% | 0.00% | 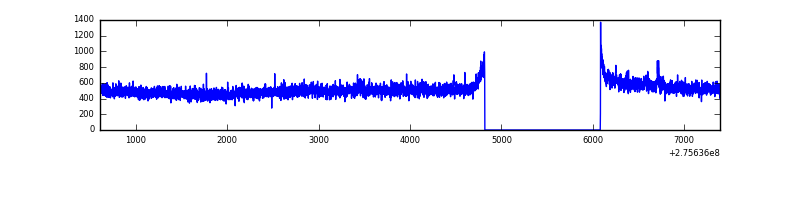 |
| D | 6782 | 5518 | 7 | 7 | 0.10% | 0.13% | 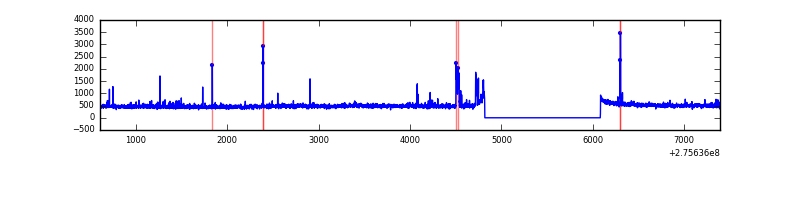 |
Top three noisy pixels from each quadrant. If the there are fewer than three noisy pixels in the level2.evt file, extra rows are filled as -1
| Pixel properties | Quadrant properties | ||||||
|---|---|---|---|---|---|---|---|
| Quadrant | DetID | PixID | Counts | Sigma | Mean | Median | Sigma |
| A | 15 | 157 | 14445 | 94.45 | 722 | 708 | 145.4 |
| A | 8 | 247 | 9902 | 63.22 | 722 | 708 | 145.4 |
| A | 0 | 226 | 6453 | 39.5 | 722 | 708 | 145.4 |
| B | 15 | 201 | 37513 | 274.08 | 714 | 698 | 134.3 |
| B | 0 | 229 | 28312 | 205.58 | 714 | 698 | 134.3 |
| B | 12 | 111 | 15400 | 109.45 | 714 | 698 | 134.3 |
| C | 14 | 238 | 106412 | 671.68 | 679 | 684 | 157.4 |
| C | 3 | 233 | 52904 | 331.75 | 679 | 684 | 157.4 |
| C | 7 | 247 | 9528 | 56.19 | 679 | 684 | 157.4 |
| D | 1 | 52 | 119692 | 703.19 | 697 | 677 | 169.3 |
| D | 2 | 234 | 19761 | 112.76 | 697 | 677 | 169.3 |
| D | 5 | 222 | 12480 | 69.74 | 697 | 677 | 169.3 |
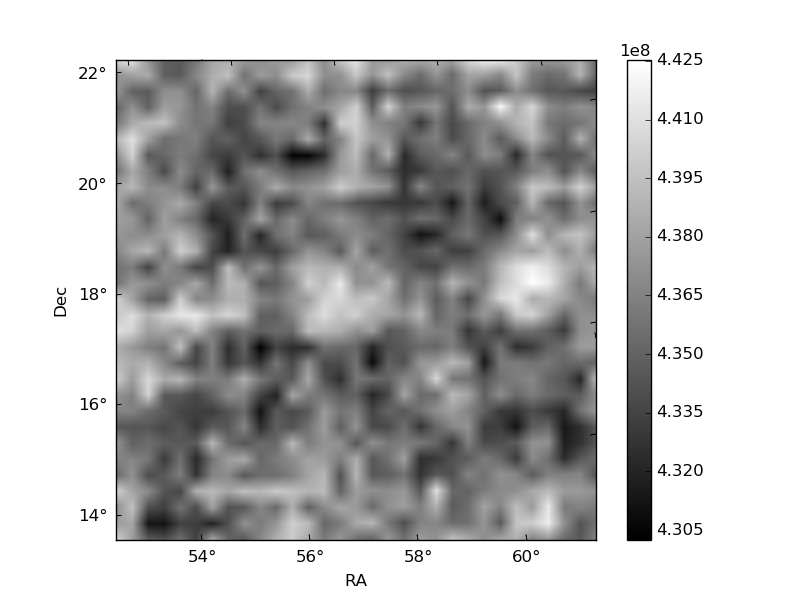
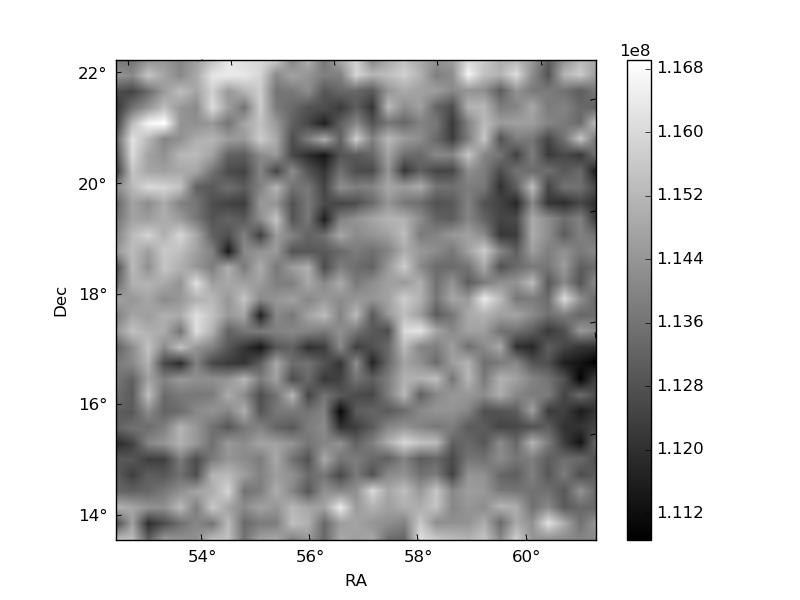
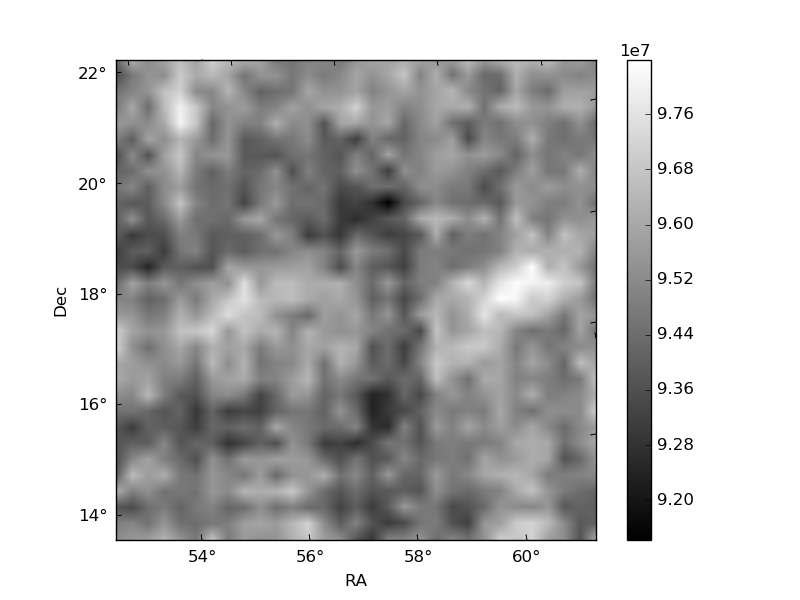
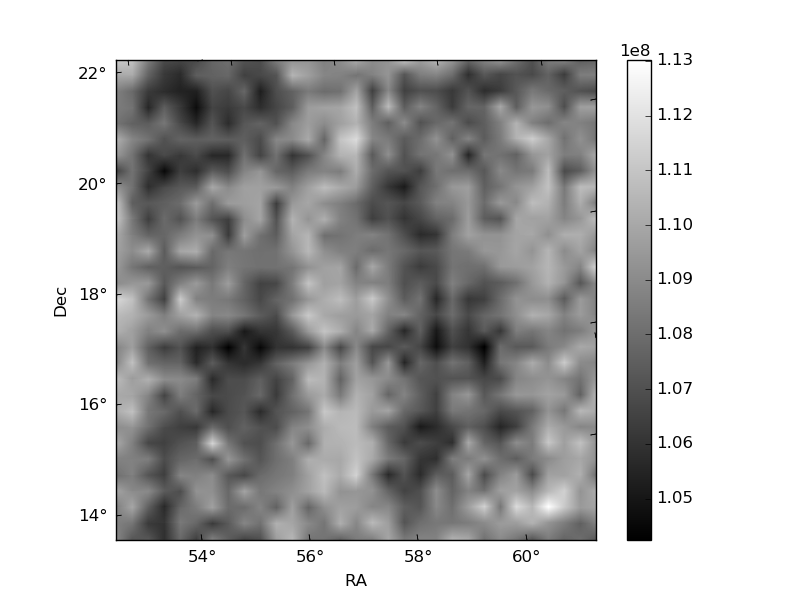
Histogram calculated using DETX and DETY for each event in the final _common_clean file
| Quadrant A | 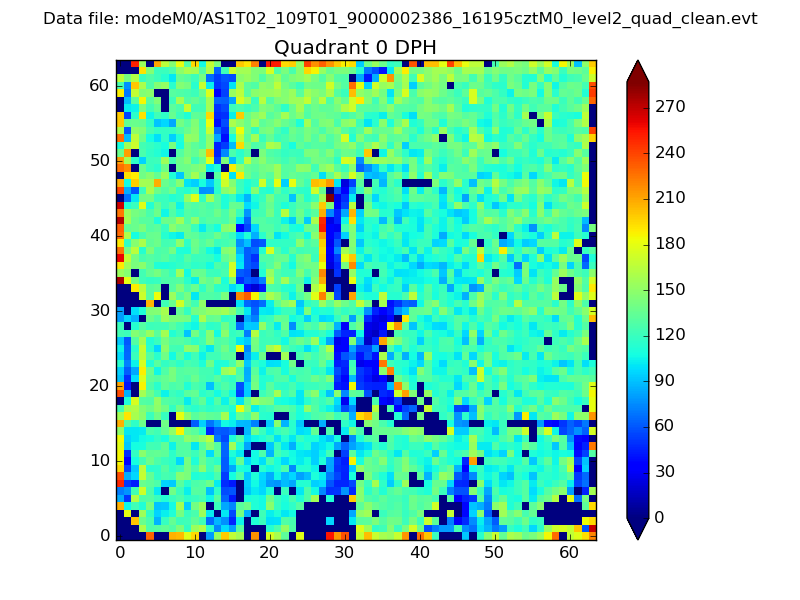 |
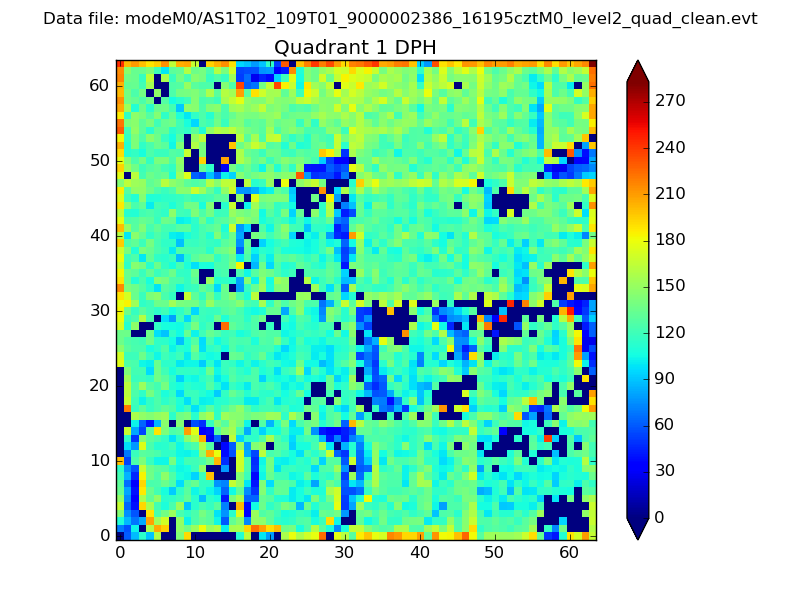 |
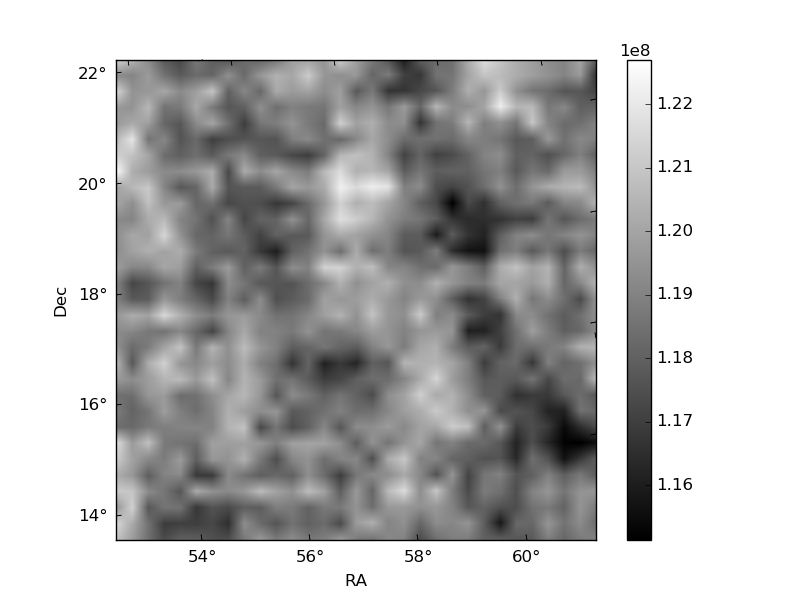
Quadrant B |
|---|---|---|---|
| Quadrant D | 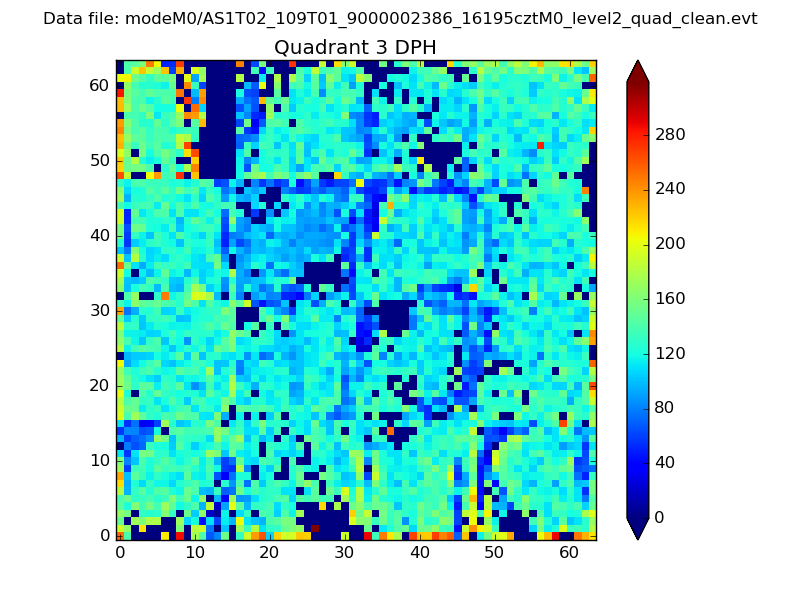 |
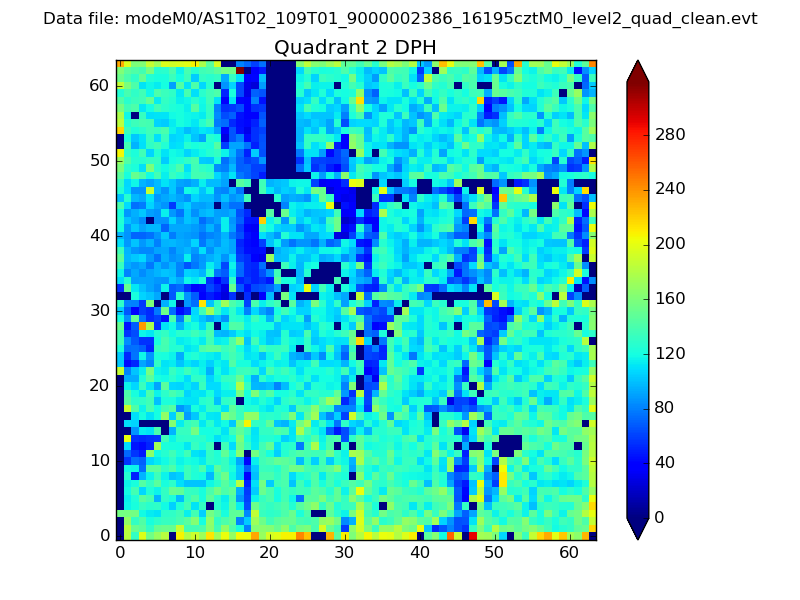 |
Quadrant C |
| Plot type | Count rate plots | Images |
|---|---|---|
| Comparison with Poisson distribution Blue bars denote a histogram of data divided into 1 sec bins. Red curve is a Poisson curve with rate = median count rate of data. |
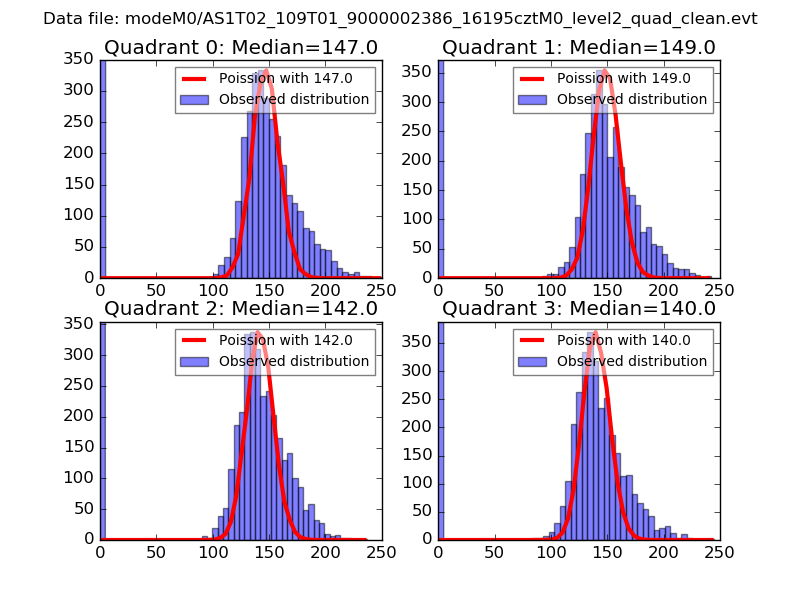 |
 |
| Quadrant-wise count rates Data is divided into 100 sec bins |
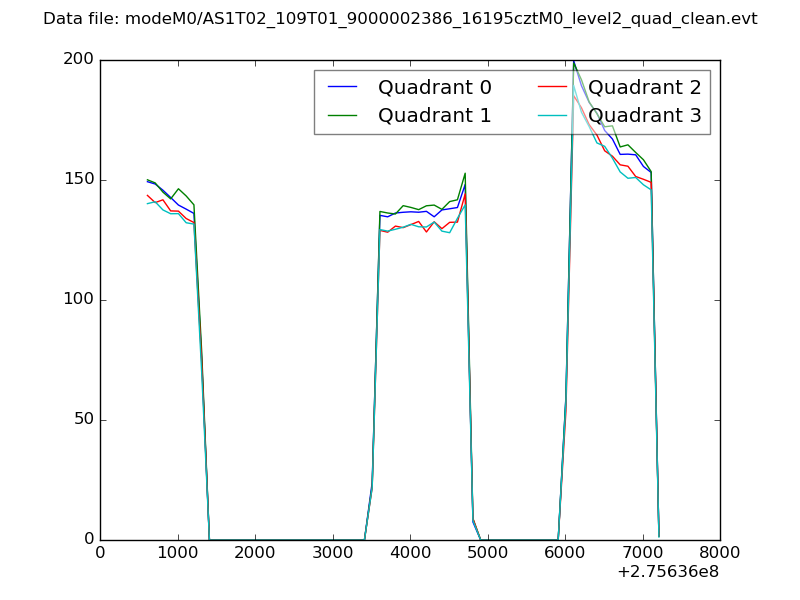 |
|
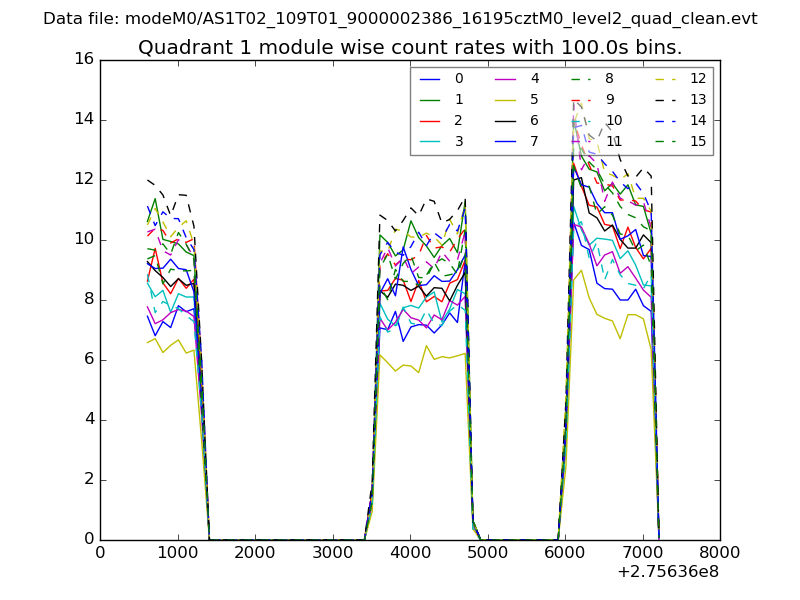
| Module-wise count rates for Quadrant A Data is divided into 100 sec bins |
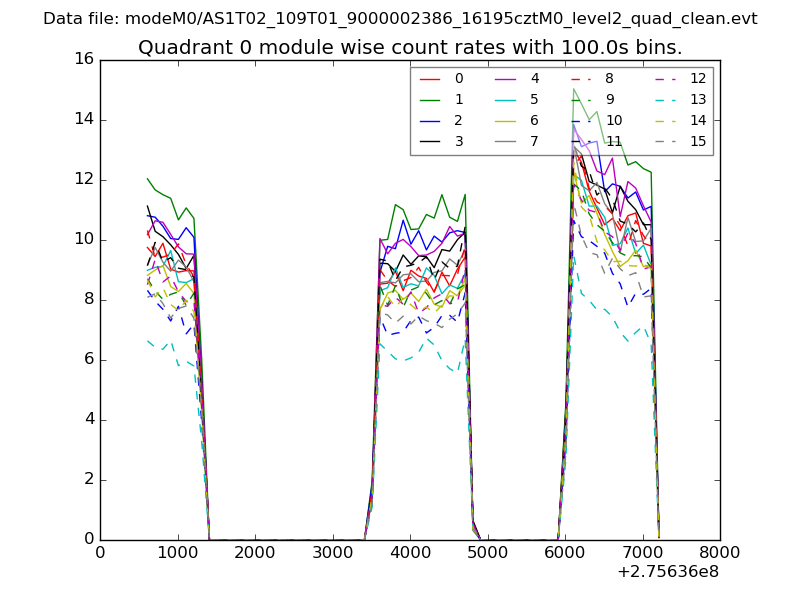 |
 |
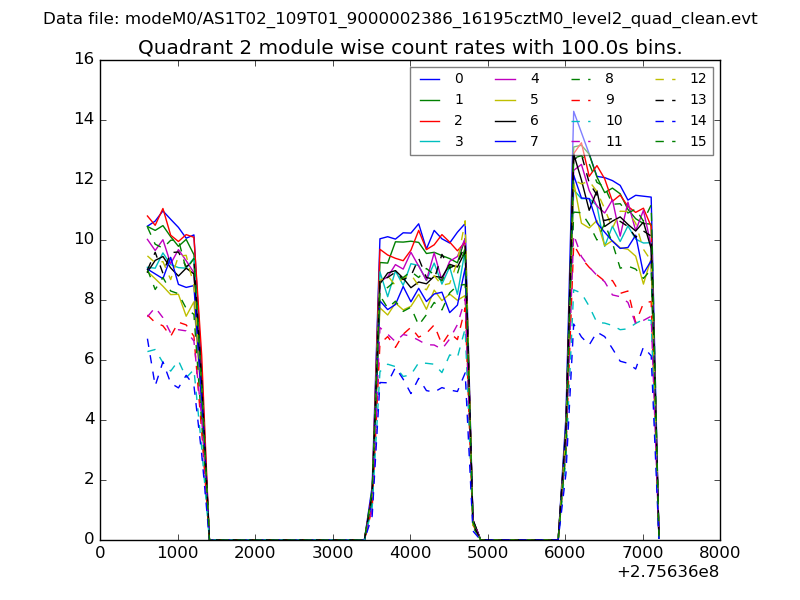
| Module-wise count rates for Quadrant B Data is divided into 100 sec bins |
 |
 |
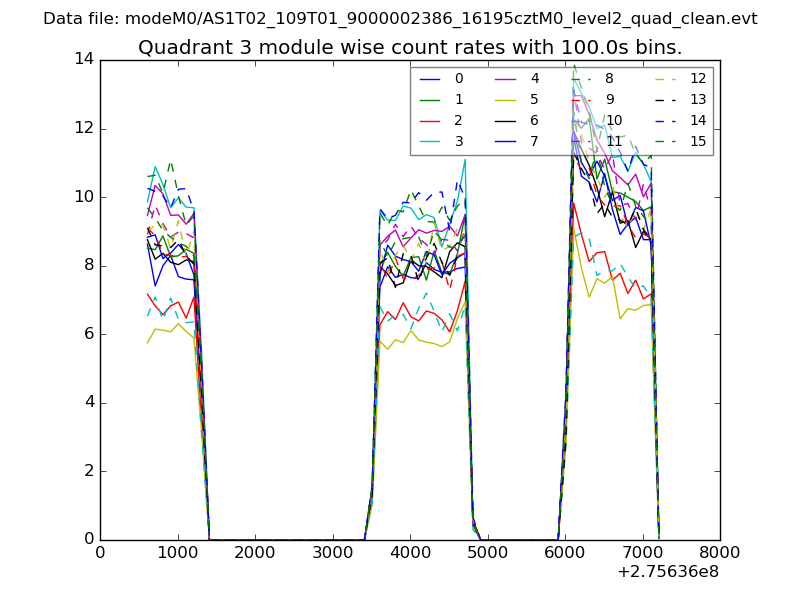
| Module-wise count rates for Quadrant C Data is divided into 100 sec bins |
 |
 |
| Module-wise count rates for Quadrant D Data is divided into 100 sec bins |
 |
 |
| Parameter | Plot |
|---|---|
| CZT HV Monitor | 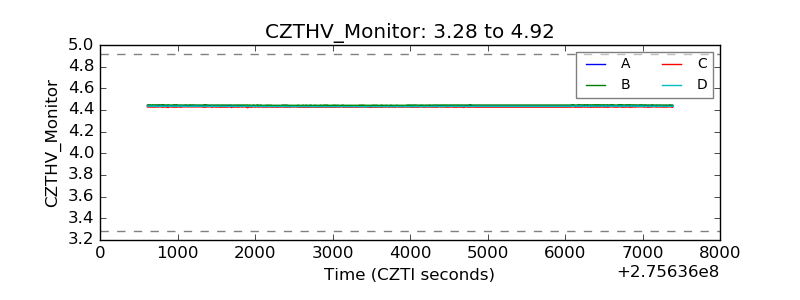 |
| D_VDD | 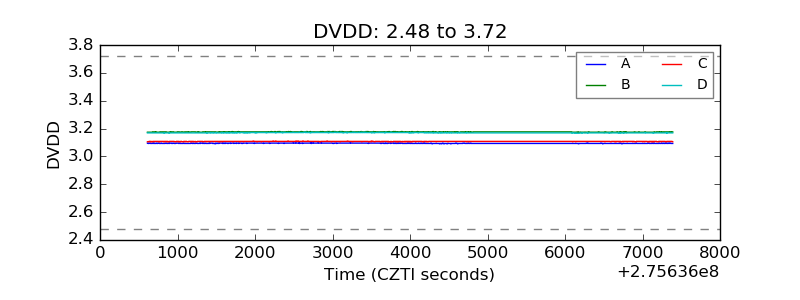 |
| Temperature 1 | 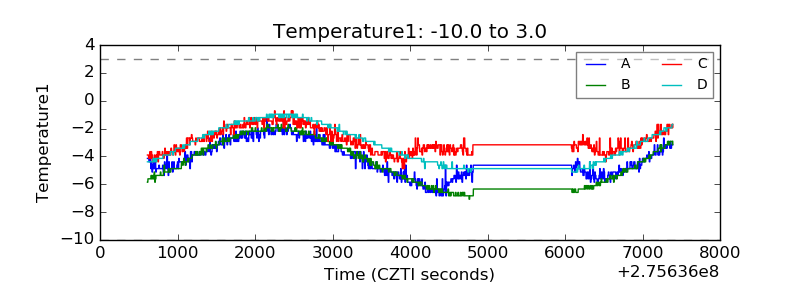 |
| Veto HV Monitor | 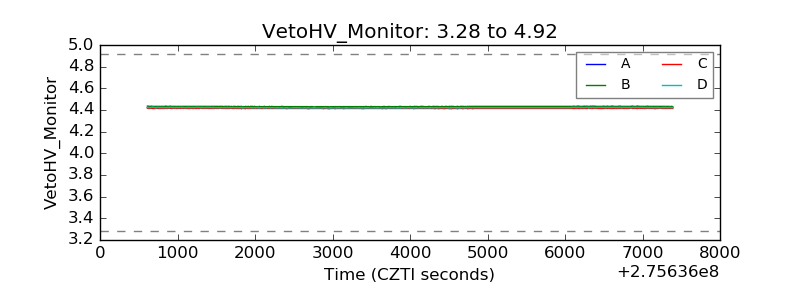 |
| Veto LLD | 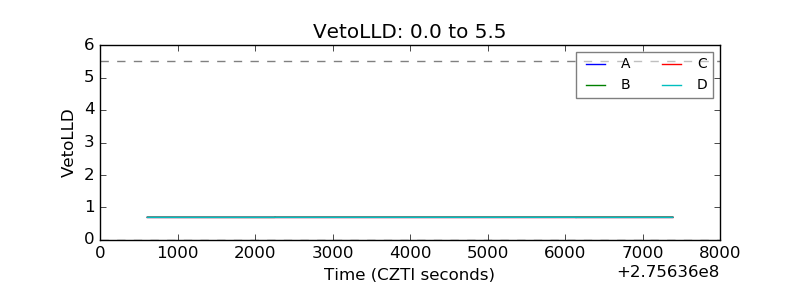 |
| Alpha Counter | 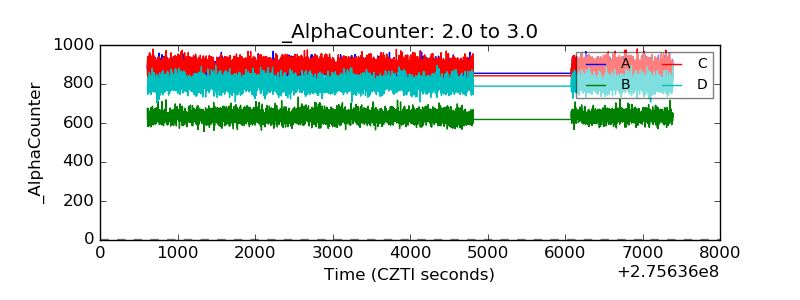 |
| _CPM_Rate | 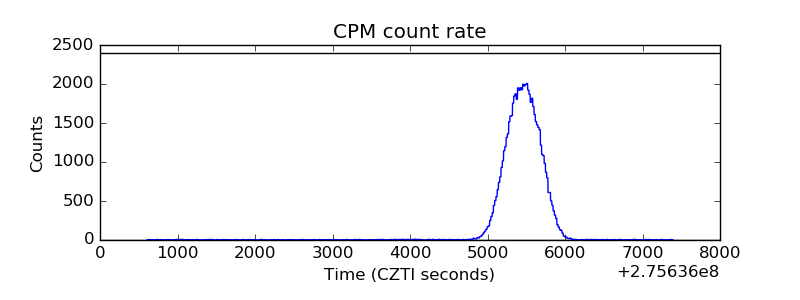 |
| CZT Counter | 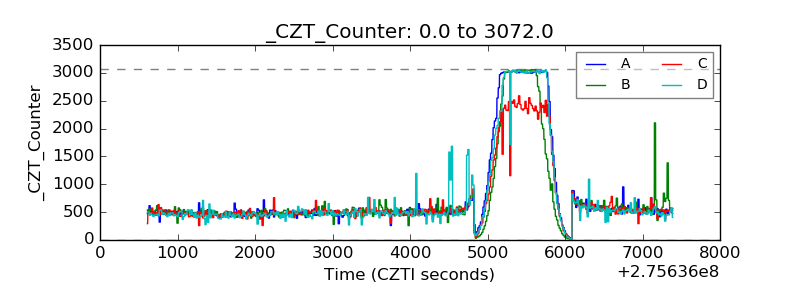 |
| +2.5 Volts monitor | 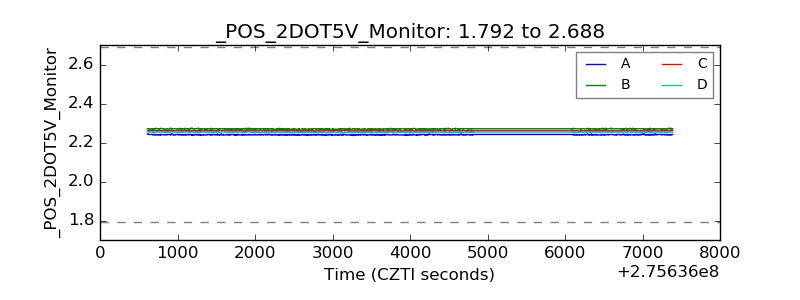 |
| +5 Volts monitor | 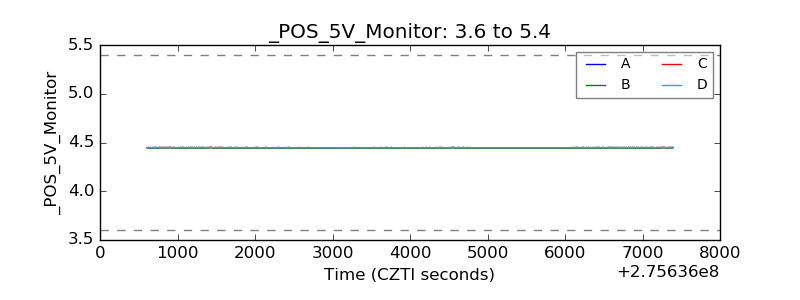 |
| _ROLL_ROT | 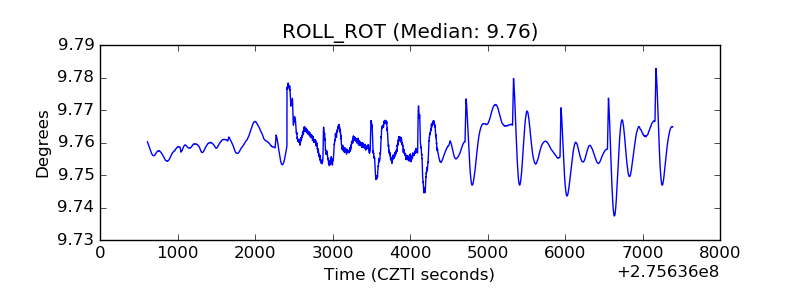 |
| _Roll_DEC |  |
| _Roll_RA | 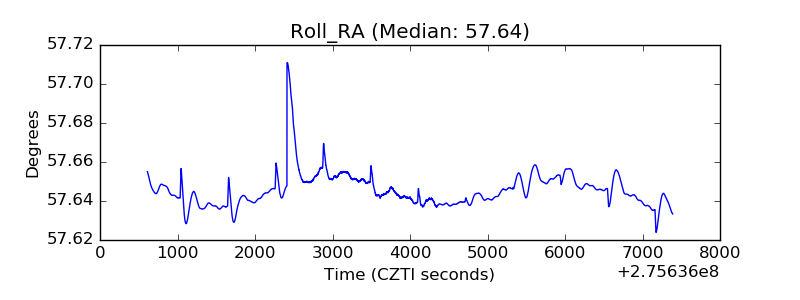 |
| Veto Counter | 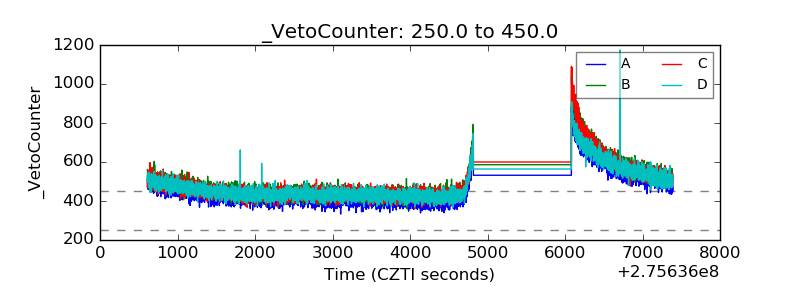 |