| Param | Original file | Final file |
|---|---|---|
| Filename | modeM0/AS1T02_109T01_9000002386_16196cztM0_level2.evt | modeM0/AS1T02_109T01_9000002386_16196cztM0_level2_quad_clean.evt |
| Size (bytes) | 482,215,680 | 84,971,520 |
| Size | 459.9 MB | 81.0 MB |
| Events in quadrant A | 3,326,267 | 549,134 |
| Events in quadrant B | 3,470,038 | 552,340 |
| Events in quadrant C | 3,561,230 | 525,599 |
| Events in quadrant D | 3,826,389 | 513,977 |
| Mode M0 | |||
|---|---|---|---|
| Quadrant | BADHDUFLAG | Total packets | Discarded packets |
| A | 0 | 13465 | 3 |
| B | 0 | 13843 | 2 |
| C | 0 | 14247 | 2 |
| D | 0 | 15145 | 2 |
| Mode SS | |||
|---|---|---|---|
| Quadrant | BADHDUFLAG | Total packets | Discarded packets |
| A | 0 | 126 | 0 |
| B | 0 | 126 | 0 |
| C | 0 | 126 | 0 |
| D | 0 | 126 | 0 |
| Mode M9 | |||
|---|---|---|---|
| Quadrant | BADHDUFLAG | Total packets | Discarded packets |
| A | 0 | 17 | 0 |
| B | 0 | 17 | 0 |
| C | 0 | 17 | 0 |
| D | 0 | 18 | 0 |
| Quadrant | Total seconds | Saturated seconds | Saturation percentage |
|---|---|---|---|
| A | 6196 | 53 | 0.855391% |
| B | 6196 | 89 | 1.436411% |
| C | 6196 | 90 | 1.452550% |
| D | 6196 | 218 | 3.518399% |
Noise dominated data is calculated using 1-second bins in cleaned event files. If a bin has >2000 counts, and if more than 50% of those come from <1% of pixels, then it is considered to be noise-dominated and hence unusable.
| Quadrant | # 1 sec bins | Bins with >0 counts | Bins with >2000 counts | High rate bins dominated by noise | Noise dominated (total time) | Noise dominated (detector-on time) | Marked lightcurve |
|---|---|---|---|---|---|---|---|
| A | 7507 | 6199 | 0 | 0 | 0.00% | 0.00% | 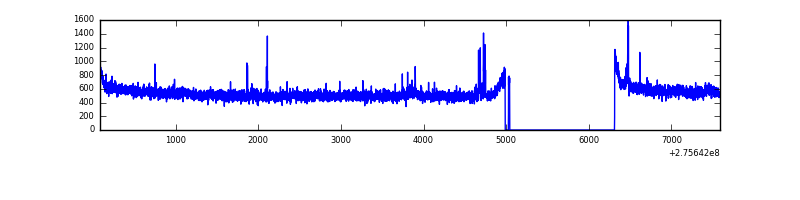 |
| B | 7507 | 6199 | 7 | 7 | 0.09% | 0.11% | 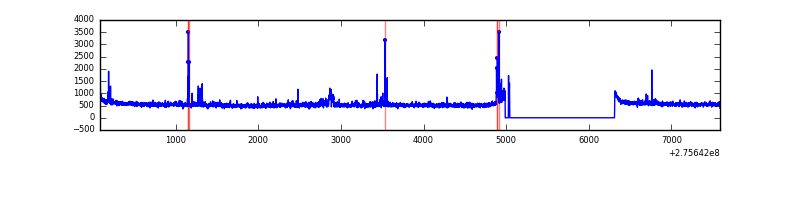 |
| C | 7507 | 6199 | 0 | 0 | 0.00% | 0.00% | 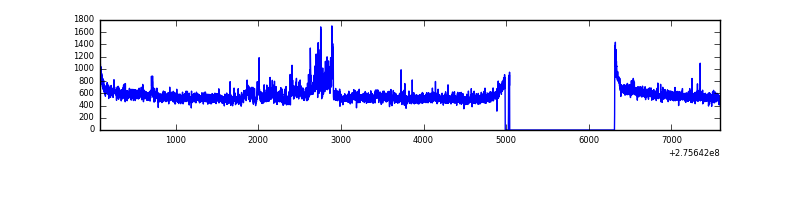 |
| D | 7507 | 6199 | 155 | 155 | 2.06% | 2.50% | 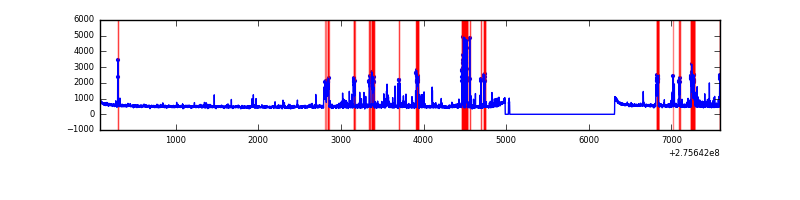 |
Top three noisy pixels from each quadrant. If the there are fewer than three noisy pixels in the level2.evt file, extra rows are filled as -1
| Pixel properties | Quadrant properties | ||||||
|---|---|---|---|---|---|---|---|
| Quadrant | DetID | PixID | Counts | Sigma | Mean | Median | Sigma |
| A | 9 | 143 | 28154 | 161.26 | 852 | 838 | 169.4 |
| A | 8 | 247 | 11579 | 63.41 | 852 | 838 | 169.4 |
| A | 15 | 174 | 8951 | 47.9 | 852 | 838 | 169.4 |
| B | 5 | 65 | 59640 | 374.93 | 836 | 818 | 156.9 |
| B | 4 | 216 | 35951 | 223.94 | 836 | 818 | 156.9 |
| B | 0 | 229 | 30928 | 191.92 | 836 | 818 | 156.9 |
| C | 3 | 233 | 288121 | 1567.75 | 798 | 807 | 183.3 |
| C | 14 | 238 | 127797 | 692.93 | 798 | 807 | 183.3 |
| C | 7 | 247 | 32328 | 172.0 | 798 | 807 | 183.3 |
| D | 1 | 52 | 727322 | 3651.51 | 815 | 792 | 199.0 |
| D | 2 | 234 | 23251 | 112.88 | 815 | 792 | 199.0 |
| D | 14 | 226 | 7913 | 35.79 | 815 | 792 | 199.0 |
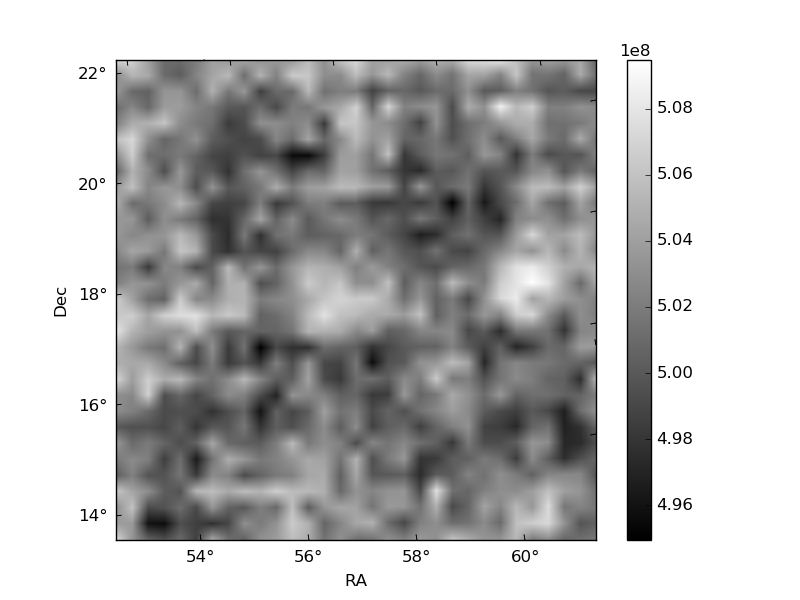
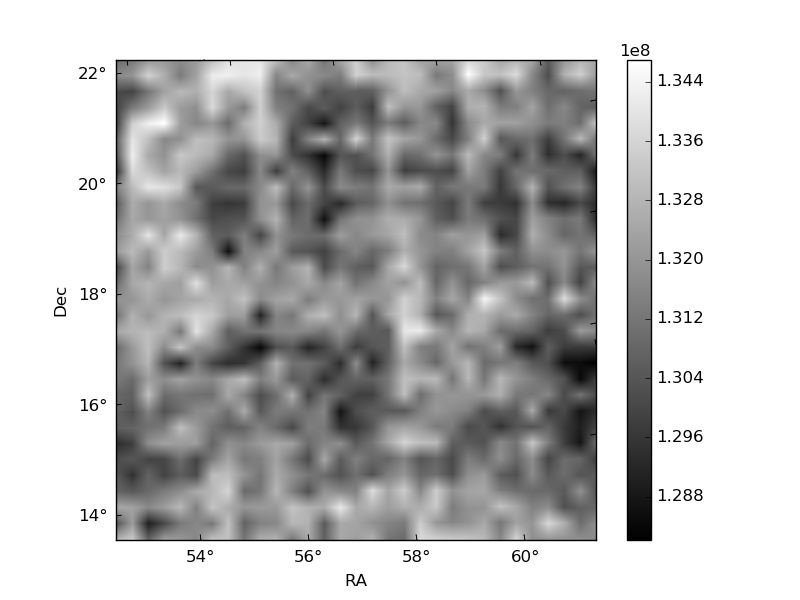
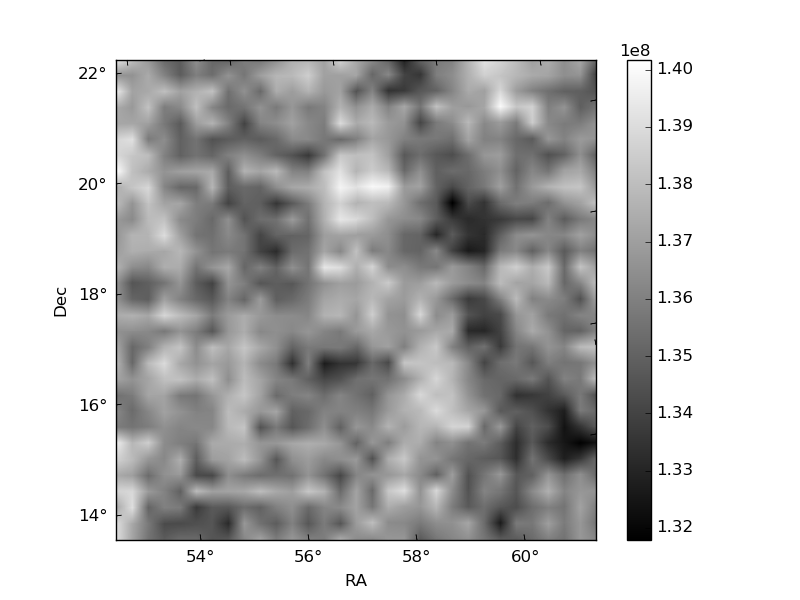
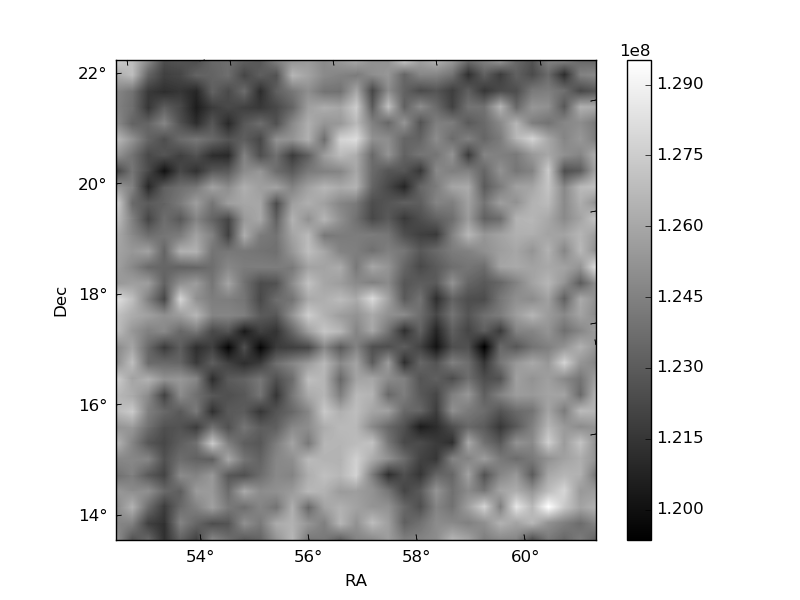
Histogram calculated using DETX and DETY for each event in the final _common_clean file
| Quadrant A | 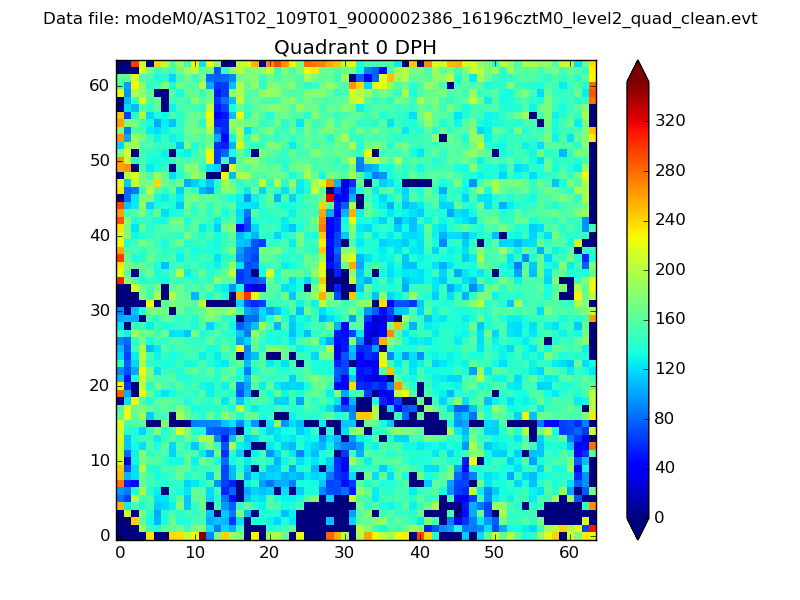 |
 |
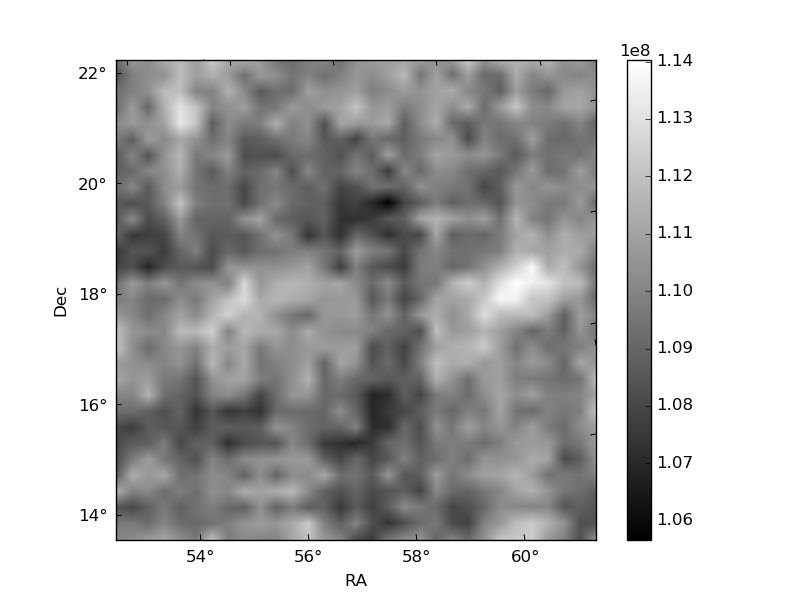
Quadrant B |
|---|---|---|---|
| Quadrant D | 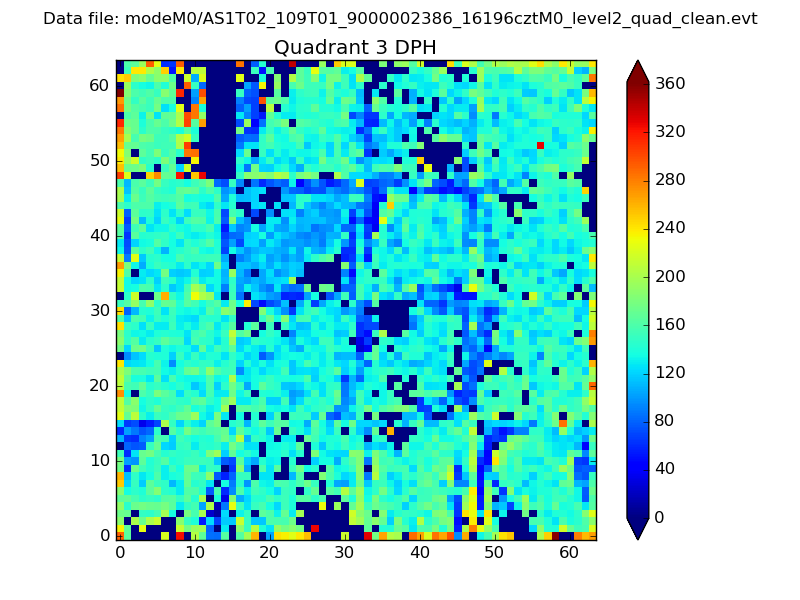 |
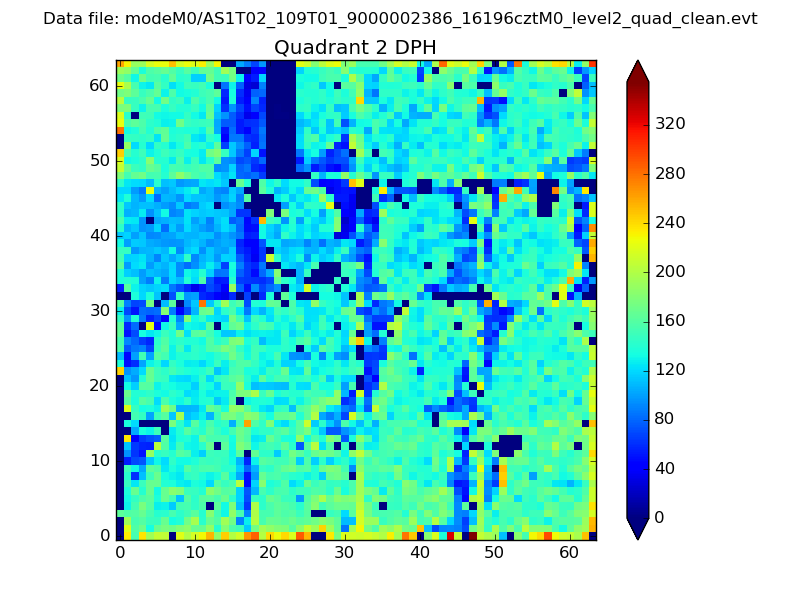 |
Quadrant C |
| Plot type | Count rate plots | Images |
|---|---|---|
| Comparison with Poisson distribution Blue bars denote a histogram of data divided into 1 sec bins. Red curve is a Poisson curve with rate = median count rate of data. |
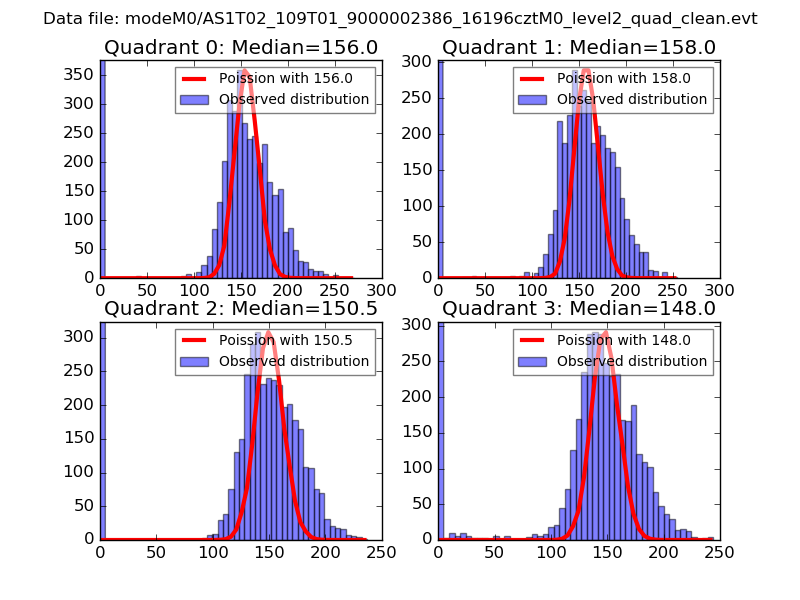 |
 |
| Quadrant-wise count rates Data is divided into 100 sec bins |
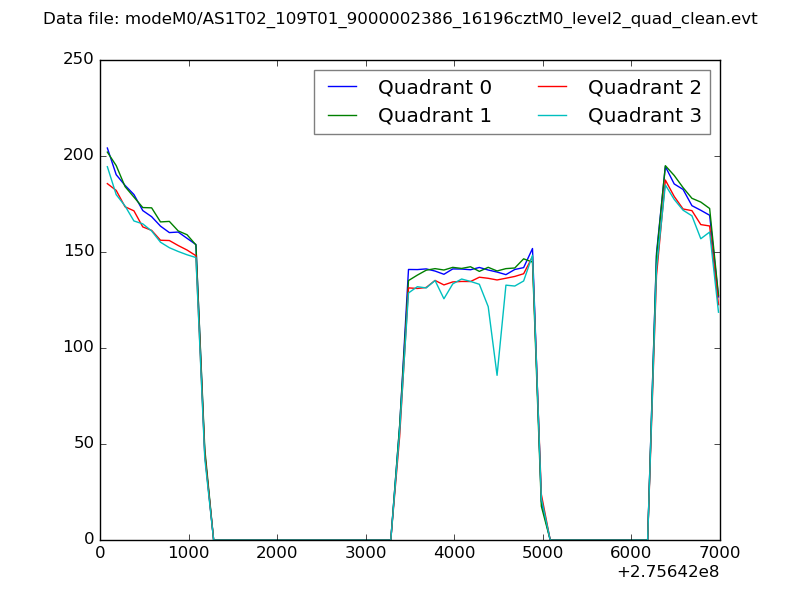 |
|
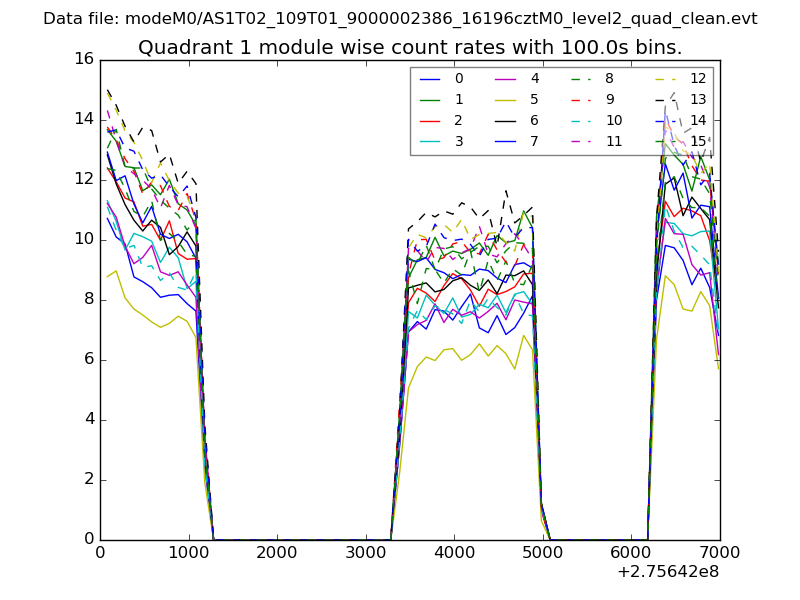
| Module-wise count rates for Quadrant A Data is divided into 100 sec bins |
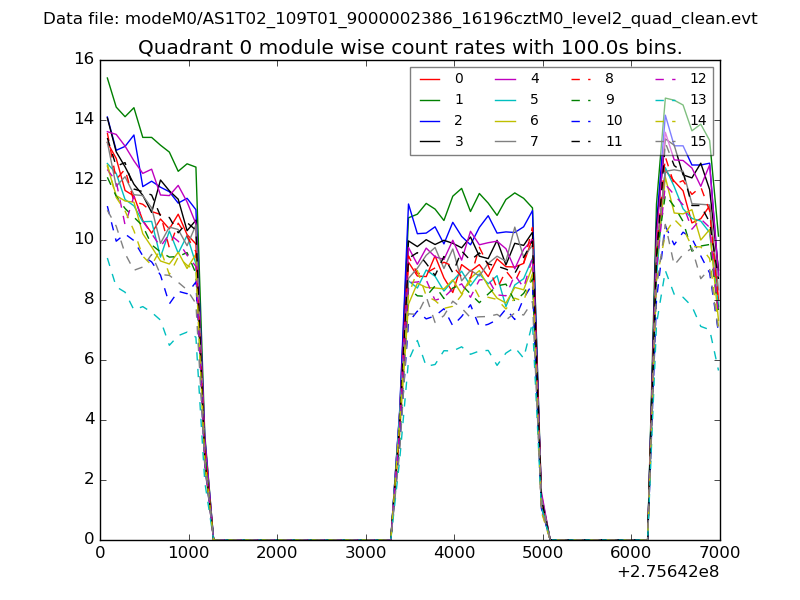 |
 |
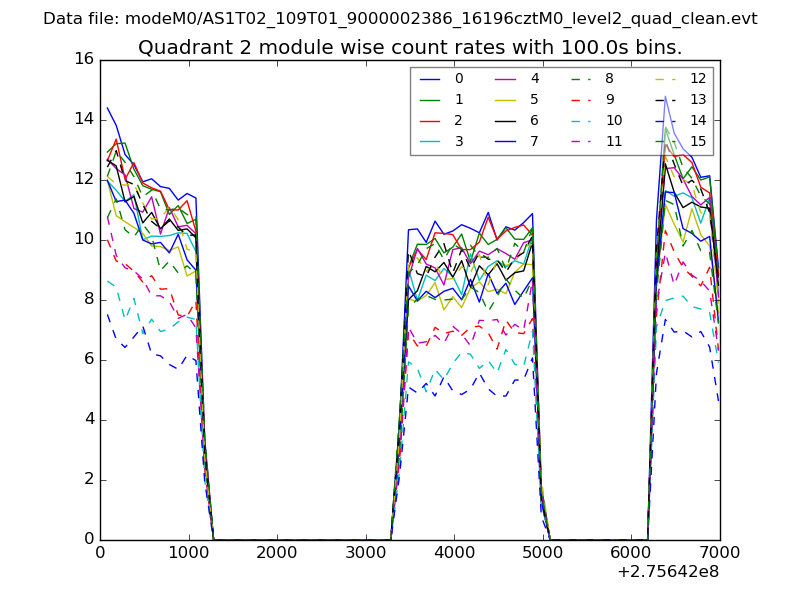
| Module-wise count rates for Quadrant B Data is divided into 100 sec bins |
 |
 |
| Module-wise count rates for Quadrant C Data is divided into 100 sec bins |
 |
 |
| Module-wise count rates for Quadrant D Data is divided into 100 sec bins |
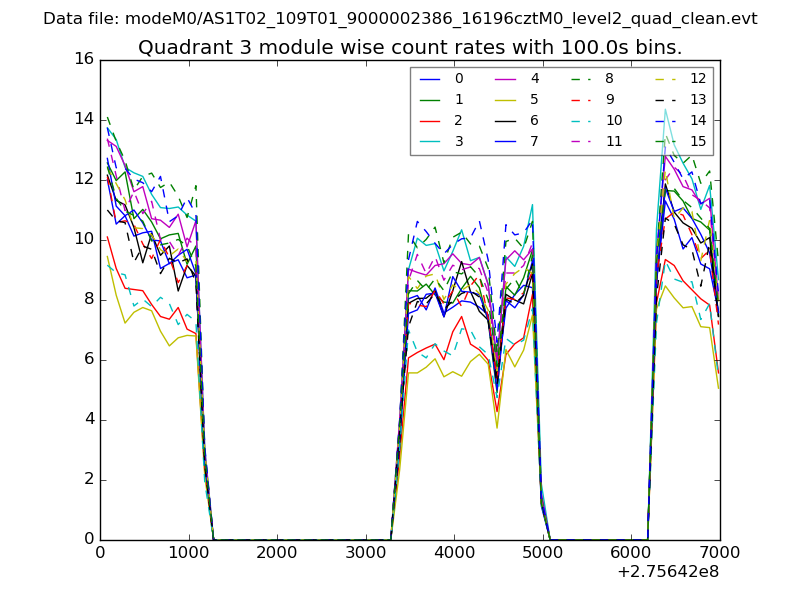 |
 |
| Parameter | Plot |
|---|---|
| CZT HV Monitor | 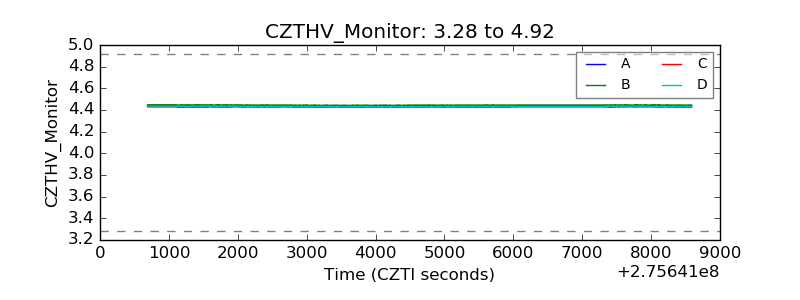 |
| D_VDD | 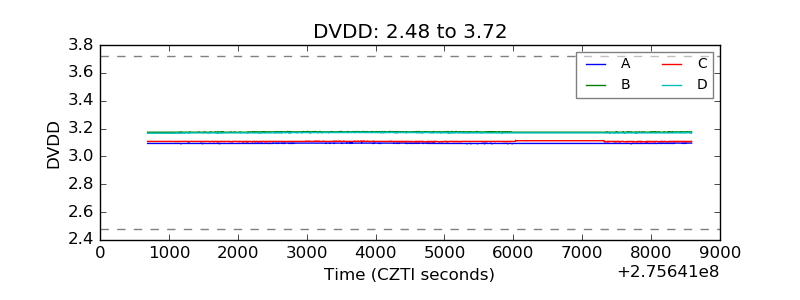 |
| Temperature 1 | 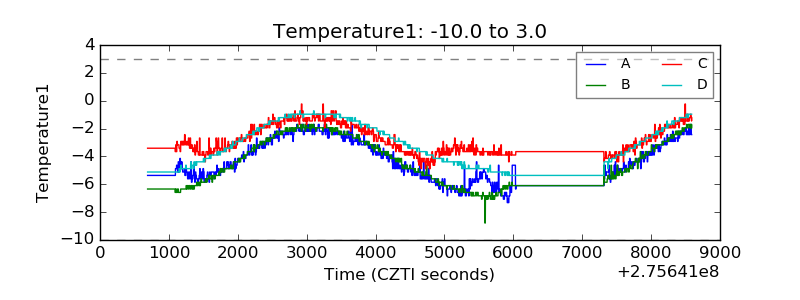 |
| Veto HV Monitor | 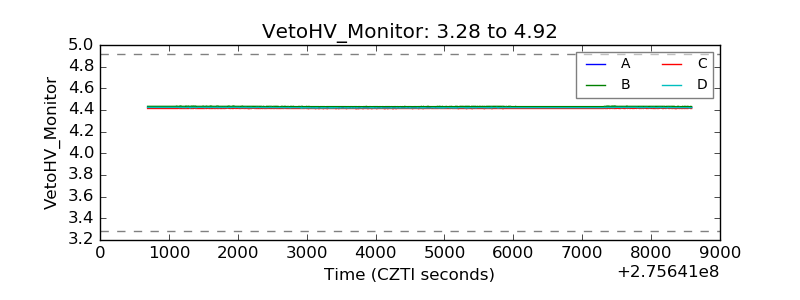 |
| Veto LLD | 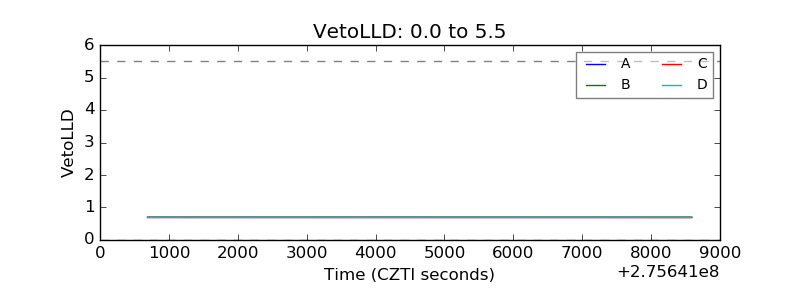 |
| Alpha Counter | 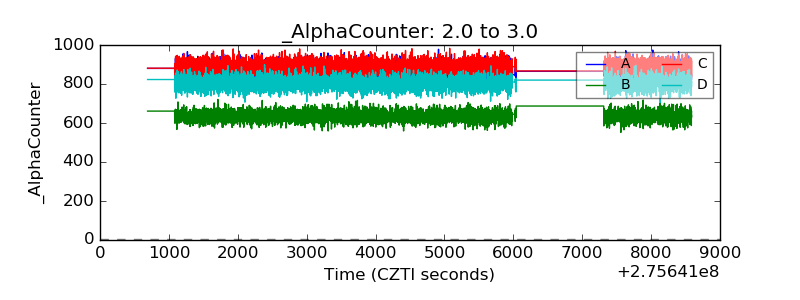 |
| _CPM_Rate |  |
| CZT Counter | 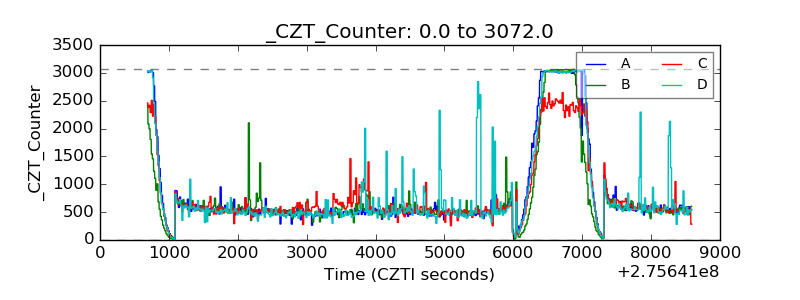 |
| +2.5 Volts monitor | 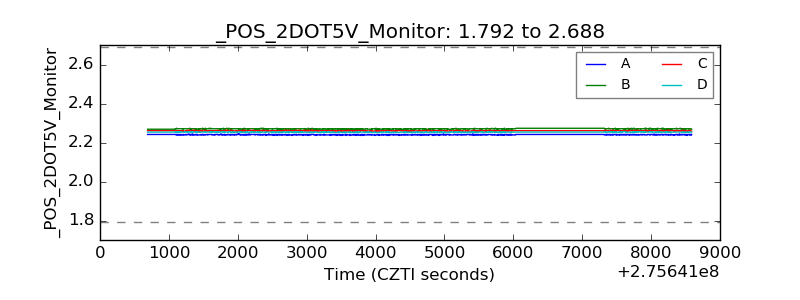 |
| +5 Volts monitor | 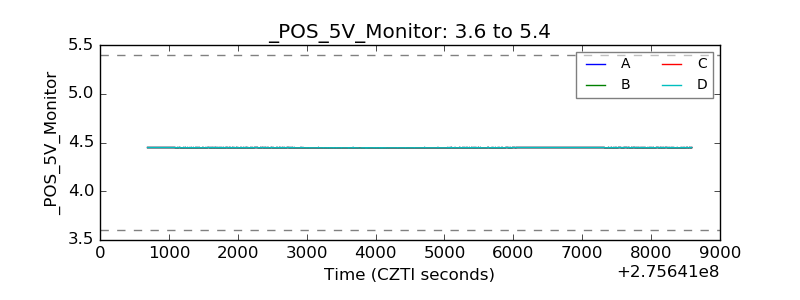 |
| _ROLL_ROT | 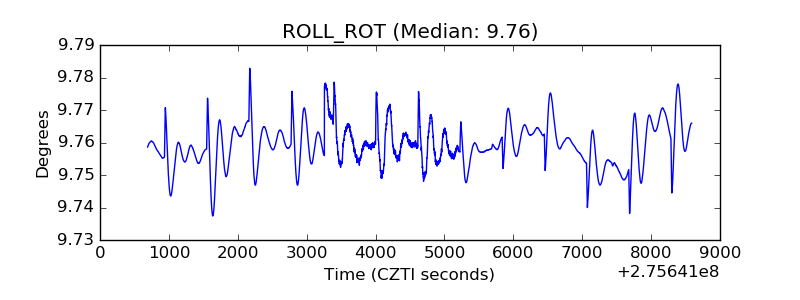 |
| _Roll_DEC |  |
| _Roll_RA | 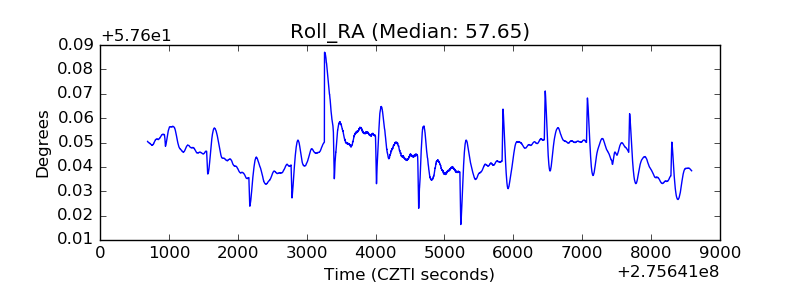 |
| Veto Counter | 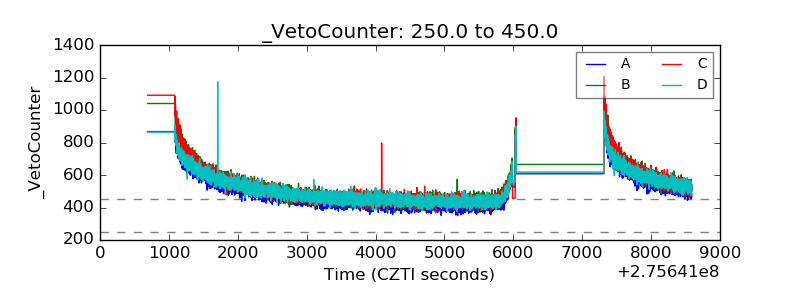 |