| Param | Original file | Final file |
|---|---|---|
| Filename | modeM0/AS1T02_109T01_9000002386_16197cztM0_level2.evt | modeM0/AS1T02_109T01_9000002386_16197cztM0_level2_quad_clean.evt |
| Size (bytes) | 523,031,040 | 76,003,200 |
| Size | 498.8 MB | 72.5 MB |
| Events in quadrant A | 3,516,623 | 472,462 |
| Events in quadrant B | 3,746,424 | 478,313 |
| Events in quadrant C | 3,493,760 | 455,553 |
| Events in quadrant D | 4,642,473 | 441,932 |
| Mode M0 | |||
|---|---|---|---|
| Quadrant | BADHDUFLAG | Total packets | Discarded packets |
| A | 0 | 14261 | 3 |
| B | 0 | 14900 | 2 |
| C | 0 | 14052 | 2 |
| D | 0 | 17908 | 2 |
| Mode SS | |||
|---|---|---|---|
| Quadrant | BADHDUFLAG | Total packets | Discarded packets |
| A | 0 | 132 | 0 |
| B | 0 | 132 | 0 |
| C | 0 | 132 | 0 |
| D | 0 | 132 | 0 |
| Mode M9 | |||
|---|---|---|---|
| Quadrant | BADHDUFLAG | Total packets | Discarded packets |
| A | 0 | 18 | 0 |
| B | 0 | 18 | 0 |
| C | 0 | 18 | 0 |
| D | 0 | 19 | 0 |
| Quadrant | Total seconds | Saturated seconds | Saturation percentage |
|---|---|---|---|
| A | 6496 | 120 | 1.847291% |
| B | 6496 | 141 | 2.170567% |
| C | 6496 | 127 | 1.955049% |
| D | 6496 | 452 | 6.958128% |
Noise dominated data is calculated using 1-second bins in cleaned event files. If a bin has >2000 counts, and if more than 50% of those come from <1% of pixels, then it is considered to be noise-dominated and hence unusable.
| Quadrant | # 1 sec bins | Bins with >0 counts | Bins with >2000 counts | High rate bins dominated by noise | Noise dominated (total time) | Noise dominated (detector-on time) | Marked lightcurve |
|---|---|---|---|---|---|---|---|
| A | 7797 | 6498 | 4 | 4 | 0.05% | 0.06% | 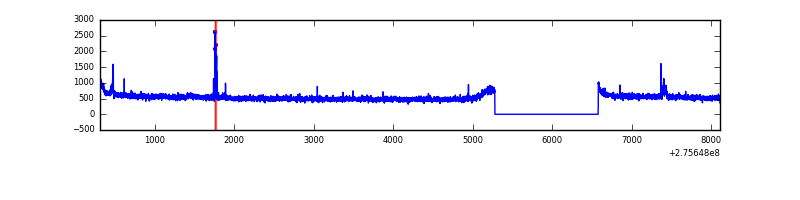 |
| B | 7797 | 6498 | 30 | 30 | 0.38% | 0.46% | 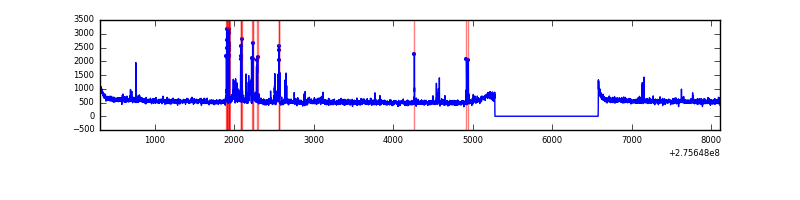 |
| C | 7797 | 6498 | 0 | 0 | 0.00% | 0.00% | 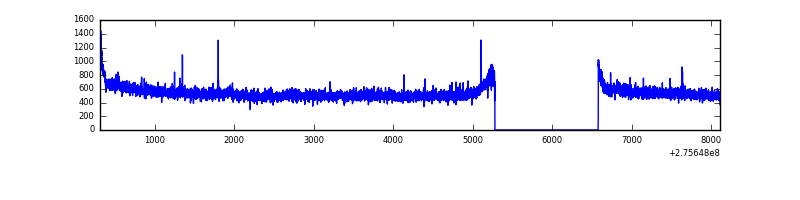 |
| D | 7797 | 6497 | 264 | 264 | 3.39% | 4.06% | 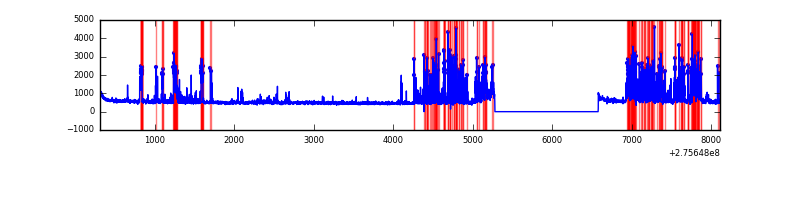 |
Top three noisy pixels from each quadrant. If the there are fewer than three noisy pixels in the level2.evt file, extra rows are filled as -1
| Pixel properties | Quadrant properties | ||||||
|---|---|---|---|---|---|---|---|
| Quadrant | DetID | PixID | Counts | Sigma | Mean | Median | Sigma |
| A | 15 | 157 | 50682 | 278.65 | 894 | 879 | 178.7 |
| A | 8 | 247 | 22454 | 120.71 | 894 | 879 | 178.7 |
| A | 9 | 143 | 12067 | 62.6 | 894 | 879 | 178.7 |
| B | 5 | 65 | 236805 | 1428.07 | 879 | 861 | 165.2 |
| B | 0 | 229 | 25596 | 149.71 | 879 | 861 | 165.2 |
| B | 3 | 209 | 24757 | 144.63 | 879 | 861 | 165.2 |
| C | 14 | 238 | 134705 | 691.47 | 842 | 849 | 193.6 |
| C | 3 | 233 | 54687 | 278.12 | 842 | 849 | 193.6 |
| C | 0 | 207 | 10810 | 51.46 | 842 | 849 | 193.6 |
| D | 2 | 233 | 1079728 | 5211.9 | 848 | 822 | 207.0 |
| D | 1 | 52 | 306057 | 1474.51 | 848 | 822 | 207.0 |
| D | 2 | 234 | 24824 | 115.95 | 848 | 822 | 207.0 |
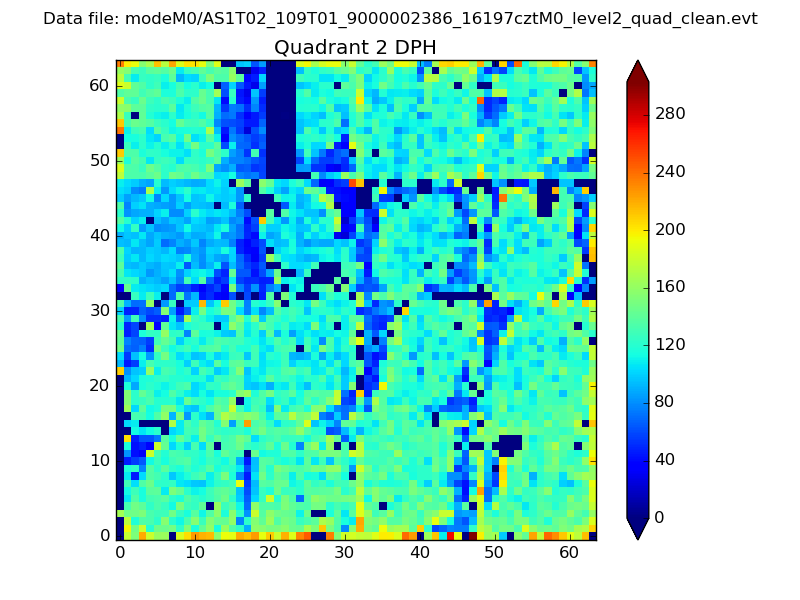
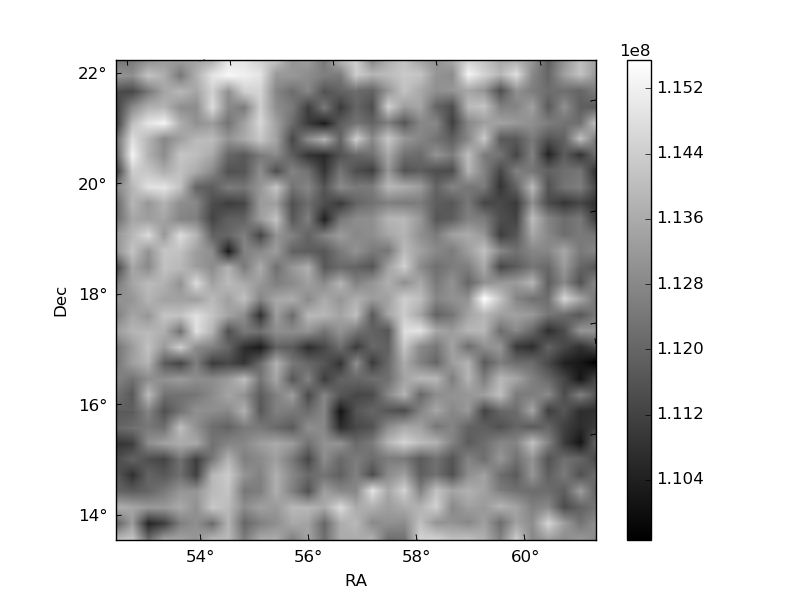
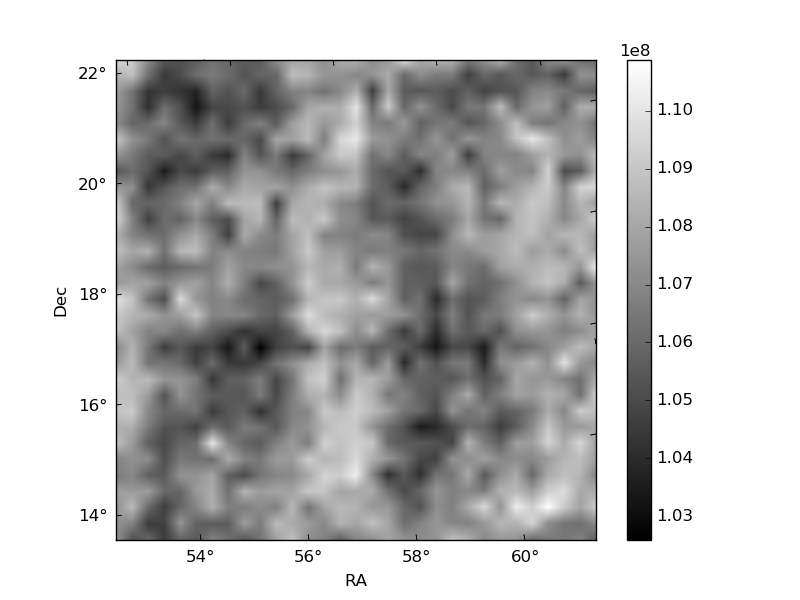
Histogram calculated using DETX and DETY for each event in the final _common_clean file
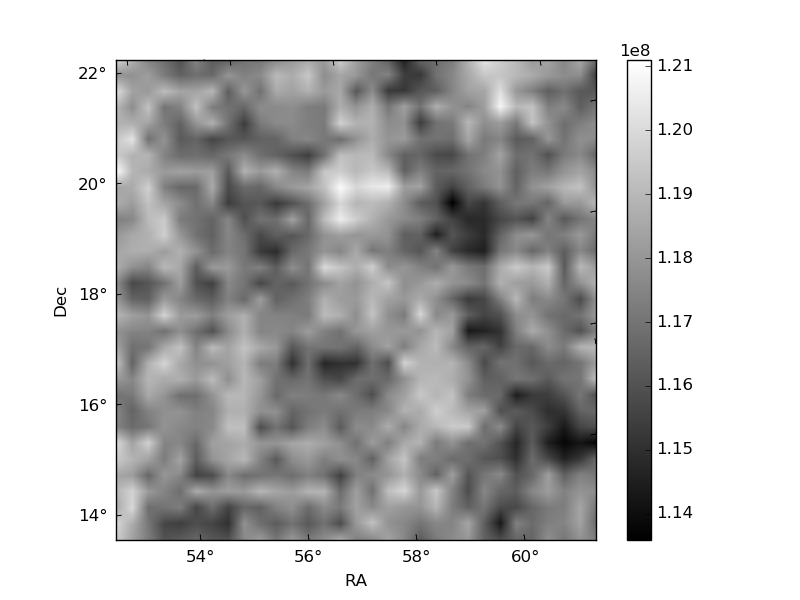
| Quadrant A | 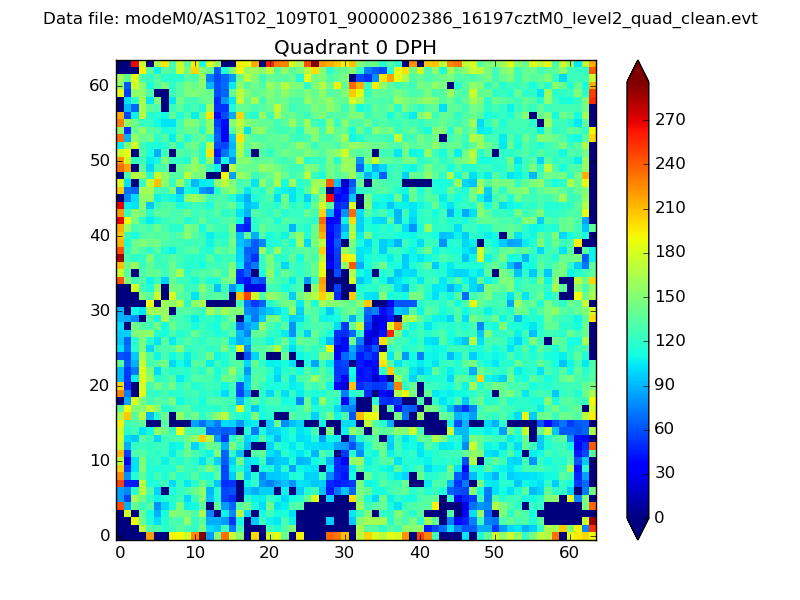 |
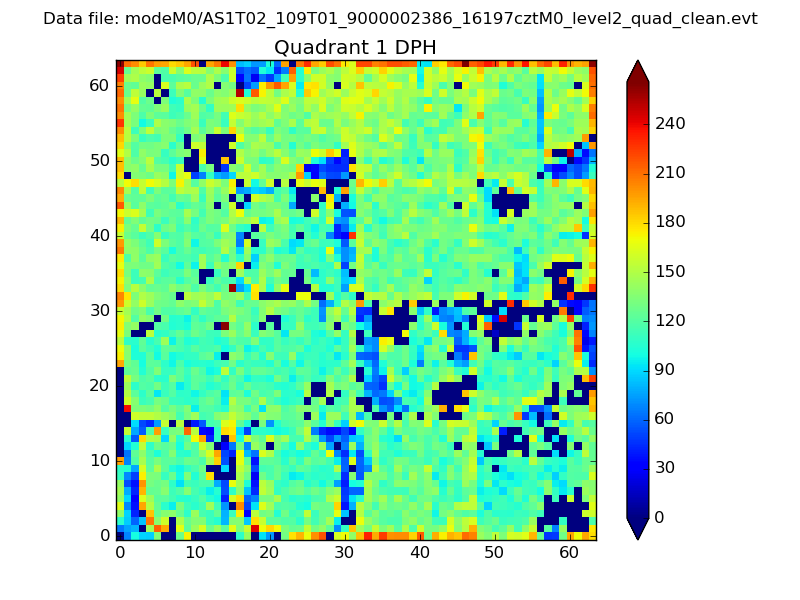 |
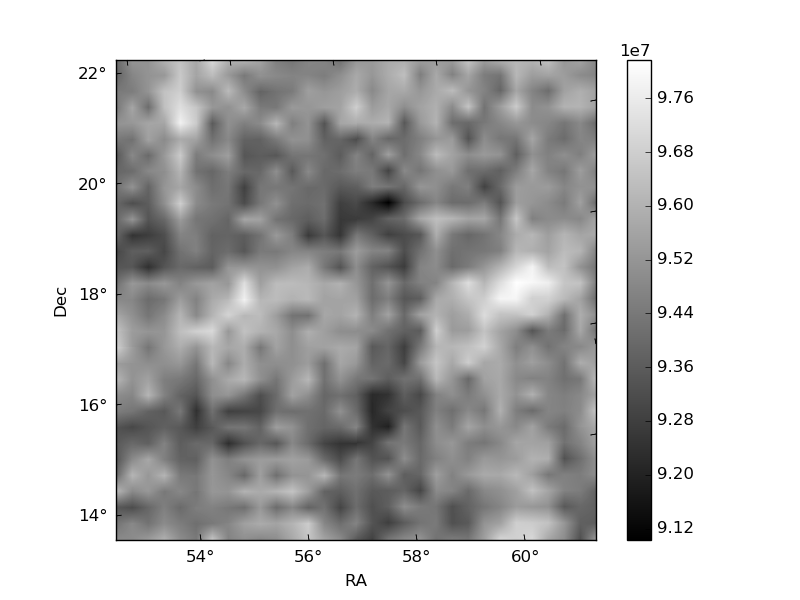
Quadrant B |
|---|---|---|---|
| Quadrant D | 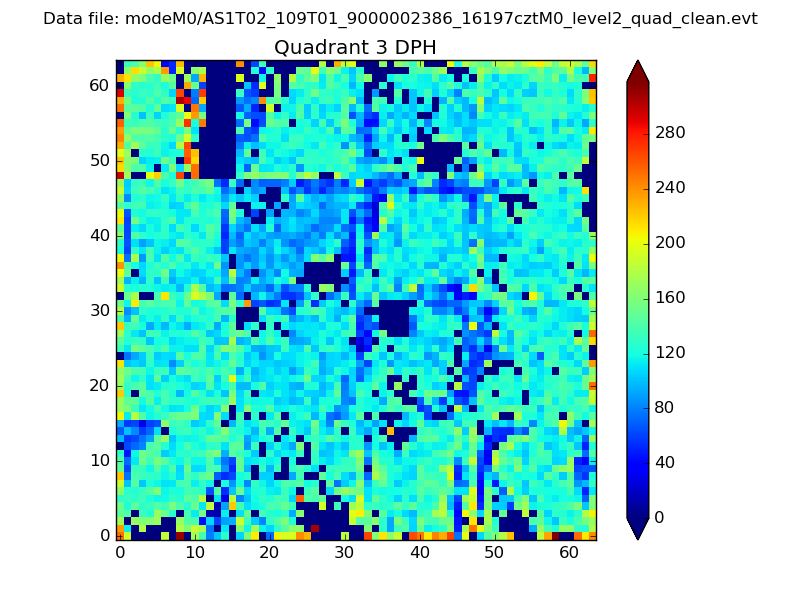 |
 |
Quadrant C |
| Plot type | Count rate plots | Images |
|---|---|---|
| Comparison with Poisson distribution Blue bars denote a histogram of data divided into 1 sec bins. Red curve is a Poisson curve with rate = median count rate of data. |
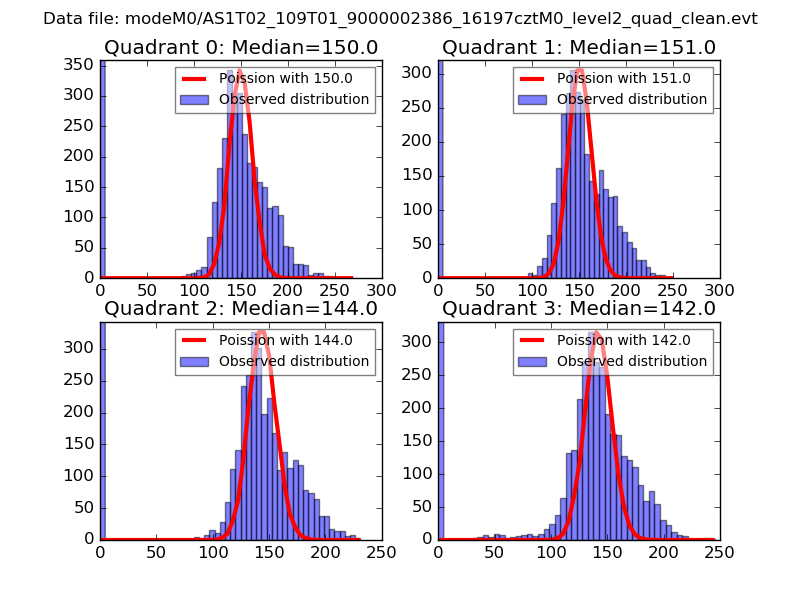 |
 |
| Quadrant-wise count rates Data is divided into 100 sec bins |
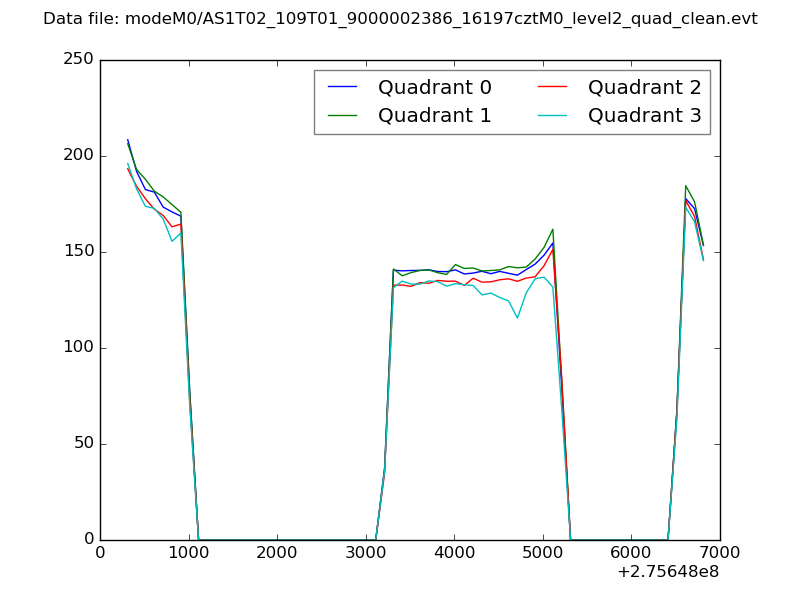 |
|
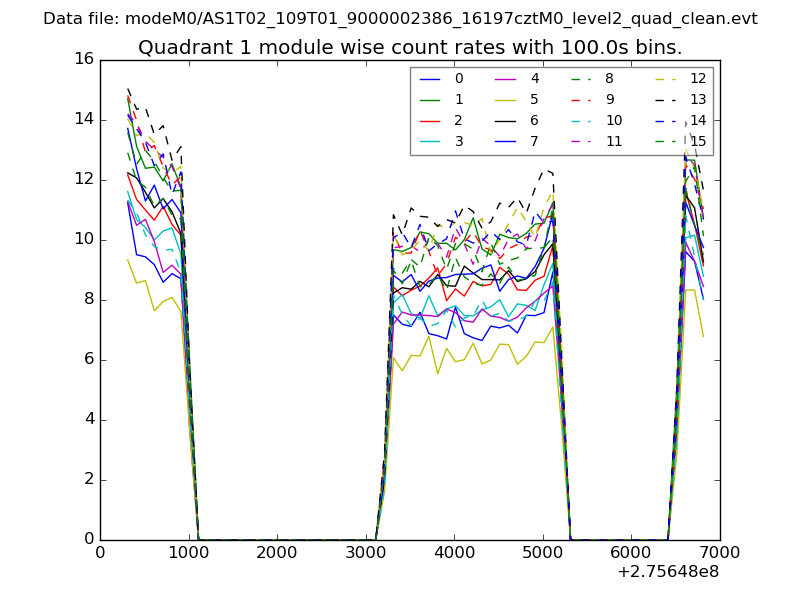
| Module-wise count rates for Quadrant A Data is divided into 100 sec bins |
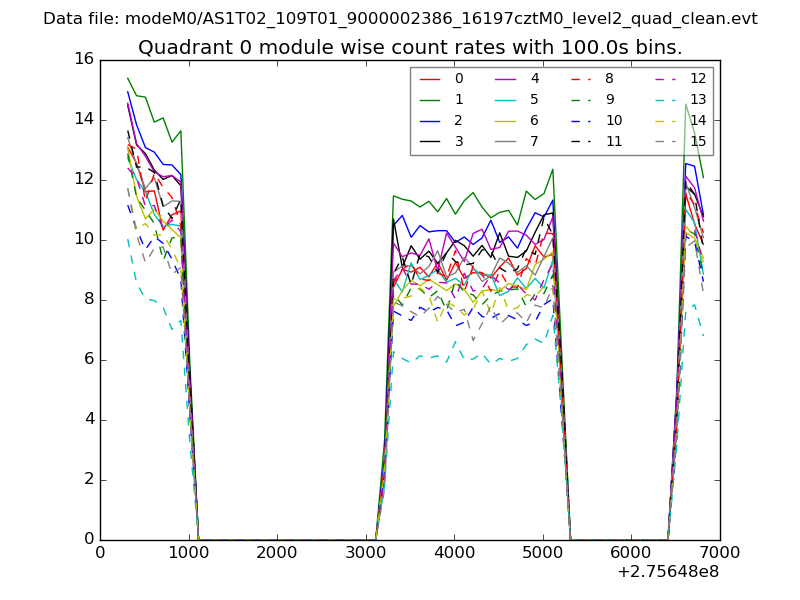 |
 |
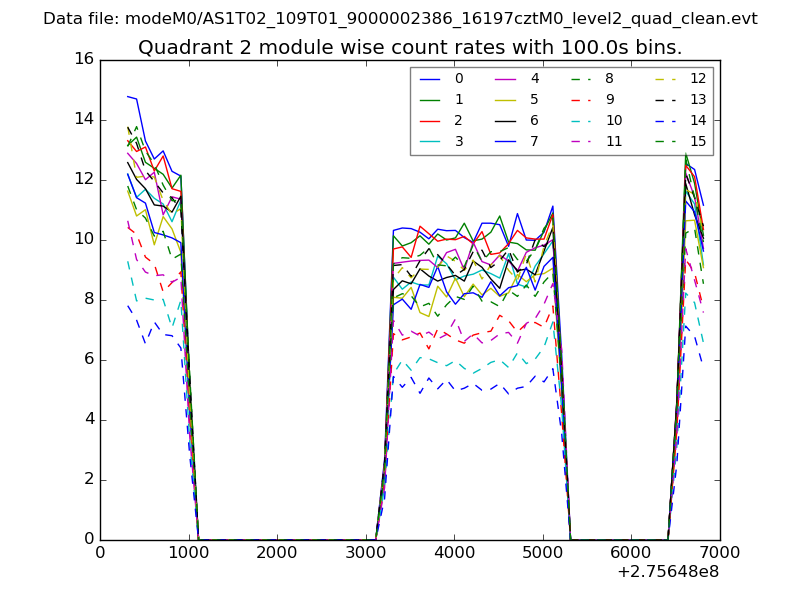
| Module-wise count rates for Quadrant B Data is divided into 100 sec bins |
 |
 |
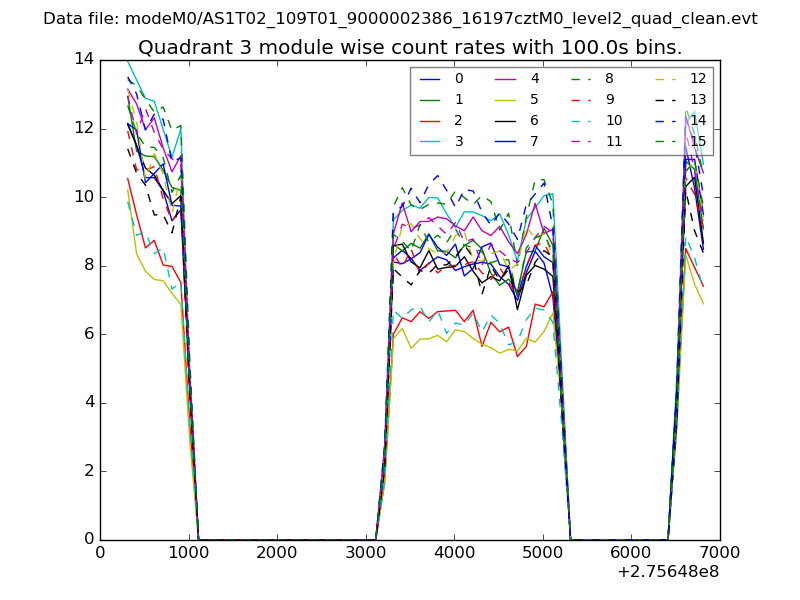
| Module-wise count rates for Quadrant C Data is divided into 100 sec bins |
 |
 |
| Module-wise count rates for Quadrant D Data is divided into 100 sec bins |
 |
 |
| Parameter | Plot |
|---|---|
| CZT HV Monitor | 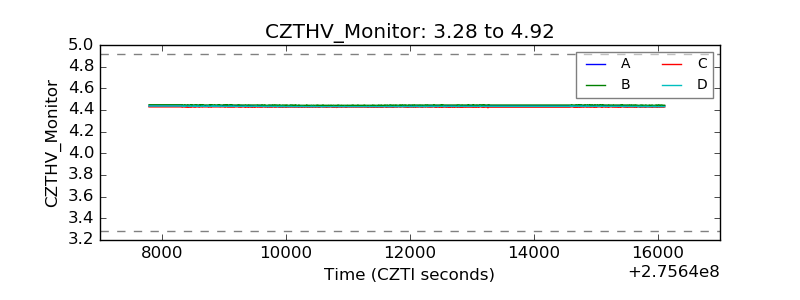 |
| D_VDD | 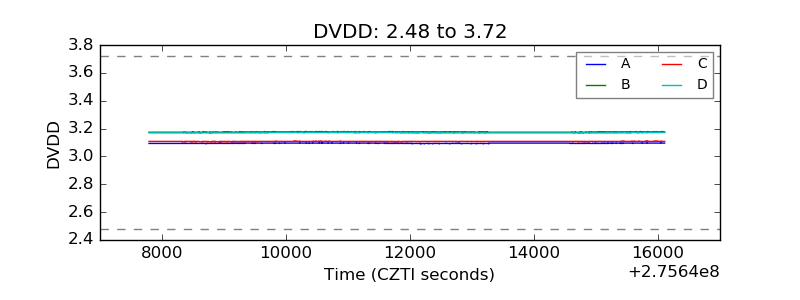 |
| Temperature 1 |  |
| Veto HV Monitor | 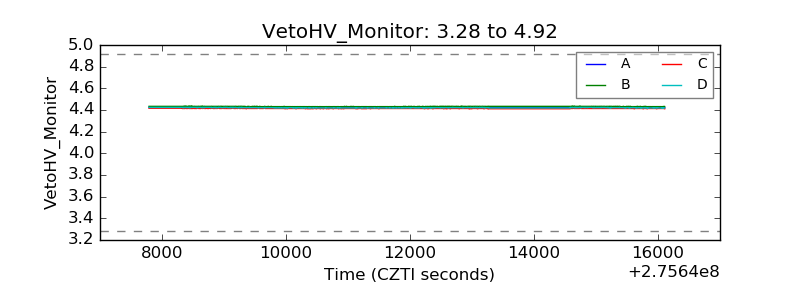 |
| Veto LLD | 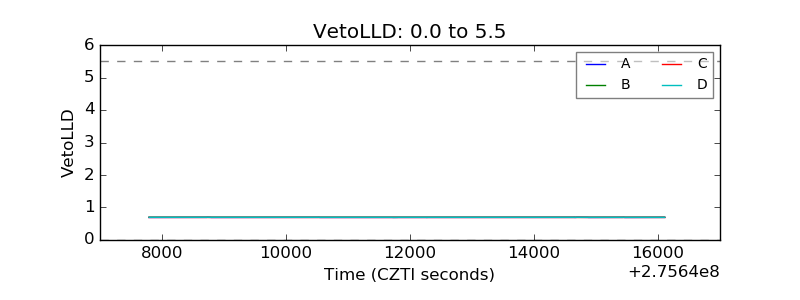 |
| Alpha Counter | 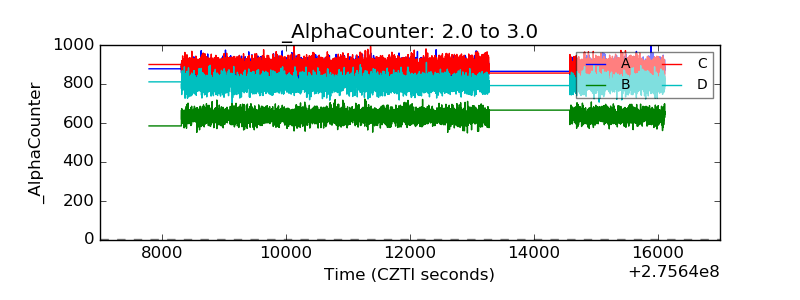 |
| _CPM_Rate | 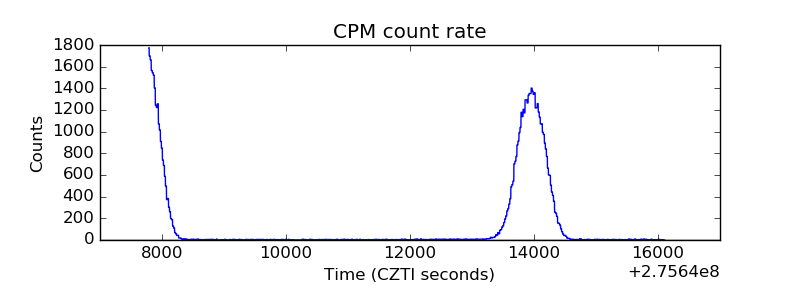 |
| CZT Counter |  |
| +2.5 Volts monitor |  |
| +5 Volts monitor |  |
| _ROLL_ROT | 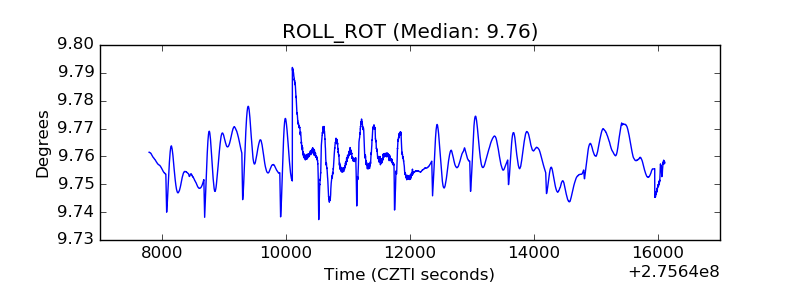 |
| _Roll_DEC | 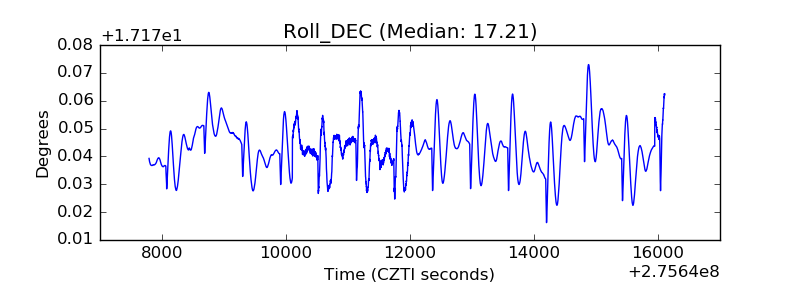 |
| _Roll_RA | 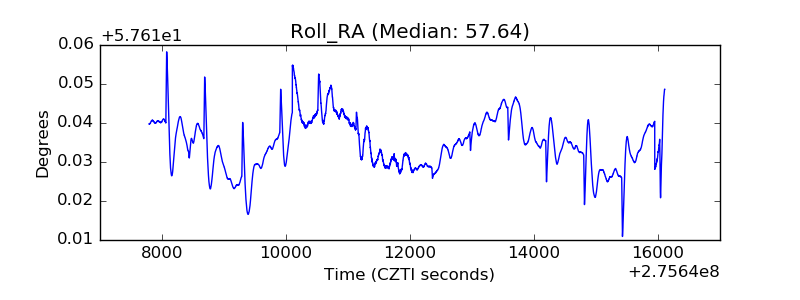 |
| Veto Counter | 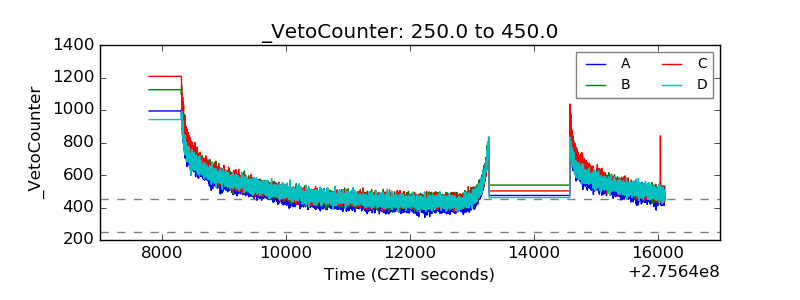 |