| Param | Original file | Final file |
|---|---|---|
| Filename | modeM0/AS1T02_109T01_9000002386_16198cztM0_level2.evt | modeM0/AS1T02_109T01_9000002386_16198cztM0_level2_quad_clean.evt |
| Size (bytes) | 541,008,000 | 67,579,200 |
| Size | 515.9 MB | 64.4 MB |
| Events in quadrant A | 3,511,111 | 401,707 |
| Events in quadrant B | 3,957,380 | 404,355 |
| Events in quadrant C | 3,513,413 | 390,182 |
| Events in quadrant D | 4,950,723 | 385,550 |
| Mode M0 | |||
|---|---|---|---|
| Quadrant | BADHDUFLAG | Total packets | Discarded packets |
| A | 0 | 14349 | 3 |
| B | 0 | 15679 | 2 |
| C | 0 | 14246 | 2 |
| D | 0 | 19153 | 2 |
| Mode SS | |||
|---|---|---|---|
| Quadrant | BADHDUFLAG | Total packets | Discarded packets |
| A | 0 | 136 | 0 |
| B | 0 | 136 | 0 |
| C | 0 | 136 | 0 |
| D | 0 | 136 | 0 |
| Mode M9 | |||
|---|---|---|---|
| Quadrant | BADHDUFLAG | Total packets | Discarded packets |
| A | 0 | 15 | 0 |
| B | 0 | 15 | 0 |
| C | 0 | 15 | 0 |
| D | 0 | 16 | 0 |
| Quadrant | Total seconds | Saturated seconds | Saturation percentage |
|---|---|---|---|
| A | 6657 | 151 | 2.268289% |
| B | 6657 | 240 | 3.605228% |
| C | 6657 | 166 | 2.493616% |
| D | 6657 | 576 | 8.652546% |
Noise dominated data is calculated using 1-second bins in cleaned event files. If a bin has >2000 counts, and if more than 50% of those come from <1% of pixels, then it is considered to be noise-dominated and hence unusable.
| Quadrant | # 1 sec bins | Bins with >0 counts | Bins with >2000 counts | High rate bins dominated by noise | Noise dominated (total time) | Noise dominated (detector-on time) | Marked lightcurve |
|---|---|---|---|---|---|---|---|
| A | 7788 | 6659 | 0 | 0 | 0.00% | 0.00% | 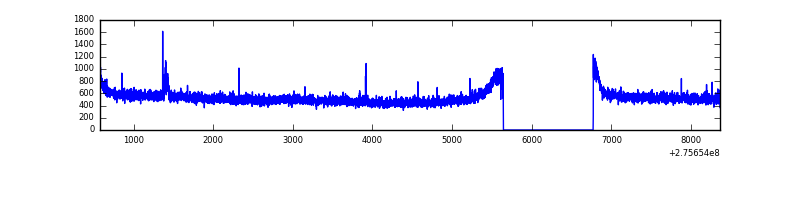 |
| B | 7788 | 6659 | 63 | 63 | 0.81% | 0.95% | 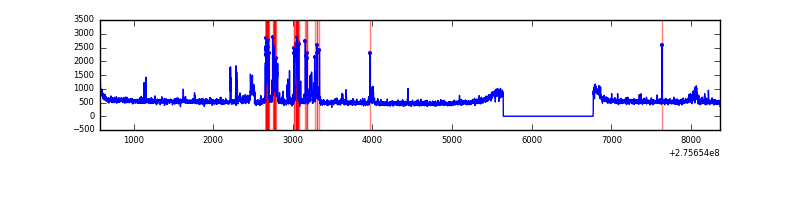 |
| C | 7788 | 6659 | 4 | 4 | 0.05% | 0.06% | 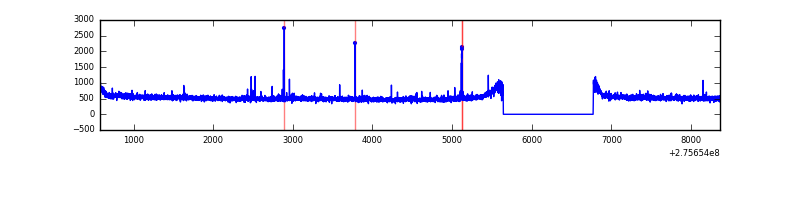 |
| D | 7788 | 6659 | 278 | 278 | 3.57% | 4.17% | 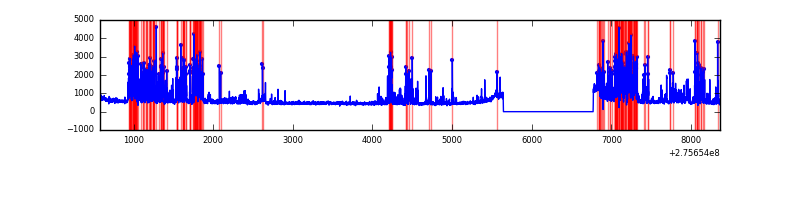 |
Top three noisy pixels from each quadrant. If the there are fewer than three noisy pixels in the level2.evt file, extra rows are filled as -1
| Pixel properties | Quadrant properties | ||||||
|---|---|---|---|---|---|---|---|
| Quadrant | DetID | PixID | Counts | Sigma | Mean | Median | Sigma |
| A | 8 | 247 | 41652 | 224.39 | 896 | 878 | 181.7 |
| A | 15 | 157 | 16462 | 85.76 | 896 | 878 | 181.7 |
| A | 0 | 226 | 7985 | 39.11 | 896 | 878 | 181.7 |
| B | 5 | 65 | 356816 | 2125.06 | 882 | 864 | 167.5 |
| B | 4 | 216 | 84477 | 499.17 | 882 | 864 | 167.5 |
| B | 0 | 189 | 22881 | 131.44 | 882 | 864 | 167.5 |
| C | 14 | 238 | 132903 | 675.59 | 850 | 857 | 195.5 |
| C | 0 | 207 | 33451 | 166.76 | 850 | 857 | 195.5 |
| C | 3 | 233 | 23608 | 116.4 | 850 | 857 | 195.5 |
| D | 2 | 233 | 1552364 | 7455.97 | 854 | 828 | 208.1 |
| D | 1 | 52 | 128000 | 611.13 | 854 | 828 | 208.1 |
| D | 2 | 234 | 26832 | 124.96 | 854 | 828 | 208.1 |
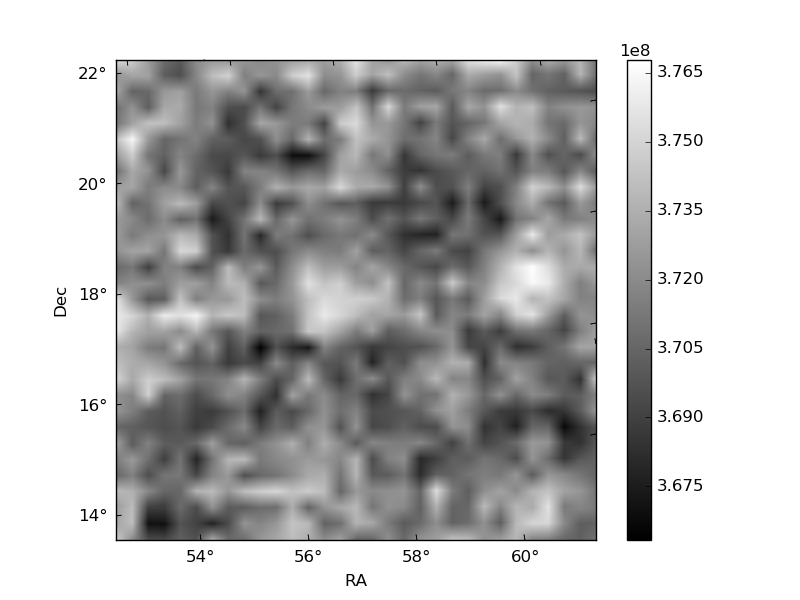
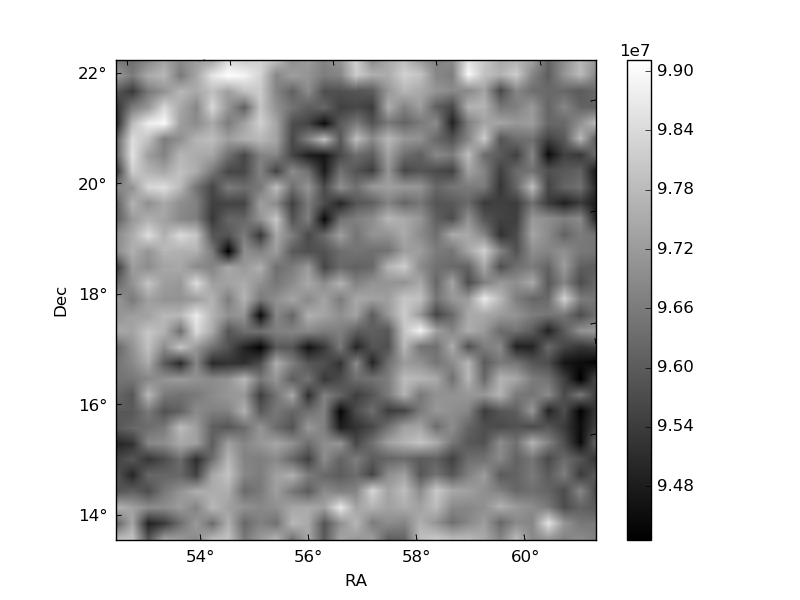
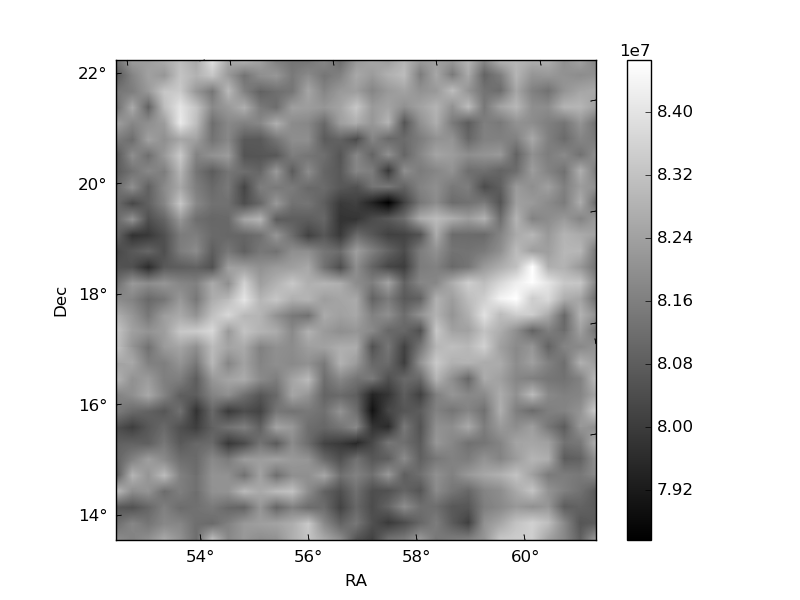
Histogram calculated using DETX and DETY for each event in the final _common_clean file
| Quadrant A | 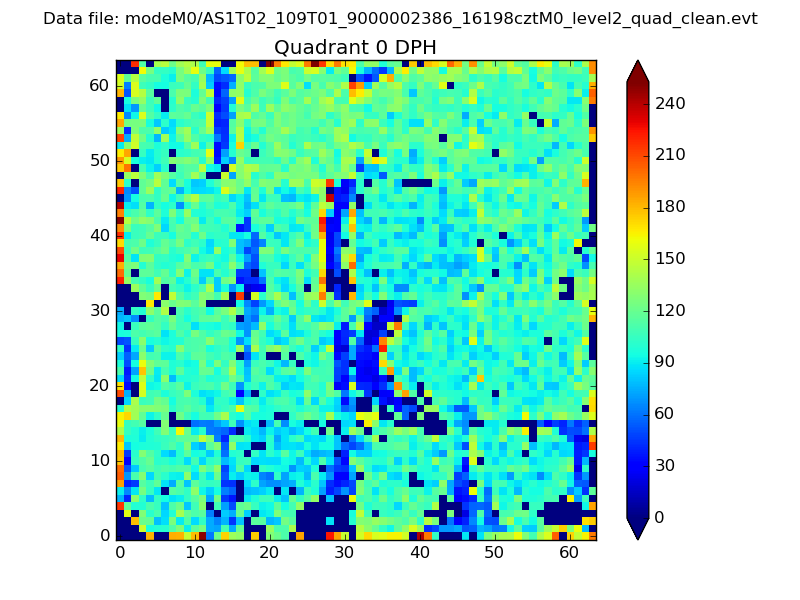 |
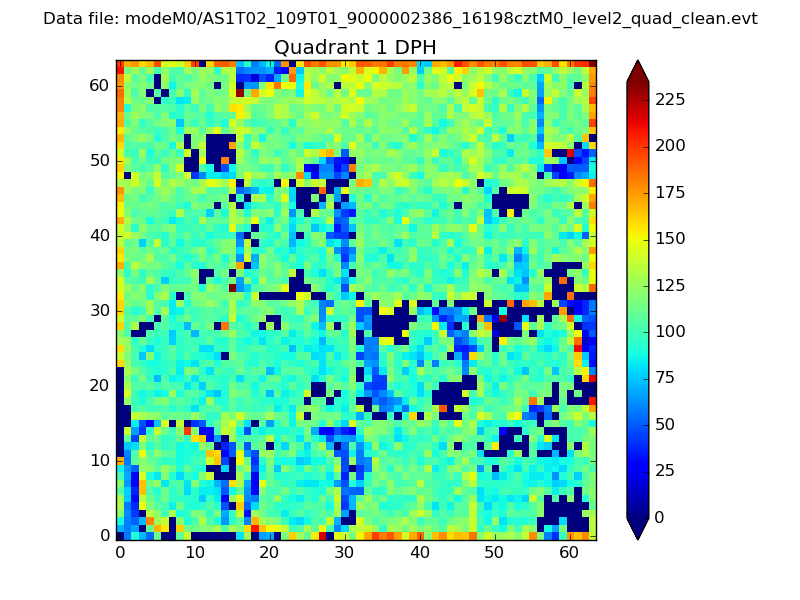 |
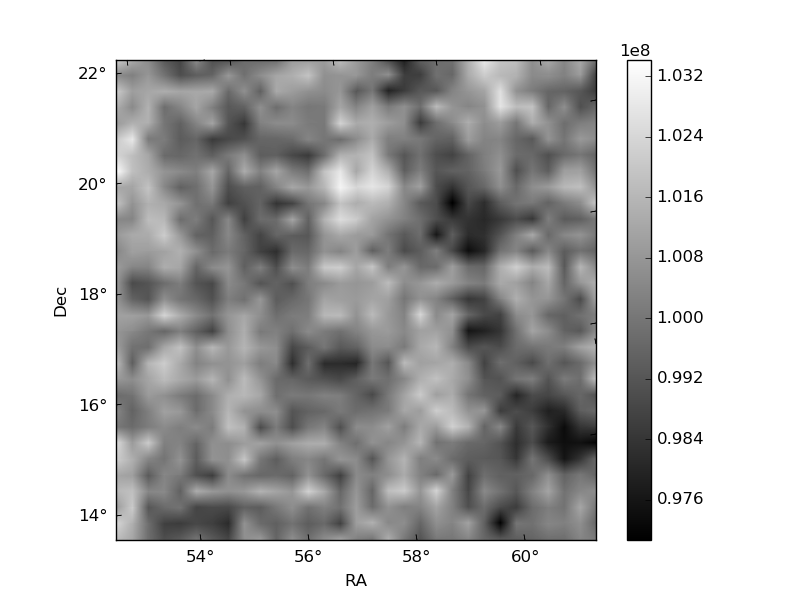
Quadrant B |
|---|---|---|---|
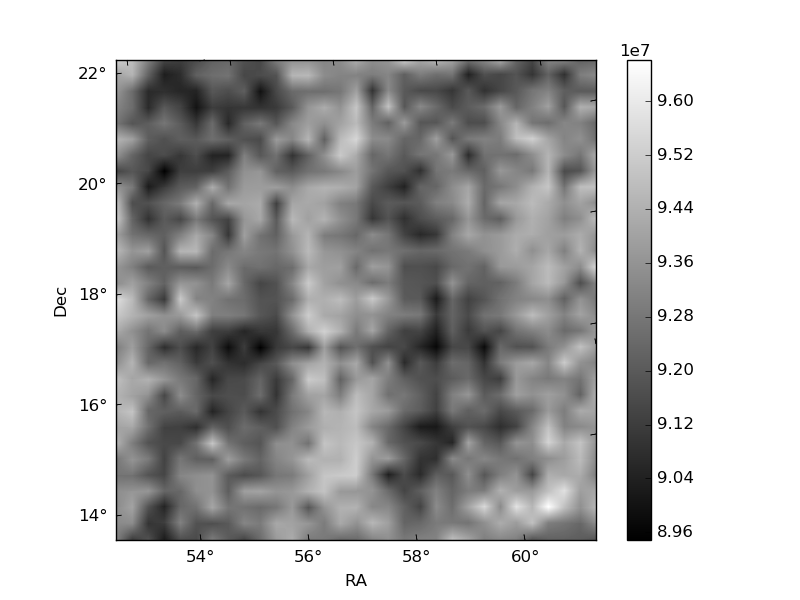
| Quadrant D | 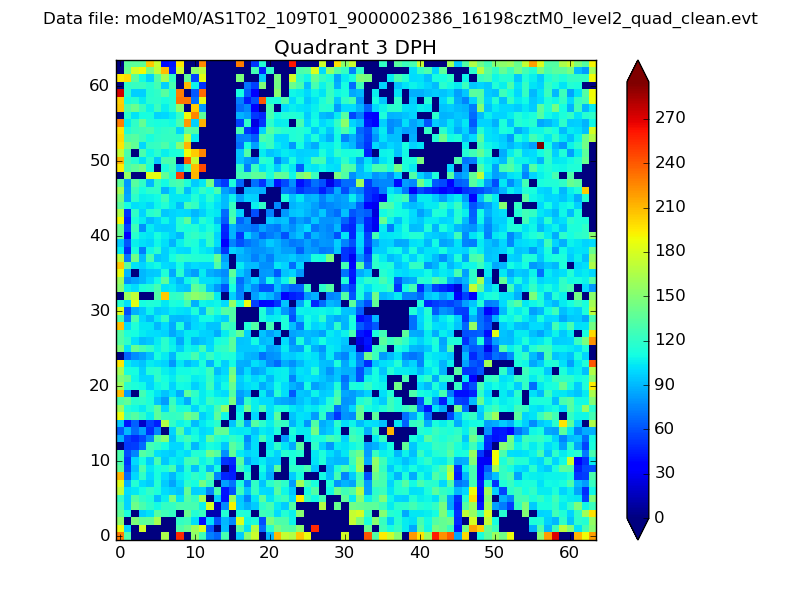 |
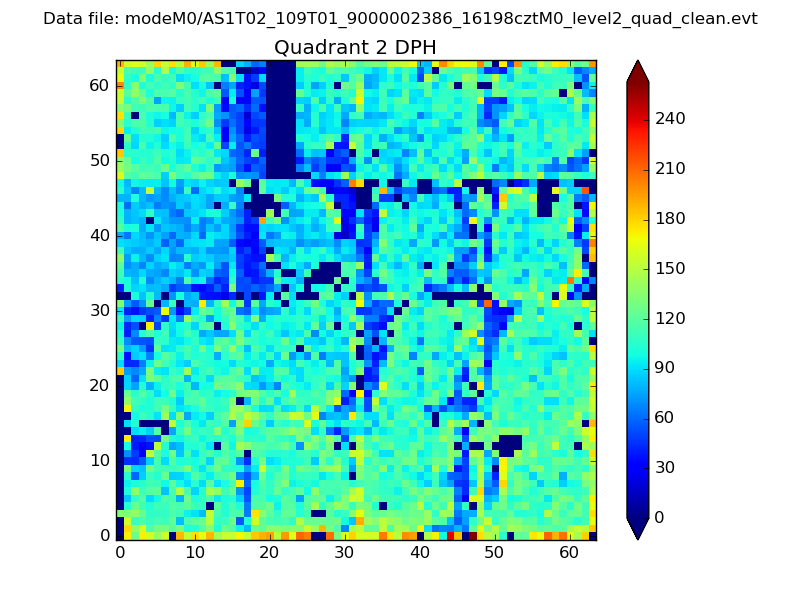 |
Quadrant C |
| Plot type | Count rate plots | Images |
|---|---|---|
| Comparison with Poisson distribution Blue bars denote a histogram of data divided into 1 sec bins. Red curve is a Poisson curve with rate = median count rate of data. |
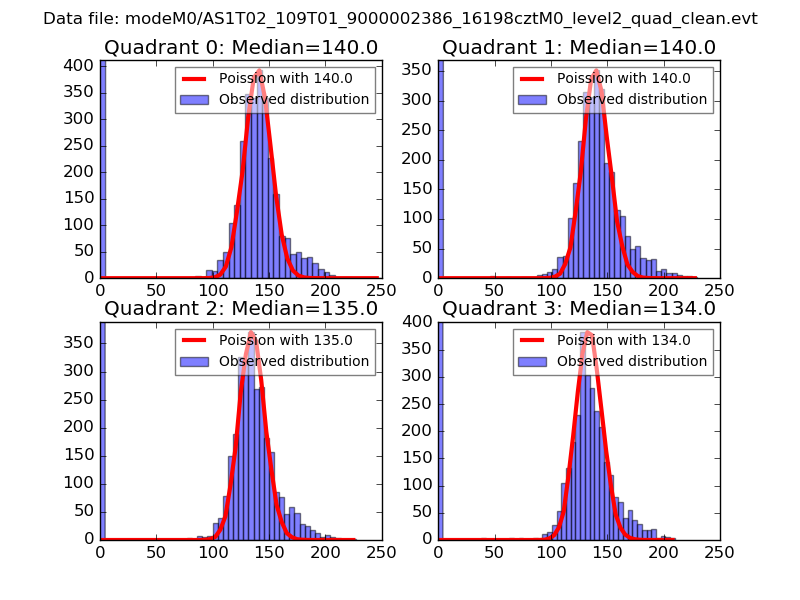 |
 |
| Quadrant-wise count rates Data is divided into 100 sec bins |
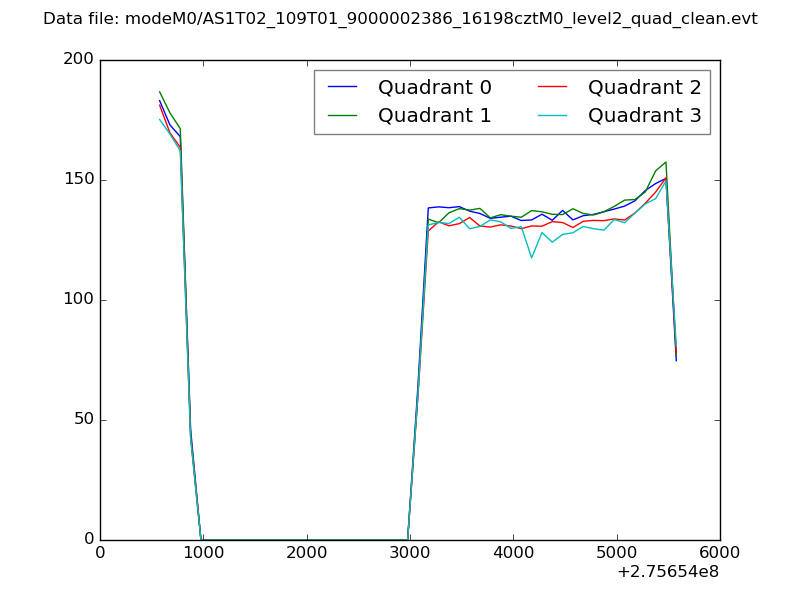 |
|
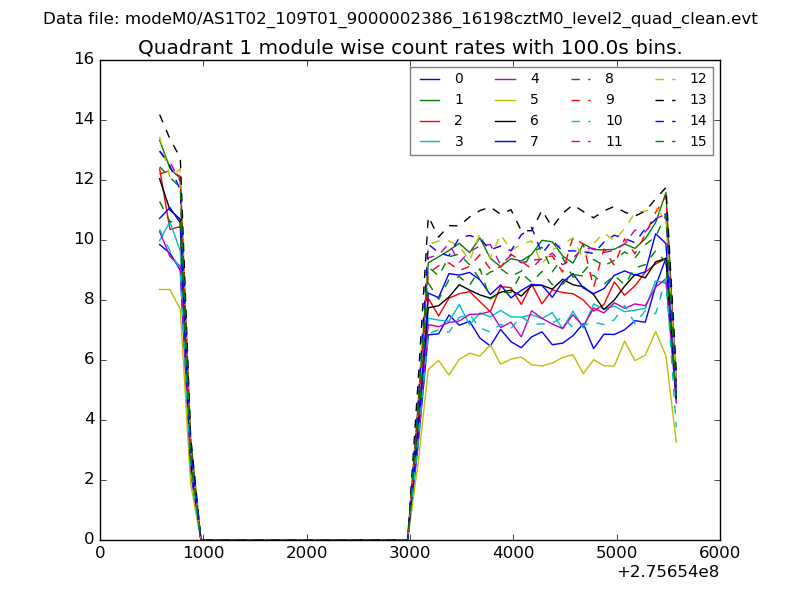
| Module-wise count rates for Quadrant A Data is divided into 100 sec bins |
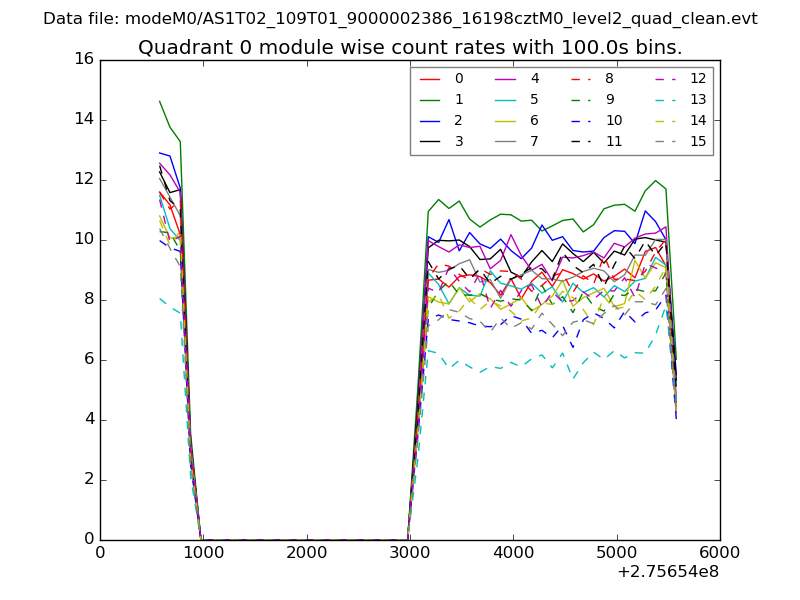 |
 |
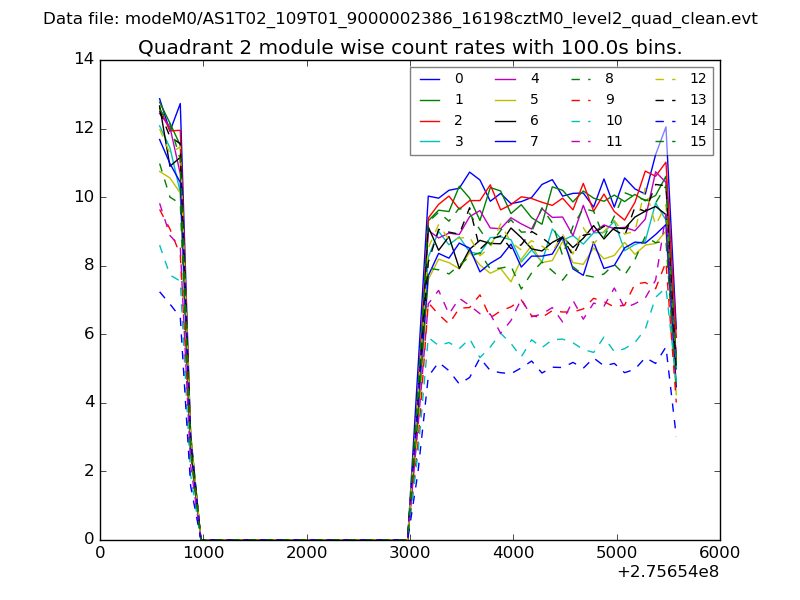
| Module-wise count rates for Quadrant B Data is divided into 100 sec bins |
 |
 |
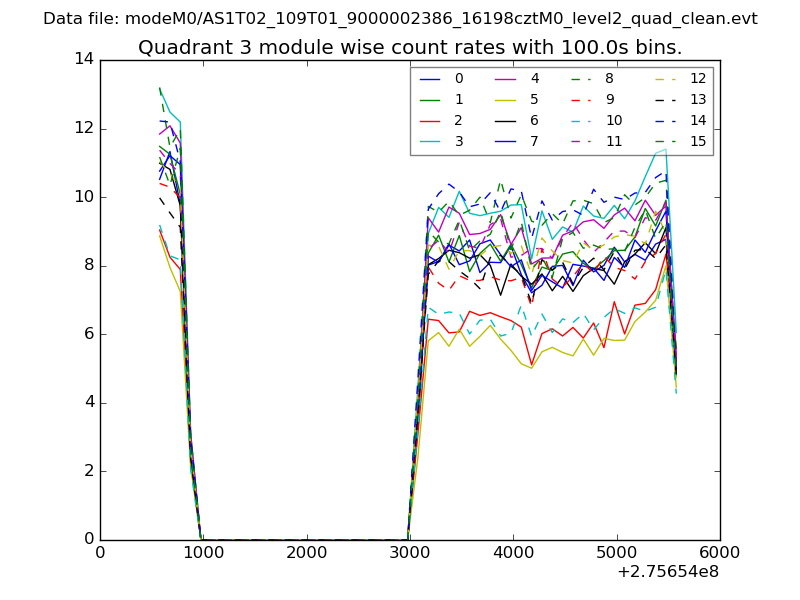
| Module-wise count rates for Quadrant C Data is divided into 100 sec bins |
 |
 |
| Module-wise count rates for Quadrant D Data is divided into 100 sec bins |
 |
 |
| Parameter | Plot |
|---|---|
| CZT HV Monitor | 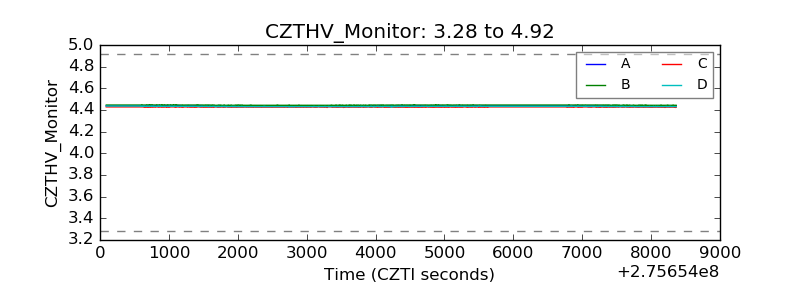 |
| D_VDD | 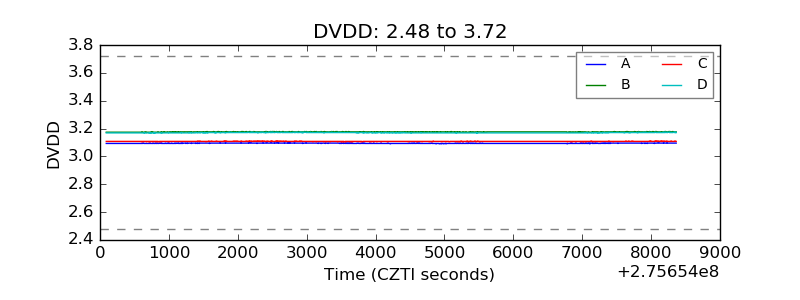 |
| Temperature 1 | 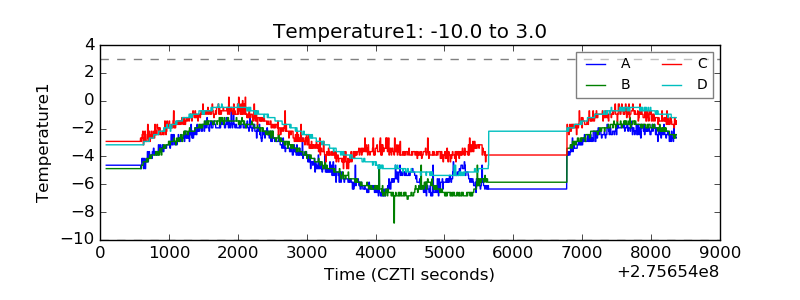 |
| Veto HV Monitor | 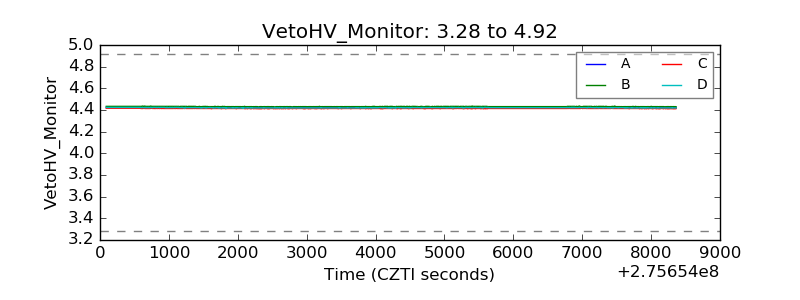 |
| Veto LLD | 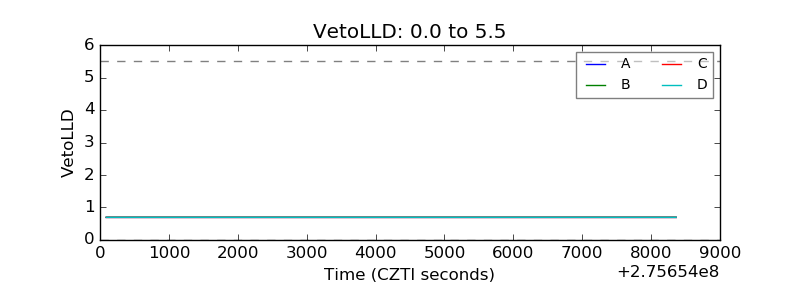 |
| Alpha Counter | 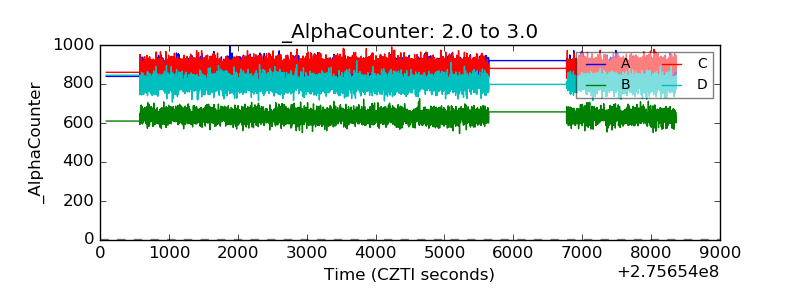 |
| _CPM_Rate | 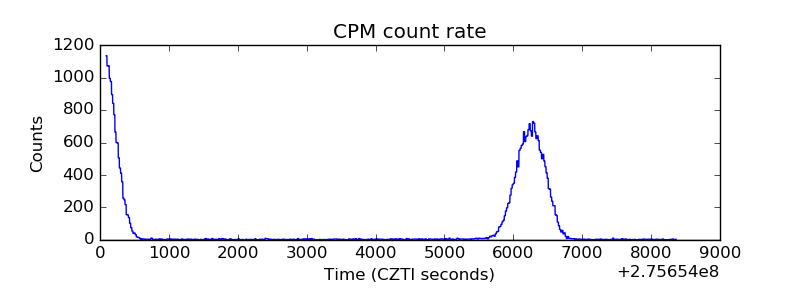 |
| CZT Counter | 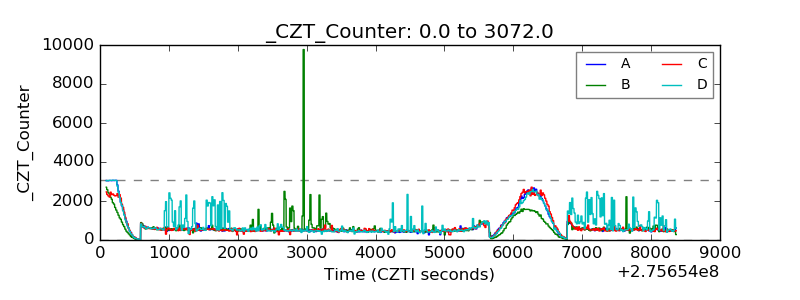 |
| +2.5 Volts monitor |  |
| +5 Volts monitor | 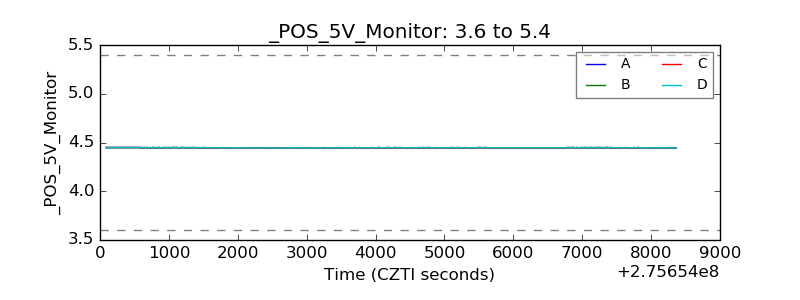 |
| _ROLL_ROT | 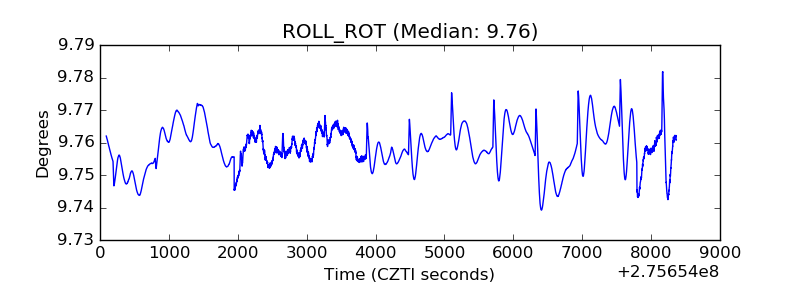 |
| _Roll_DEC | 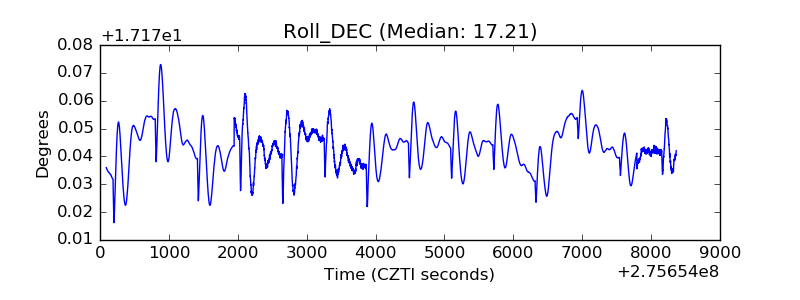 |
| _Roll_RA | 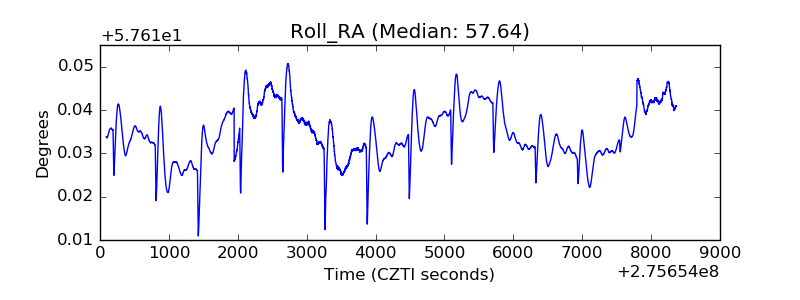 |
| Veto Counter | 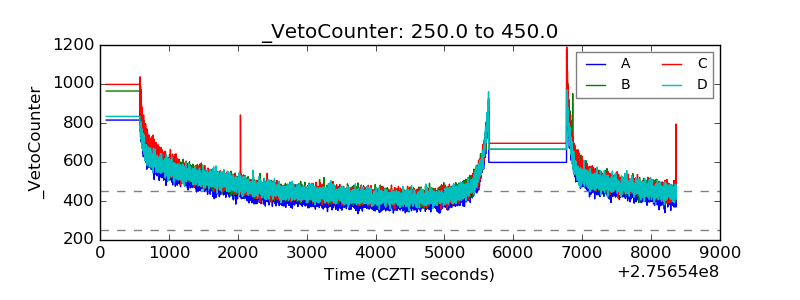 |