| Param | Original file | Final file |
|---|---|---|
| Filename | modeM0/AS1T02_109T01_9000002386_16200cztM0_level2.evt | modeM0/AS1T02_109T01_9000002386_16200cztM0_level2_quad_clean.evt |
| Size (bytes) | 619,640,640 | 74,275,200 |
| Size | 590.9 MB | 70.8 MB |
| Events in quadrant A | 4,584,422 | 452,193 |
| Events in quadrant B | 3,564,762 | 462,122 |
| Events in quadrant C | 3,465,744 | 445,103 |
| Events in quadrant D | 6,676,799 | 401,444 |
| Mode M0 | |||
|---|---|---|---|
| Quadrant | BADHDUFLAG | Total packets | Discarded packets |
| A | 0 | 18246 | 6 |
| B | 0 | 14993 | 2 |
| C | 0 | 14666 | 4 |
| D | 0 | 24591 | 2 |
| Mode SS | |||
|---|---|---|---|
| Quadrant | BADHDUFLAG | Total packets | Discarded packets |
| A | 0 | 142 | 0 |
| B | 0 | 142 | 0 |
| C | 0 | 142 | 0 |
| D | 0 | 142 | 0 |
| Mode M9 | |||
|---|---|---|---|
| Quadrant | BADHDUFLAG | Total packets | Discarded packets |
| A | 0 | 10 | 0 |
| B | 0 | 10 | 0 |
| C | 0 | 10 | 0 |
| D | 0 | 11 | 0 |
| Quadrant | Total seconds | Saturated seconds | Saturation percentage |
|---|---|---|---|
| A | 7003 | 216 | 3.084392% |
| B | 7004 | 63 | 0.899486% |
| C | 7003 | 94 | 1.342282% |
| D | 7004 | 980 | 13.992005% |
Noise dominated data is calculated using 1-second bins in cleaned event files. If a bin has >2000 counts, and if more than 50% of those come from <1% of pixels, then it is considered to be noise-dominated and hence unusable.
| Quadrant | # 1 sec bins | Bins with >0 counts | Bins with >2000 counts | High rate bins dominated by noise | Noise dominated (total time) | Noise dominated (detector-on time) | Marked lightcurve |
|---|---|---|---|---|---|---|---|
| A | 7575 | 7006 | 131 | 131 | 1.73% | 1.87% | 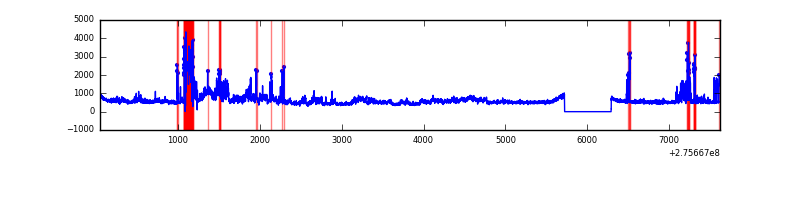 |
| B | 7575 | 7006 | 1 | 1 | 0.01% | 0.01% | 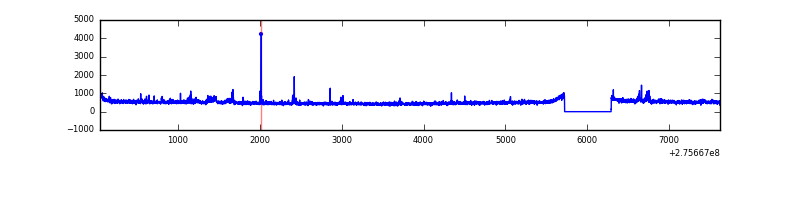 |
| C | 7575 | 7006 | 0 | 0 | 0.00% | 0.00% | 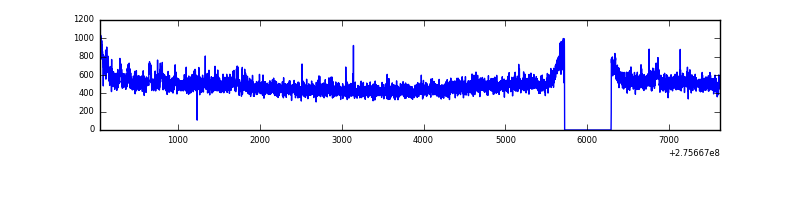 |
| D | 7575 | 7005 | 697 | 697 | 9.20% | 9.95% | 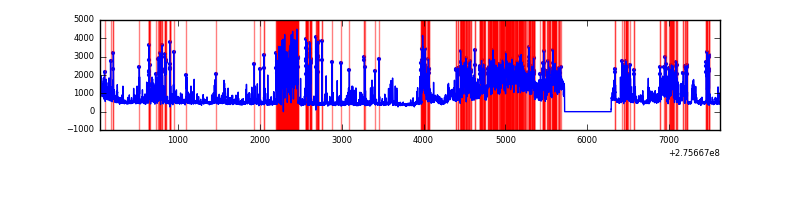 |
Top three noisy pixels from each quadrant. If the there are fewer than three noisy pixels in the level2.evt file, extra rows are filled as -1
| Pixel properties | Quadrant properties | ||||||
|---|---|---|---|---|---|---|---|
| Quadrant | DetID | PixID | Counts | Sigma | Mean | Median | Sigma |
| A | 15 | 174 | 783672 | 4489.26 | 855 | 837 | 174.4 |
| A | 8 | 247 | 503964 | 2885.24 | 855 | 837 | 174.4 |
| A | 4 | 2 | 8358 | 43.13 | 855 | 837 | 174.4 |
| B | 4 | 216 | 70976 | 416.7 | 869 | 847 | 168.3 |
| B | 0 | 189 | 29017 | 167.38 | 869 | 847 | 168.3 |
| B | 0 | 229 | 19448 | 110.53 | 869 | 847 | 168.3 |
| C | 14 | 238 | 127830 | 656.12 | 830 | 834 | 193.6 |
| C | 10 | 22 | 46138 | 234.06 | 830 | 834 | 193.6 |
| C | 3 | 233 | 30637 | 153.98 | 830 | 834 | 193.6 |
| D | 2 | 233 | 2457331 | 12326.89 | 807 | 781 | 199.3 |
| D | 1 | 52 | 957812 | 4802.35 | 807 | 781 | 199.3 |
| D | 5 | 222 | 103691 | 516.4 | 807 | 781 | 199.3 |
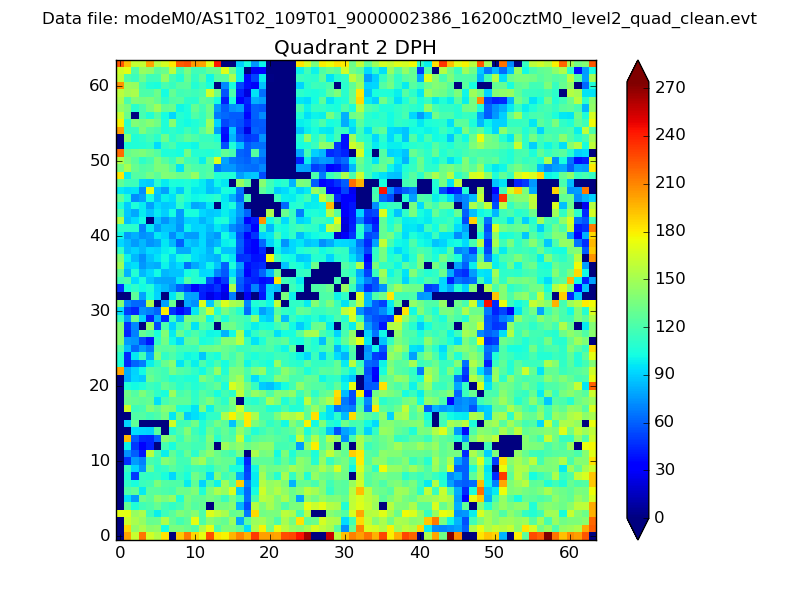
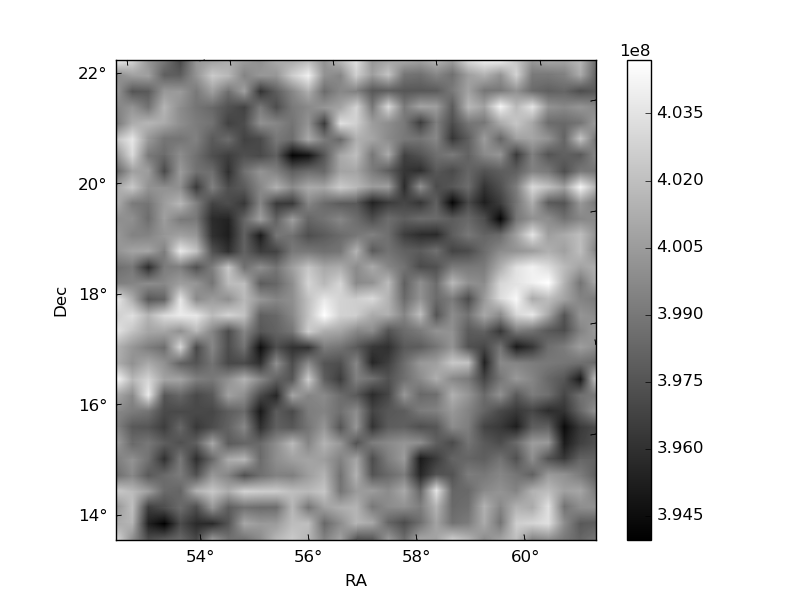
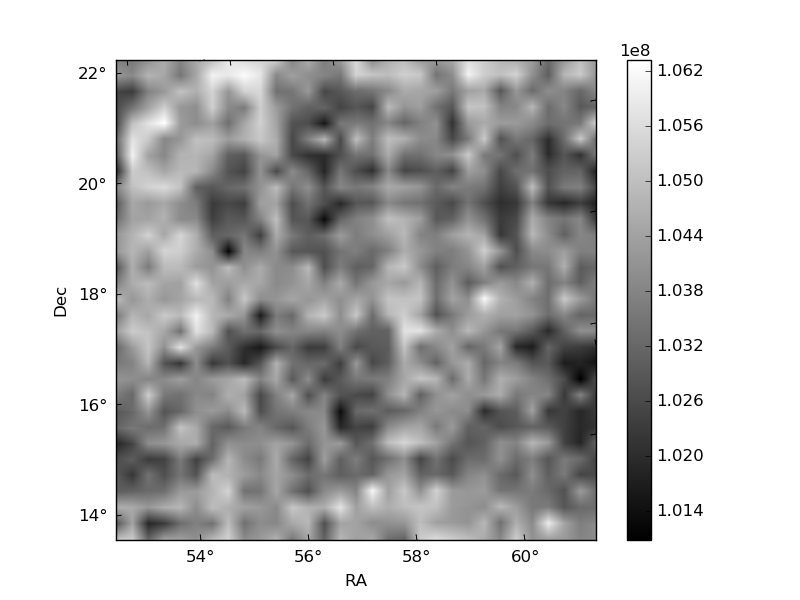
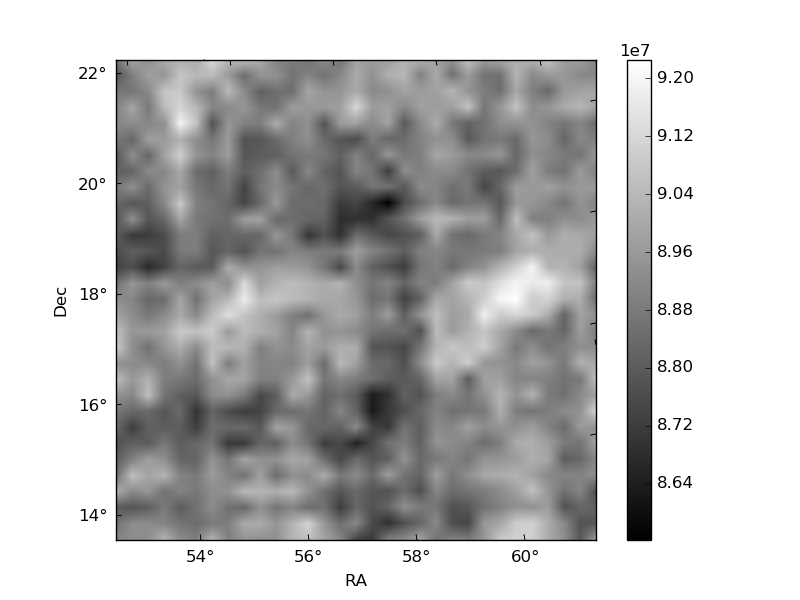
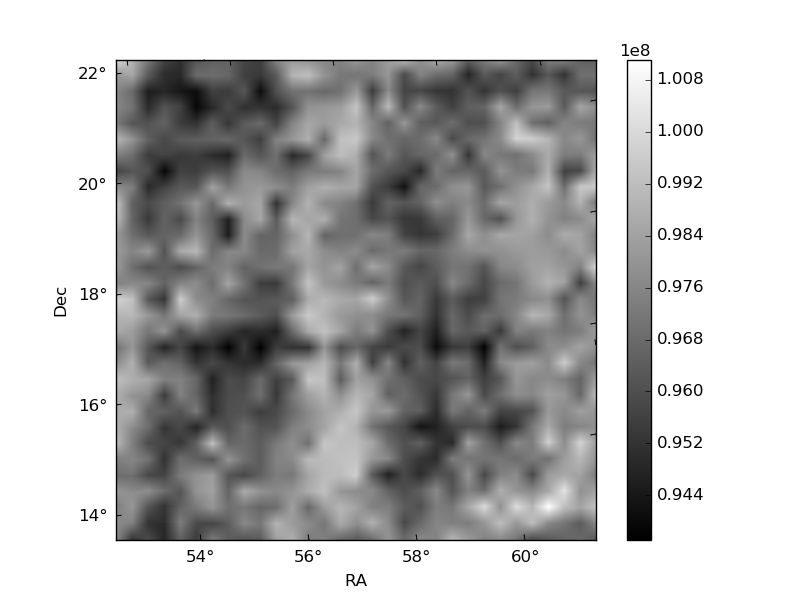
Histogram calculated using DETX and DETY for each event in the final _common_clean file
| Quadrant A | 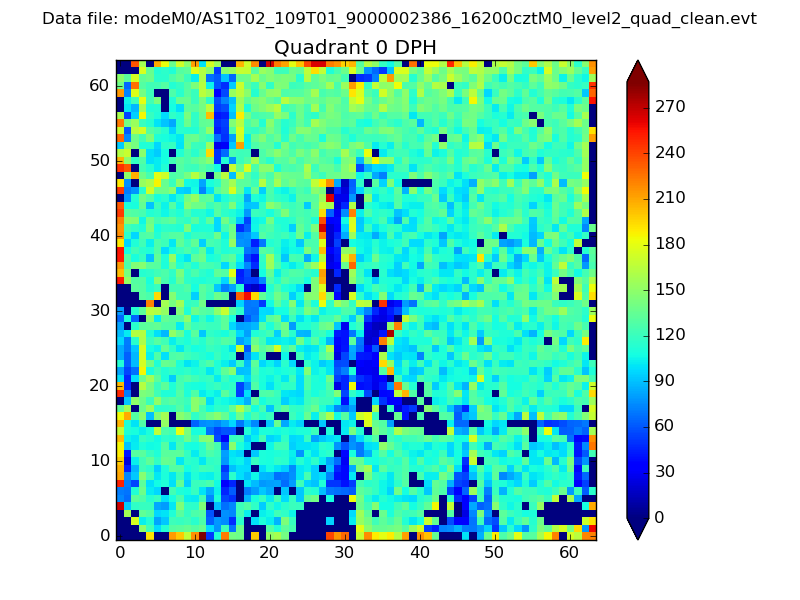 |
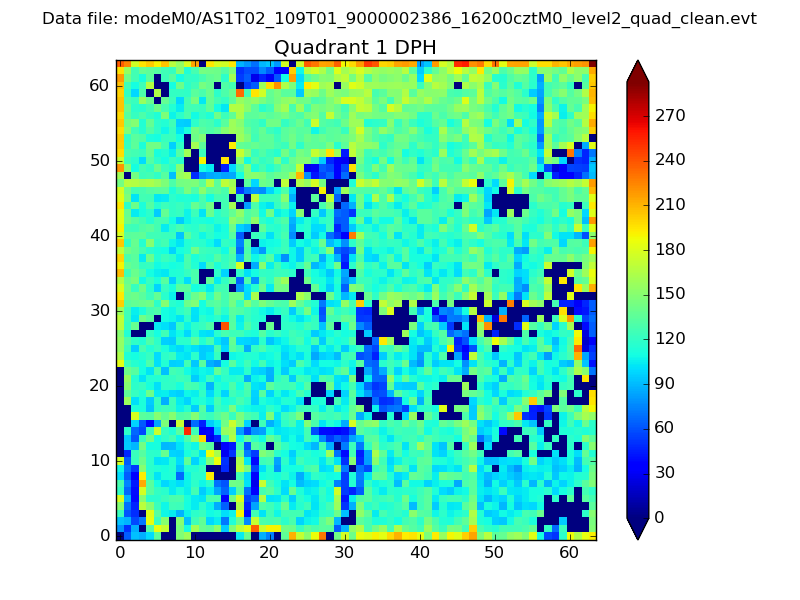 |
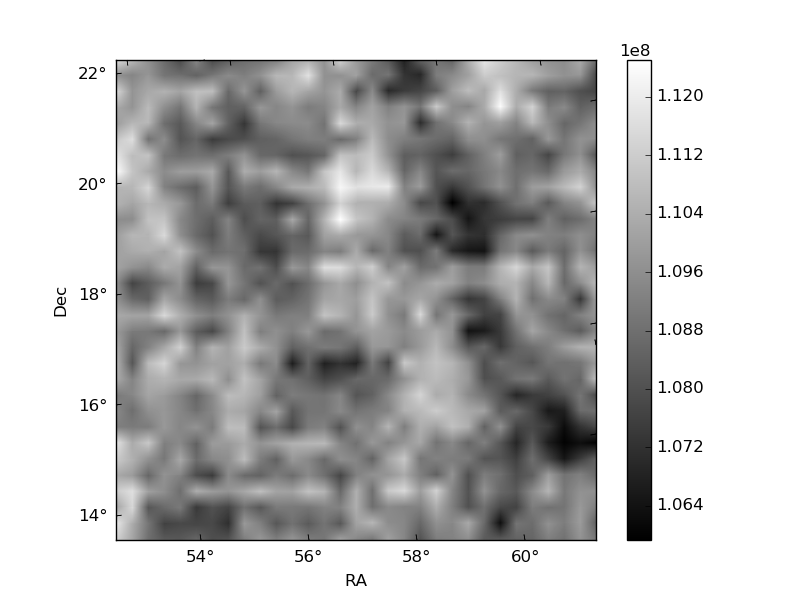
Quadrant B |
|---|---|---|---|
| Quadrant D | 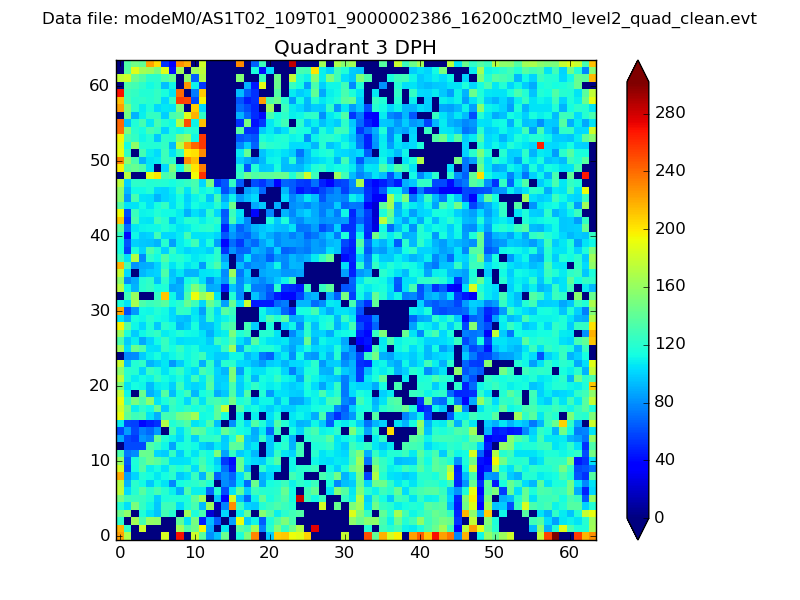 |
 |
Quadrant C |
| Plot type | Count rate plots | Images |
|---|---|---|
| Comparison with Poisson distribution Blue bars denote a histogram of data divided into 1 sec bins. Red curve is a Poisson curve with rate = median count rate of data. |
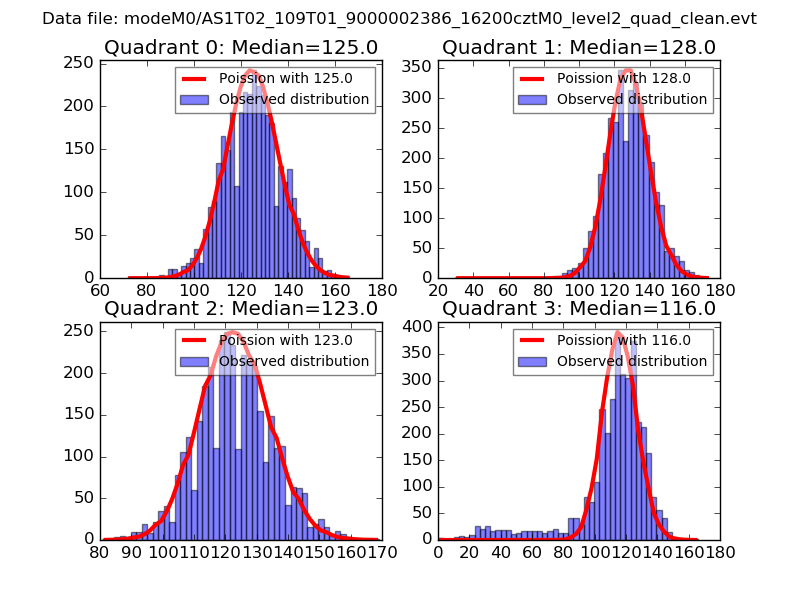 |
 |
| Quadrant-wise count rates Data is divided into 100 sec bins |
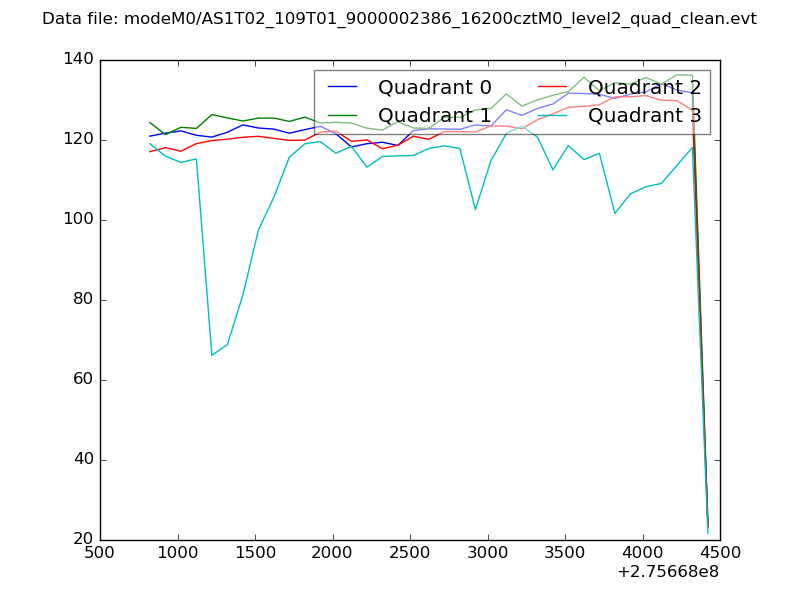 |
|
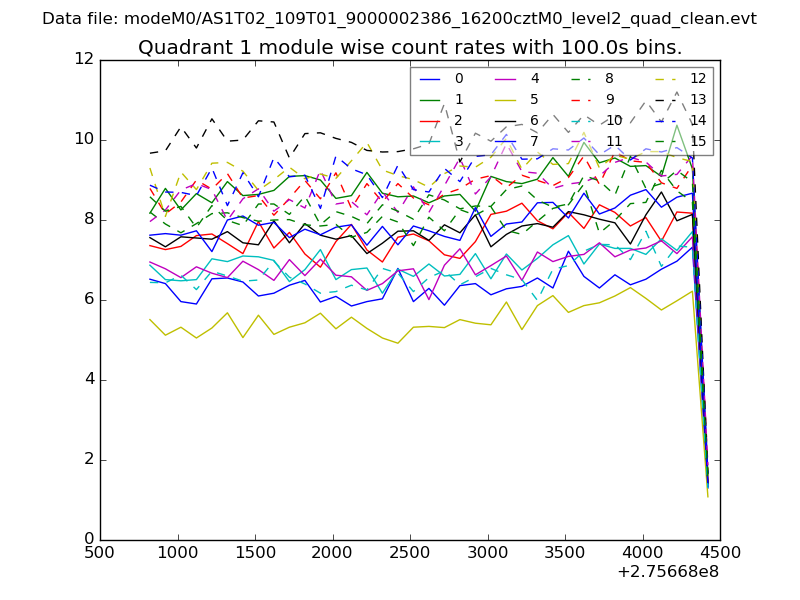
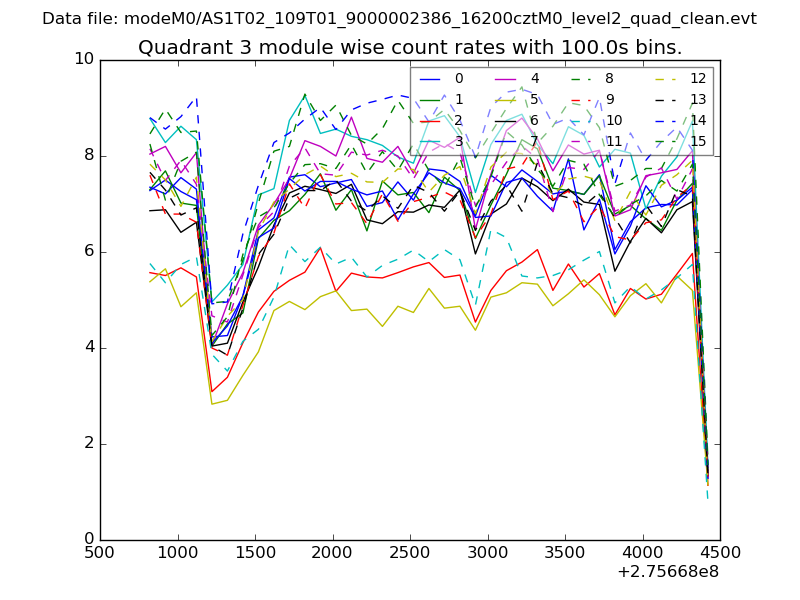
| Module-wise count rates for Quadrant A Data is divided into 100 sec bins |
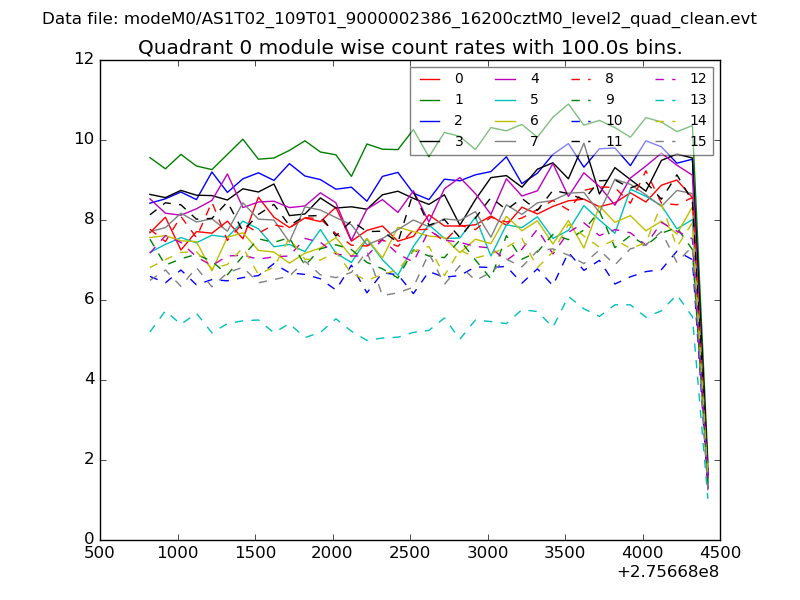 |
 |
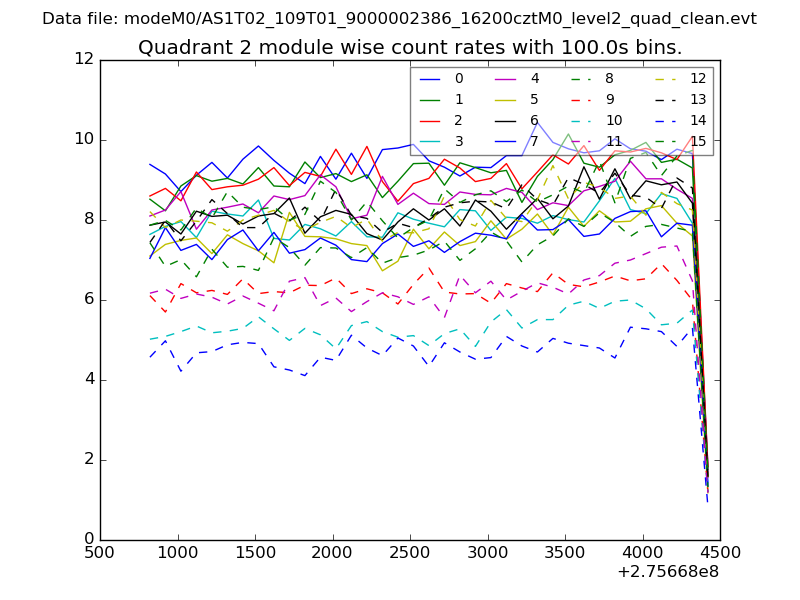
| Module-wise count rates for Quadrant B Data is divided into 100 sec bins |
 |
 |
| Module-wise count rates for Quadrant C Data is divided into 100 sec bins |
 |
 |
| Module-wise count rates for Quadrant D Data is divided into 100 sec bins |
 |
 |
| Parameter | Plot |
|---|---|
| CZT HV Monitor | 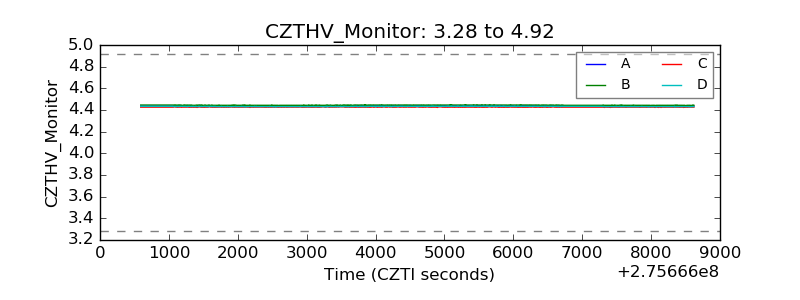 |
| D_VDD | 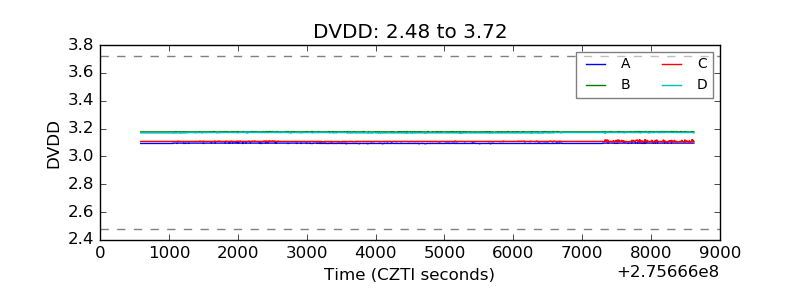 |
| Temperature 1 | 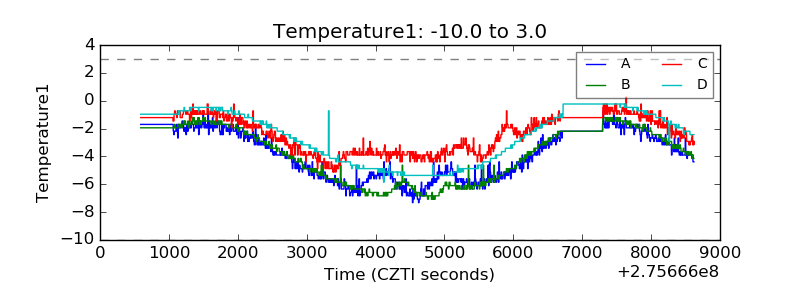 |
| Veto HV Monitor | 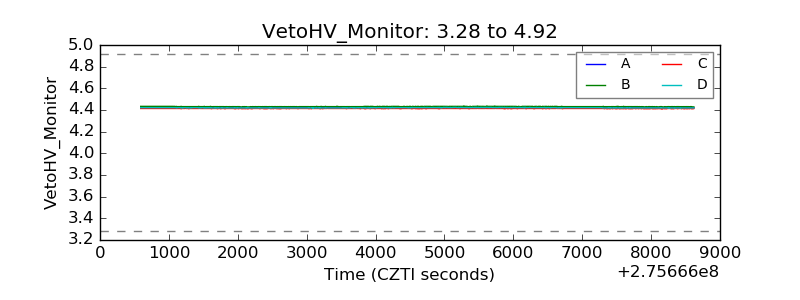 |
| Veto LLD | 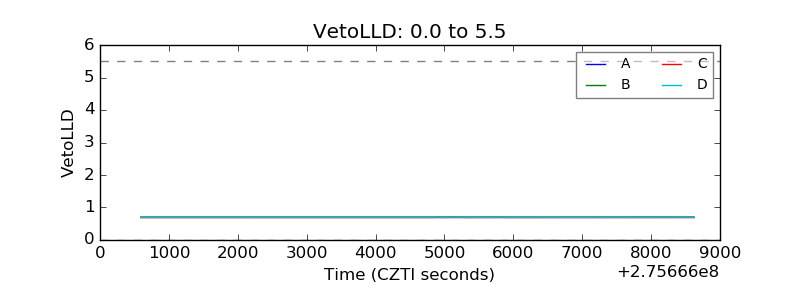 |
| Alpha Counter | 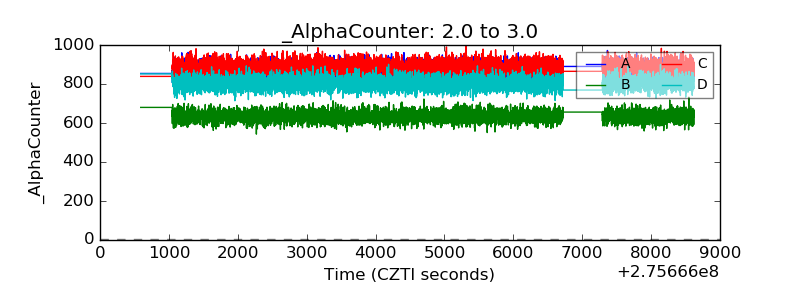 |
| _CPM_Rate | 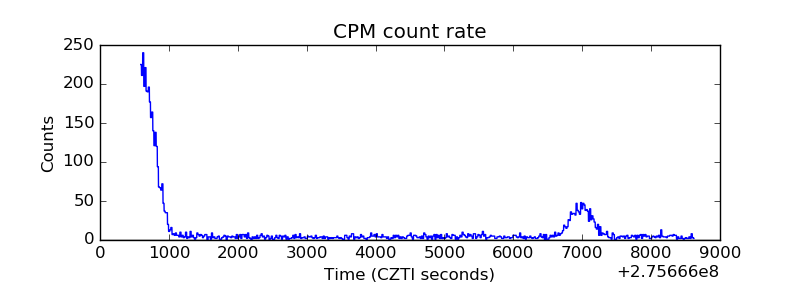 |
| CZT Counter | 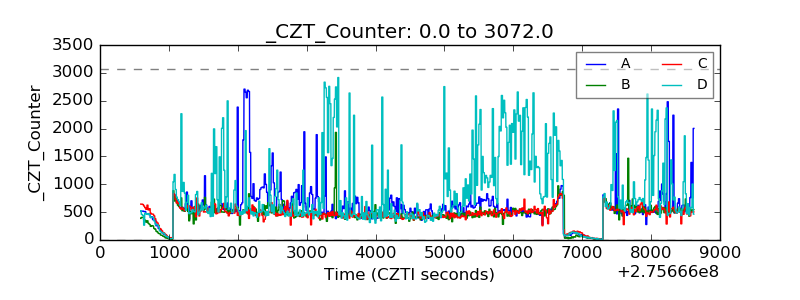 |
| +2.5 Volts monitor |  |
| +5 Volts monitor | 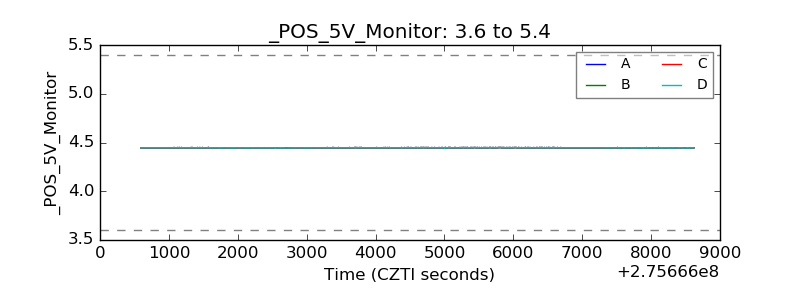 |
| _ROLL_ROT | 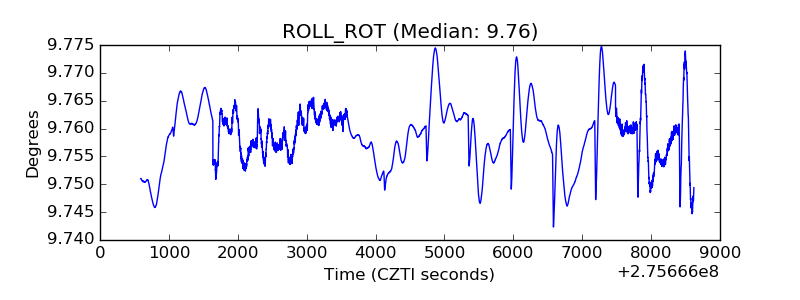 |
| _Roll_DEC | 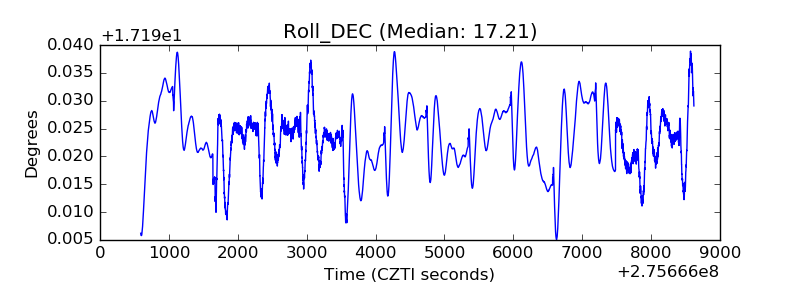 |
| _Roll_RA | 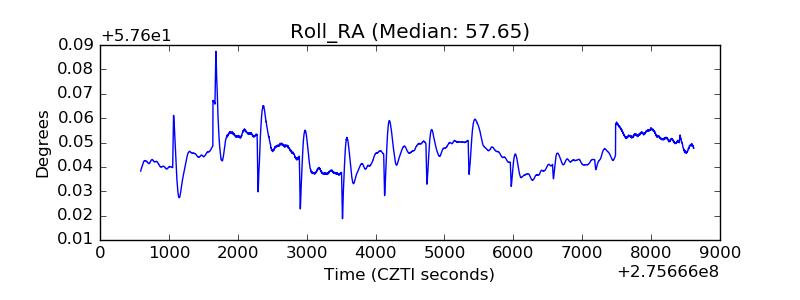 |
| Veto Counter | 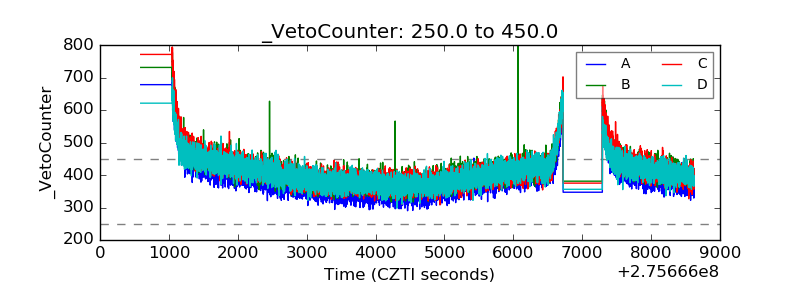 |