| Param | Original file | Final file |
|---|---|---|
| Filename | modeM0/AS1T02_109T01_9000002386_16201cztM0_level2.evt | modeM0/AS1T02_109T01_9000002386_16201cztM0_level2_quad_clean.evt |
| Size (bytes) | 632,502,720 | 82,175,040 |
| Size | 603.2 MB | 78.4 MB |
| Events in quadrant A | 4,321,722 | 499,618 |
| Events in quadrant B | 3,971,522 | 512,808 |
| Events in quadrant C | 3,903,361 | 492,478 |
| Events in quadrant D | 6,446,132 | 457,221 |
| Mode M0 | |||
|---|---|---|---|
| Quadrant | BADHDUFLAG | Total packets | Discarded packets |
| A | 0 | 17820 | 4 |
| B | 0 | 16591 | 2 |
| C | 0 | 16233 | 2 |
| D | 0 | 24350 | 2 |
| Mode SS | |||
|---|---|---|---|
| Quadrant | BADHDUFLAG | Total packets | Discarded packets |
| A | 0 | 156 | 0 |
| B | 0 | 156 | 0 |
| C | 0 | 156 | 0 |
| D | 0 | 156 | 0 |
| Mode M9 | |||
|---|---|---|---|
| Quadrant | BADHDUFLAG | Total packets | Discarded packets |
| A | 0 | 8 | 0 |
| B | 0 | 8 | 0 |
| C | 0 | 8 | 0 |
| D | 0 | 8 | 0 |
| Quadrant | Total seconds | Saturated seconds | Saturation percentage |
|---|---|---|---|
| A | 7560 | 290 | 3.835979% |
| B | 7560 | 191 | 2.526455% |
| C | 7560 | 180 | 2.380952% |
| D | 7560 | 991 | 13.108466% |
Noise dominated data is calculated using 1-second bins in cleaned event files. If a bin has >2000 counts, and if more than 50% of those come from <1% of pixels, then it is considered to be noise-dominated and hence unusable.
| Quadrant | # 1 sec bins | Bins with >0 counts | Bins with >2000 counts | High rate bins dominated by noise | Noise dominated (total time) | Noise dominated (detector-on time) | Marked lightcurve |
|---|---|---|---|---|---|---|---|
| A | 8347 | 7564 | 138 | 138 | 1.65% | 1.82% | 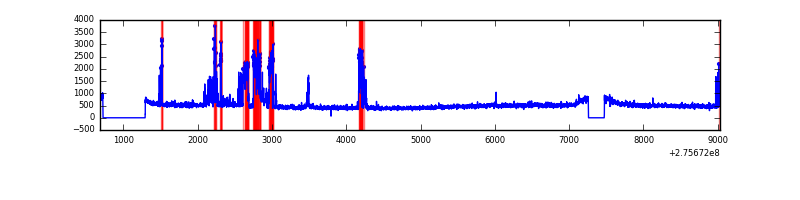 |
| B | 8347 | 7564 | 17 | 17 | 0.20% | 0.22% | 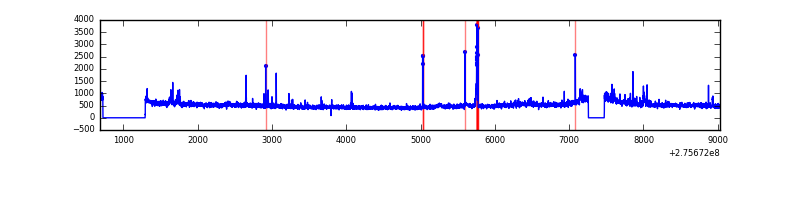 |
| C | 8347 | 7564 | 1 | 1 | 0.01% | 0.01% | 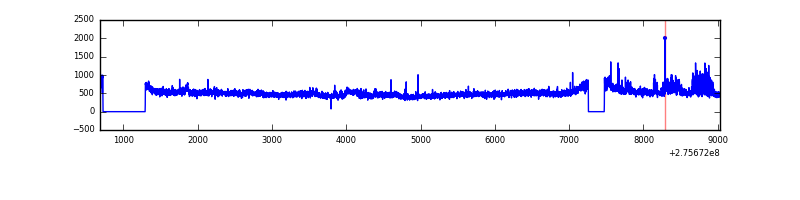 |
| D | 8347 | 7564 | 606 | 606 | 7.26% | 8.01% | 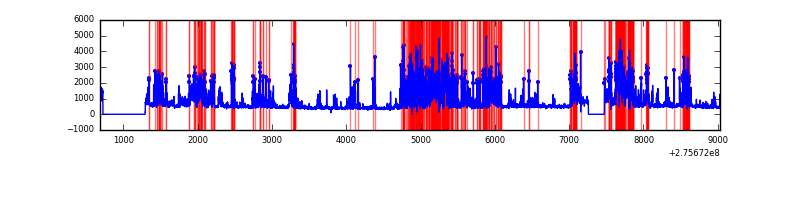 |
Top three noisy pixels from each quadrant. If the there are fewer than three noisy pixels in the level2.evt file, extra rows are filled as -1
| Pixel properties | Quadrant properties | ||||||
|---|---|---|---|---|---|---|---|
| Quadrant | DetID | PixID | Counts | Sigma | Mean | Median | Sigma |
| A | 15 | 174 | 719537 | 3787.55 | 931 | 911 | 189.7 |
| A | 8 | 247 | 19139 | 96.07 | 931 | 911 | 189.7 |
| A | 0 | 226 | 8384 | 39.39 | 931 | 911 | 189.7 |
| B | 0 | 198 | 116001 | 643.03 | 934 | 909 | 179.0 |
| B | 4 | 216 | 44339 | 242.65 | 934 | 909 | 179.0 |
| B | 0 | 189 | 43088 | 235.66 | 934 | 909 | 179.0 |
| C | 14 | 238 | 139301 | 658.34 | 895 | 901 | 210.2 |
| C | 7 | 247 | 123579 | 583.55 | 895 | 901 | 210.2 |
| C | 10 | 22 | 84513 | 397.72 | 895 | 901 | 210.2 |
| D | 2 | 233 | 2600282 | 12191.27 | 863 | 834 | 213.2 |
| D | 1 | 52 | 355130 | 1661.63 | 863 | 834 | 213.2 |
| D | 10 | 70 | 92930 | 431.93 | 863 | 834 | 213.2 |
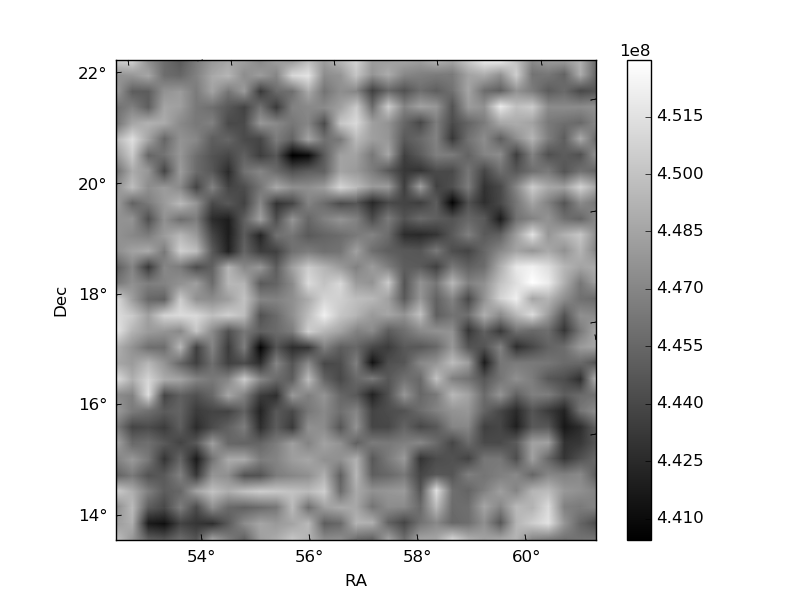
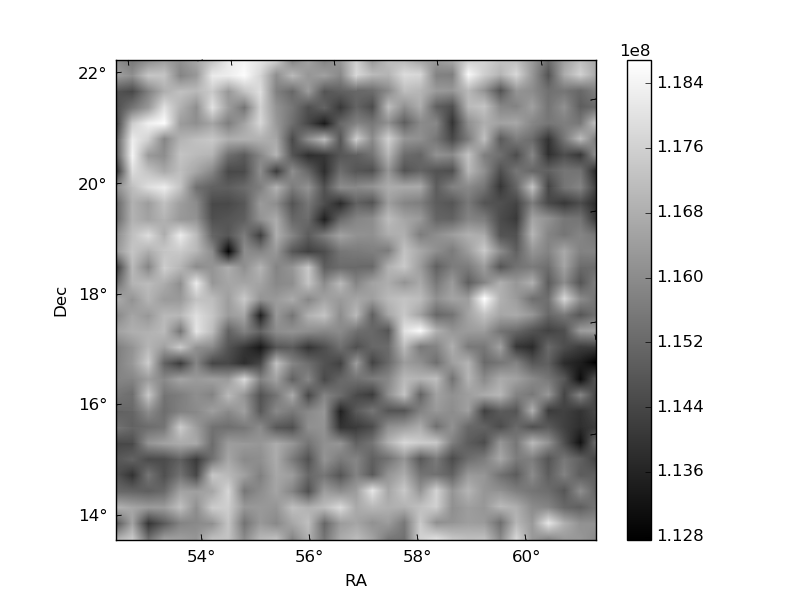
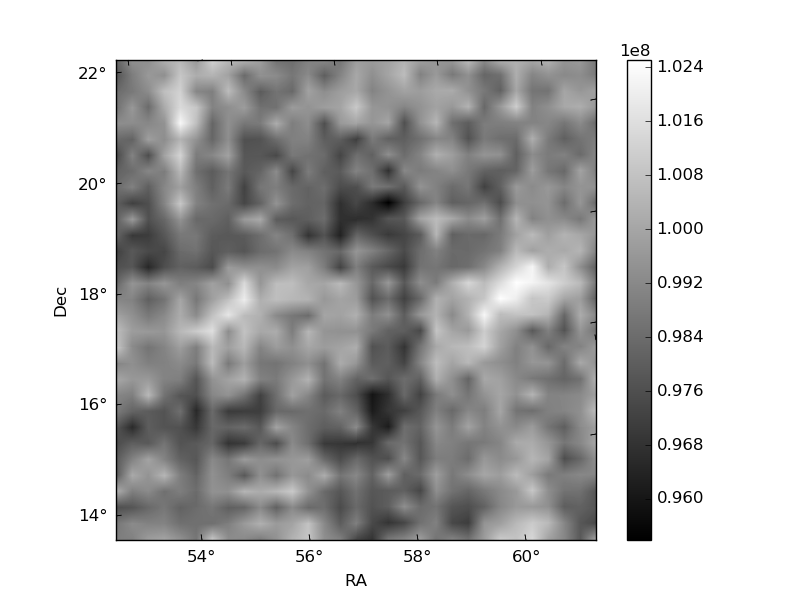
Histogram calculated using DETX and DETY for each event in the final _common_clean file
| Quadrant A | 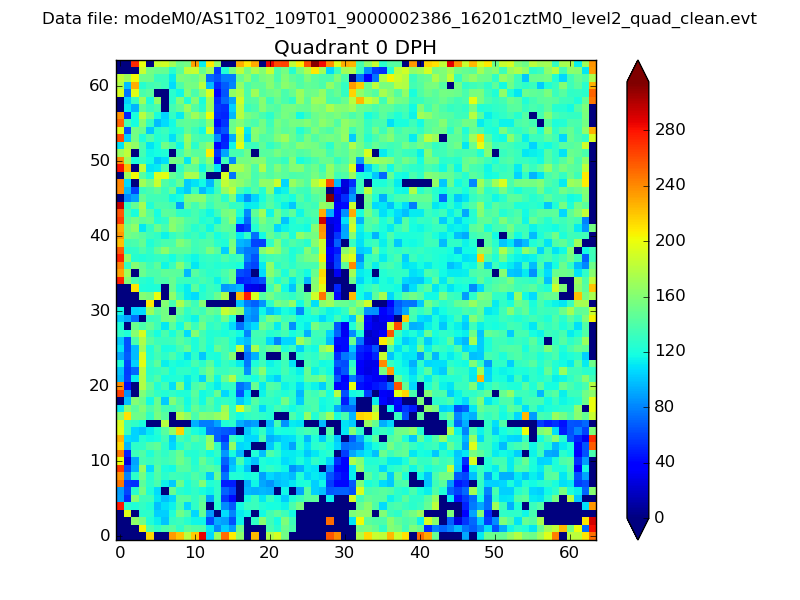 |
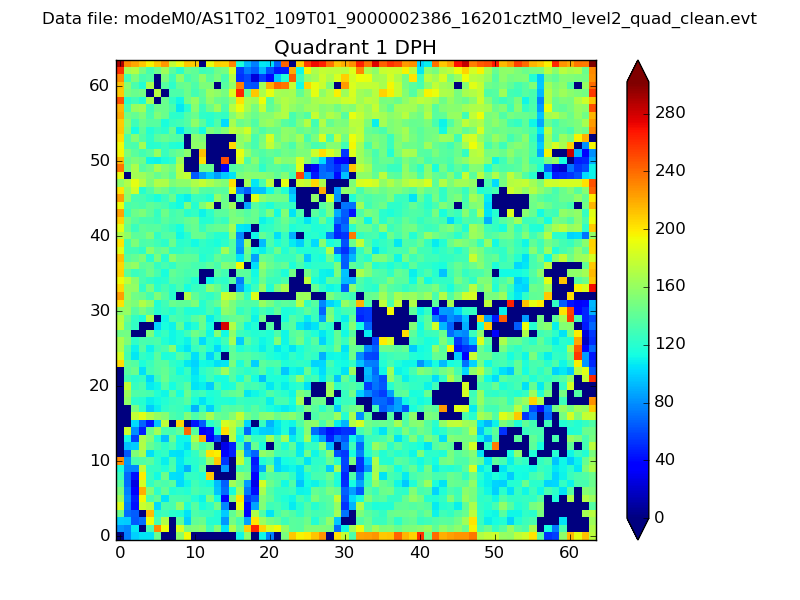 |
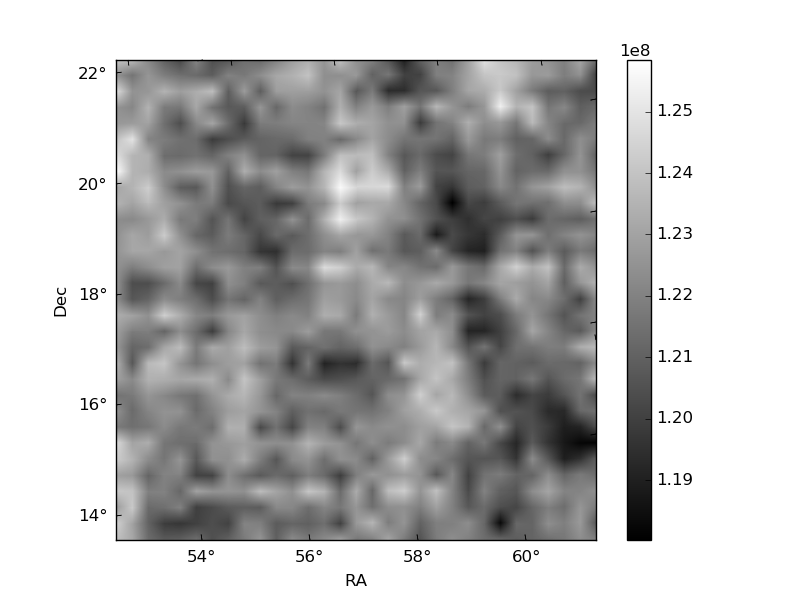
Quadrant B |
|---|---|---|---|
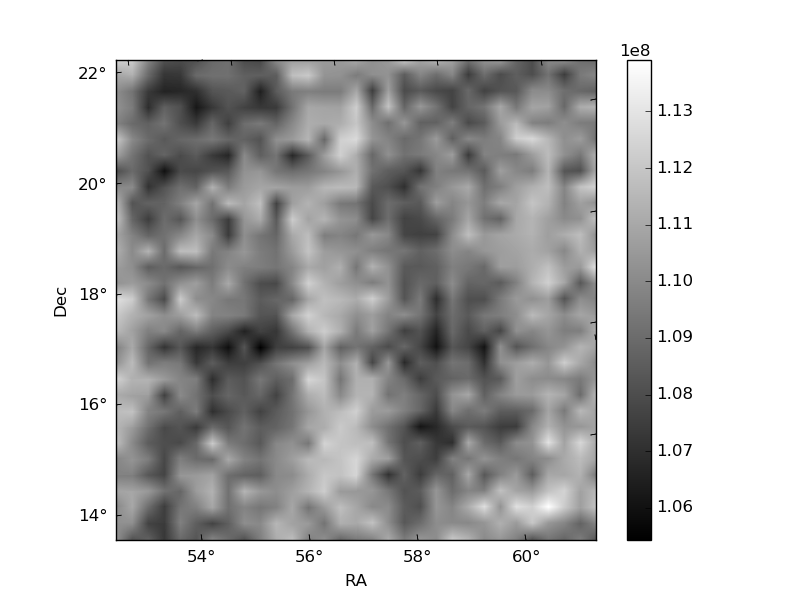
| Quadrant D | 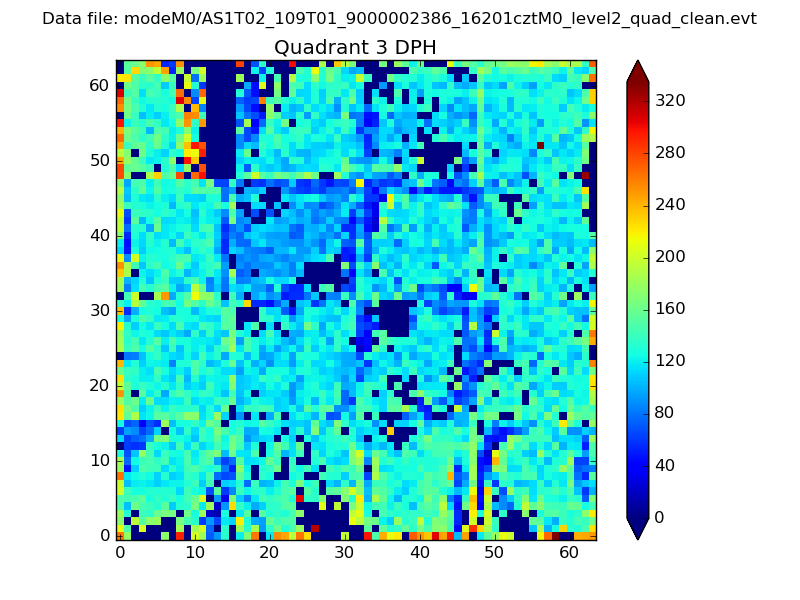 |
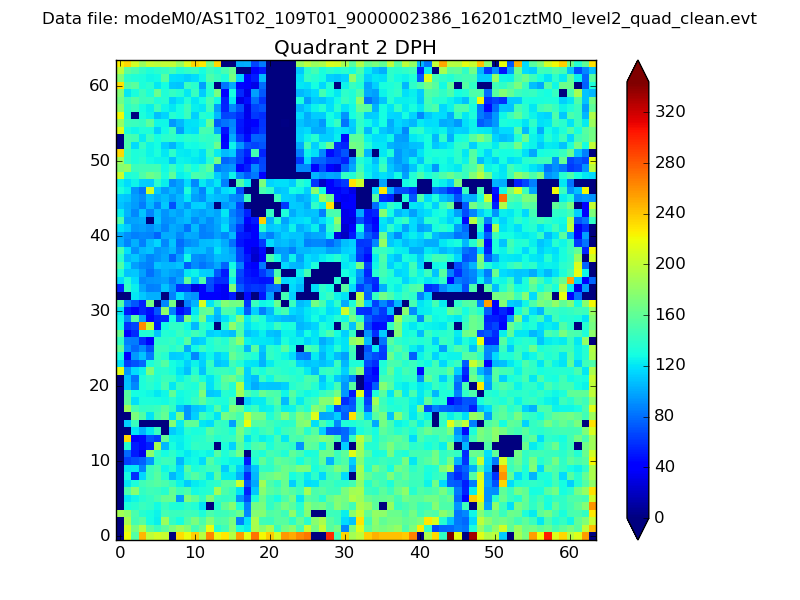 |
Quadrant C |
| Plot type | Count rate plots | Images |
|---|---|---|
| Comparison with Poisson distribution Blue bars denote a histogram of data divided into 1 sec bins. Red curve is a Poisson curve with rate = median count rate of data. |
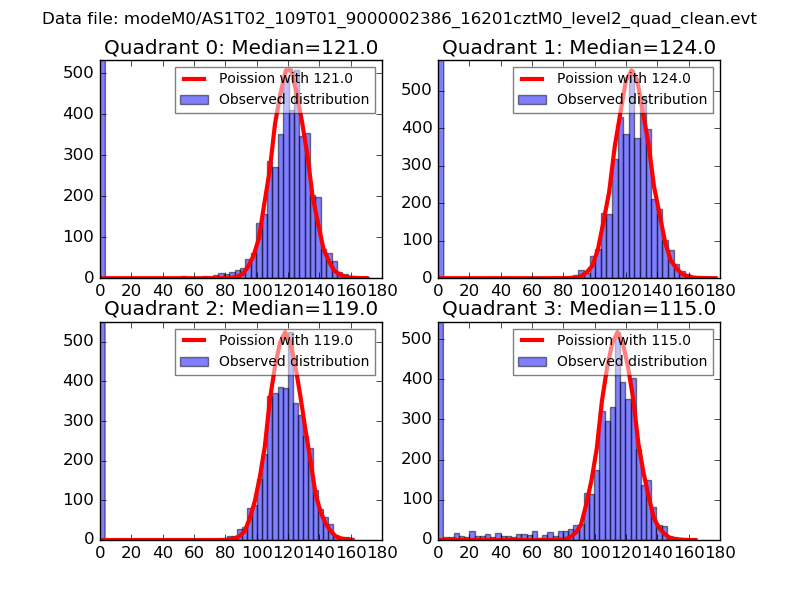 |
 |
| Quadrant-wise count rates Data is divided into 100 sec bins |
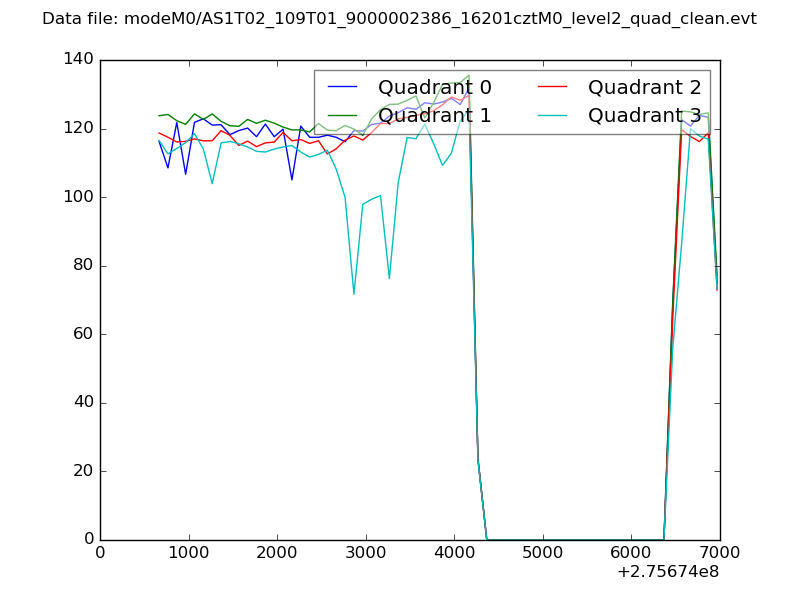 |
|
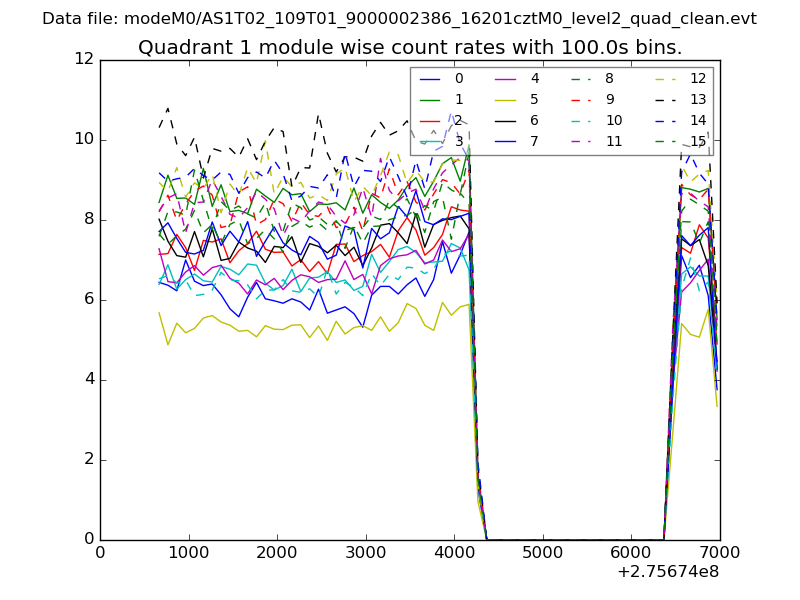
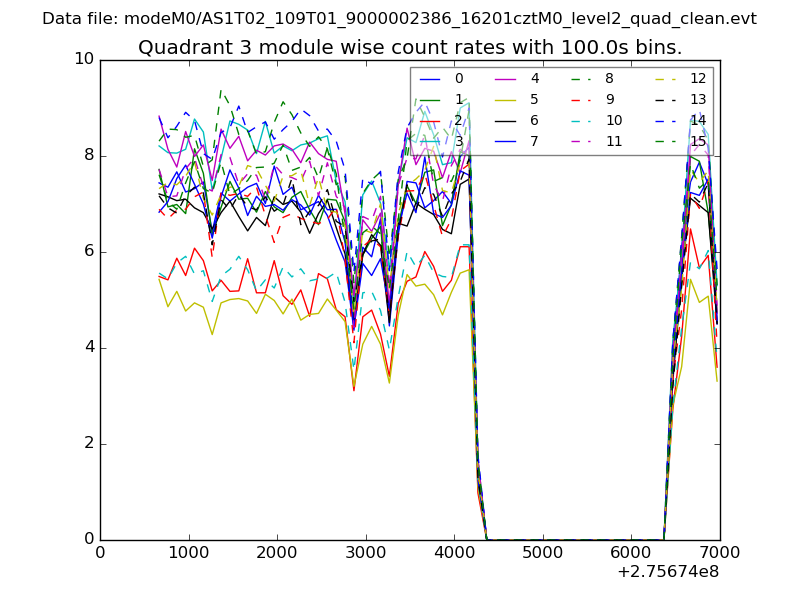
| Module-wise count rates for Quadrant A Data is divided into 100 sec bins |
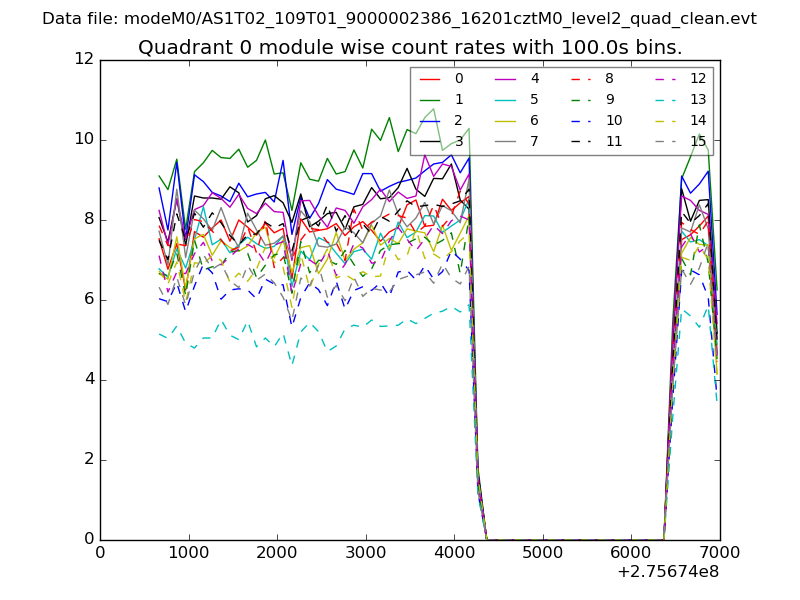 |
 |
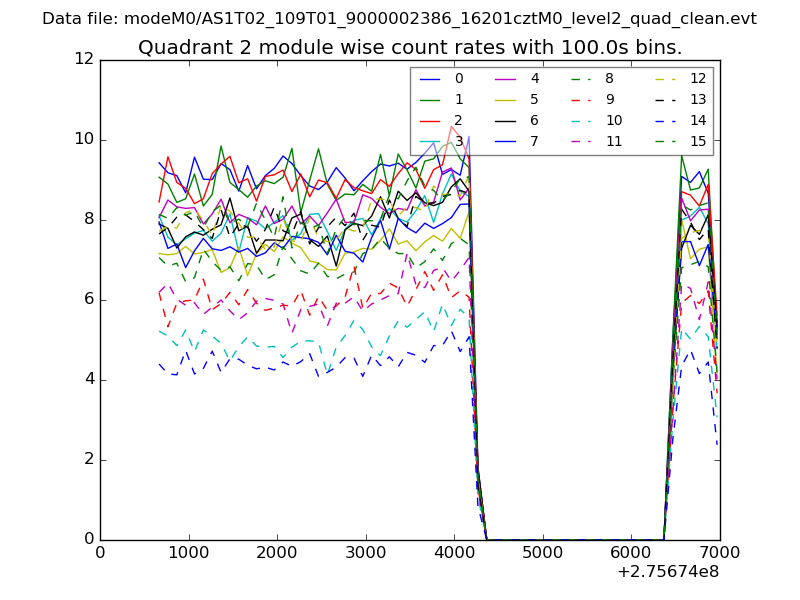
| Module-wise count rates for Quadrant B Data is divided into 100 sec bins |
 |
 |
| Module-wise count rates for Quadrant C Data is divided into 100 sec bins |
 |
 |
| Module-wise count rates for Quadrant D Data is divided into 100 sec bins |
 |
 |
| Parameter | Plot |
|---|---|
| CZT HV Monitor | 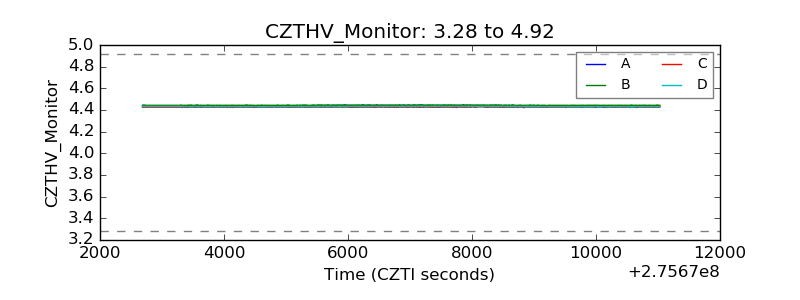 |
| D_VDD | 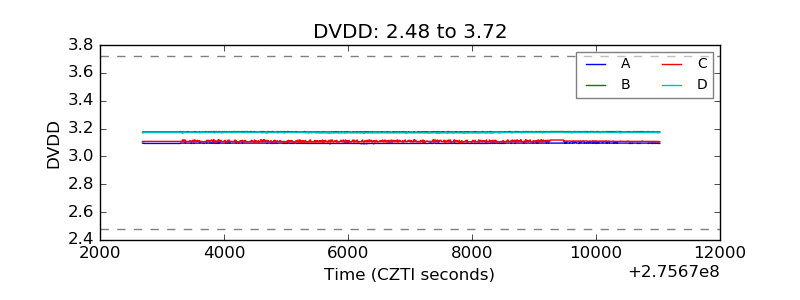 |
| Temperature 1 | 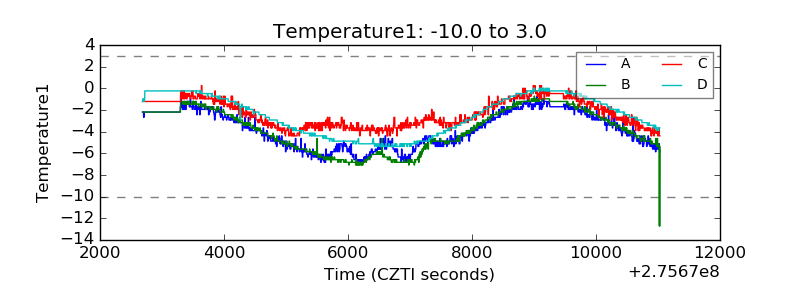 |
| Veto HV Monitor |  |
| Veto LLD | 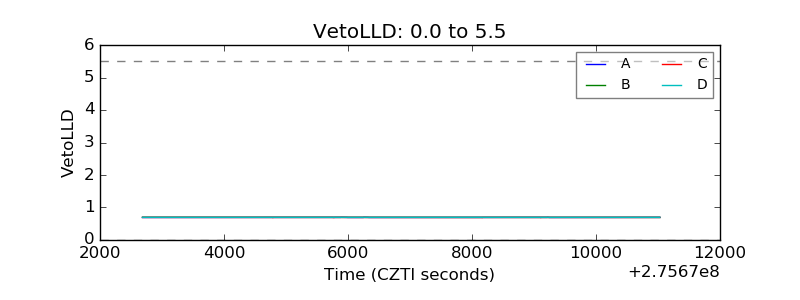 |
| Alpha Counter |  |
| _CPM_Rate | 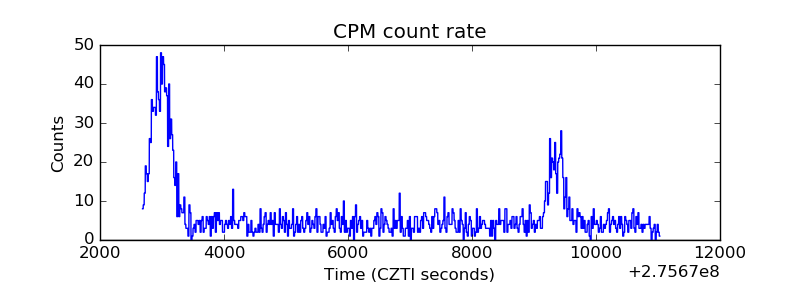 |
| CZT Counter | 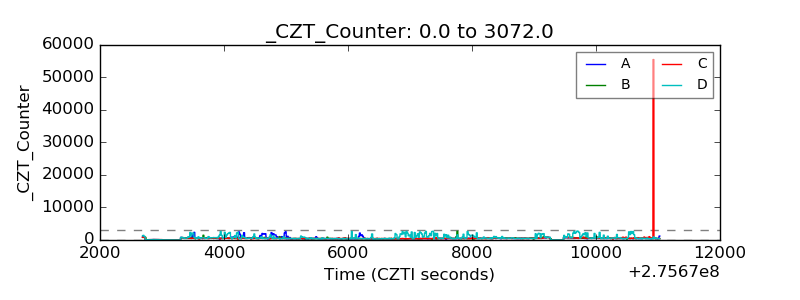 |
| +2.5 Volts monitor |  |
| +5 Volts monitor |  |
| _ROLL_ROT | 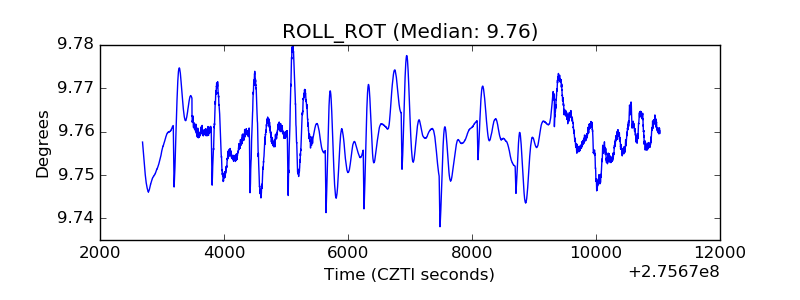 |
| _Roll_DEC | 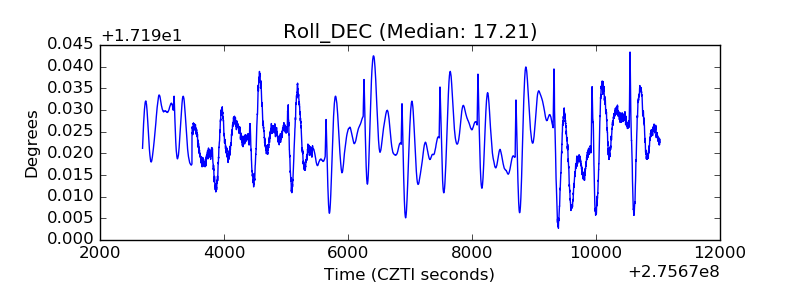 |
| _Roll_RA | 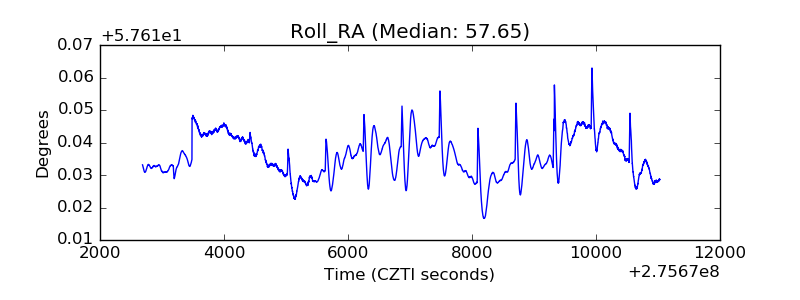 |
| Veto Counter | 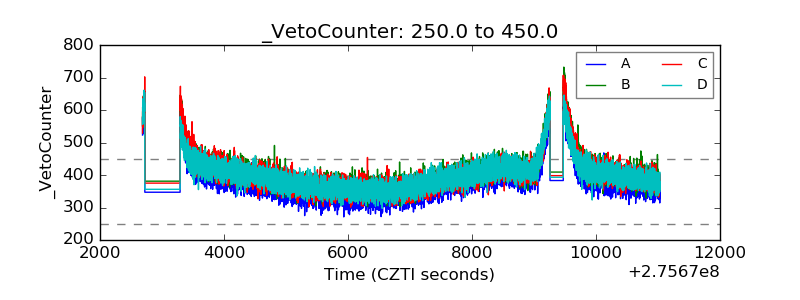 |