| Param | Original file | Final file |
|---|---|---|
| Filename | modeM0/AS1T02_109T01_9000002386_16206cztM0_level2.evt | modeM0/AS1T02_109T01_9000002386_16206cztM0_level2_quad_clean.evt |
| Size (bytes) | 1,523,525,760 | 253,584,000 |
| Size | 1.4 GB | 241.8 MB |
| Events in quadrant A | 9,194,639 | 1,621,193 |
| Events in quadrant B | 9,558,774 | 1,658,316 |
| Events in quadrant C | 9,643,565 | 1,587,774 |
| Events in quadrant D | 16,423,090 | 1,465,962 |
| Mode M0 | |||
|---|---|---|---|
| Quadrant | BADHDUFLAG | Total packets | Discarded packets |
| A | 0 | 47830 | 6808 |
| B | 0 | 49200 | 7402 |
| C | 0 | 48600 | 6919 |
| D | 0 | 77266 | 15201 |
| Mode SS | |||
|---|---|---|---|
| Quadrant | BADHDUFLAG | Total packets | Discarded packets |
| A | 0 | 475 | 67 |
| B | 0 | 466 | 54 |
| C | 0 | 477 | 78 |
| D | 0 | 475 | 79 |
| Mode M9 | |||
|---|---|---|---|
| Quadrant | BADHDUFLAG | Total packets | Discarded packets |
| A | 0 | 29 | 6 |
| B | 0 | 31 | 9 |
| C | 0 | 30 | 10 |
| D | 0 | 33 | 9 |
| Quadrant | Total seconds | Saturated seconds | Saturation percentage |
|---|---|---|---|
| A | 19686 | 139 | 0.706086% |
| B | 19631 | 157 | 0.799755% |
| C | 19648 | 190 | 0.967020% |
| D | 19128 | 1022 | 5.342953% |
Noise dominated data is calculated using 1-second bins in cleaned event files. If a bin has >2000 counts, and if more than 50% of those come from <1% of pixels, then it is considered to be noise-dominated and hence unusable.
| Quadrant | # 1 sec bins | Bins with >0 counts | Bins with >2000 counts | High rate bins dominated by noise | Noise dominated (total time) | Noise dominated (detector-on time) | Marked lightcurve |
|---|---|---|---|---|---|---|---|
| A | 26010 | 20307 | 31 | 31 | 0.12% | 0.15% | 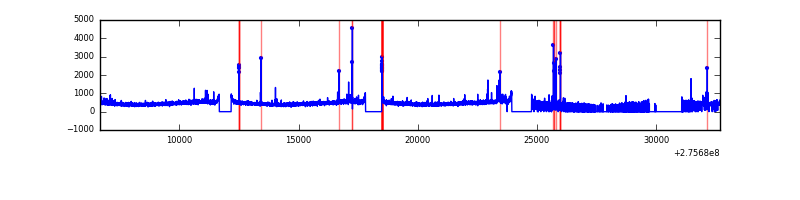 |
| B | 26010 | 20228 | 8 | 8 | 0.03% | 0.04% | 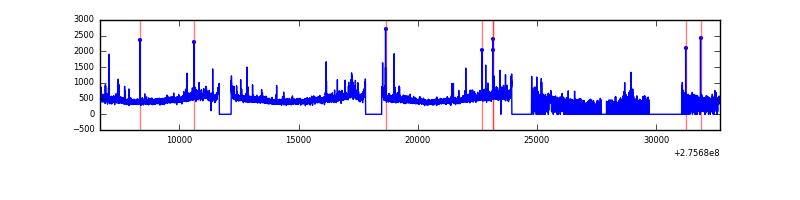 |
| C | 26010 | 20281 | 2 | 2 | 0.01% | 0.01% | 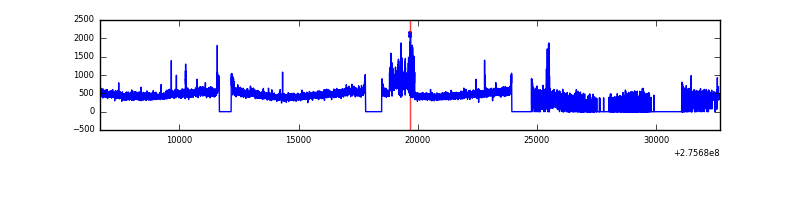 |
| D | 26010 | 19711 | 728 | 728 | 2.80% | 3.69% | 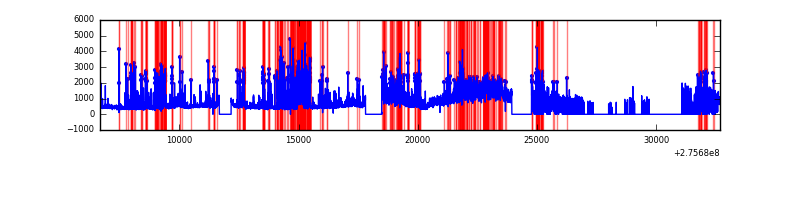 |
Top three noisy pixels from each quadrant. If the there are fewer than three noisy pixels in the level2.evt file, extra rows are filled as -1
| Pixel properties | Quadrant properties | ||||||
|---|---|---|---|---|---|---|---|
| Quadrant | DetID | PixID | Counts | Sigma | Mean | Median | Sigma |
| A | 15 | 174 | 143726 | 306.05 | 2309 | 2256 | 462.2 |
| A | 4 | 2 | 127013 | 269.89 | 2309 | 2256 | 462.2 |
| A | 3 | 1 | 24399 | 47.9 | 2309 | 2256 | 462.2 |
| B | 0 | 198 | 137057 | 305.83 | 2313 | 2253 | 440.8 |
| B | 3 | 64 | 100547 | 223.0 | 2313 | 2253 | 440.8 |
| B | 0 | 189 | 78796 | 173.65 | 2313 | 2253 | 440.8 |
| C | 7 | 247 | 547605 | 1055.66 | 2215 | 2225 | 516.6 |
| C | 14 | 238 | 337771 | 649.5 | 2215 | 2225 | 516.6 |
| C | 3 | 233 | 105861 | 200.6 | 2215 | 2225 | 516.6 |
| D | 1 | 52 | 5546123 | 10583.96 | 2139 | 2071 | 523.8 |
| D | 2 | 233 | 2619994 | 4997.79 | 2139 | 2071 | 523.8 |
| D | 15 | 0 | 113695 | 213.1 | 2139 | 2071 | 523.8 |
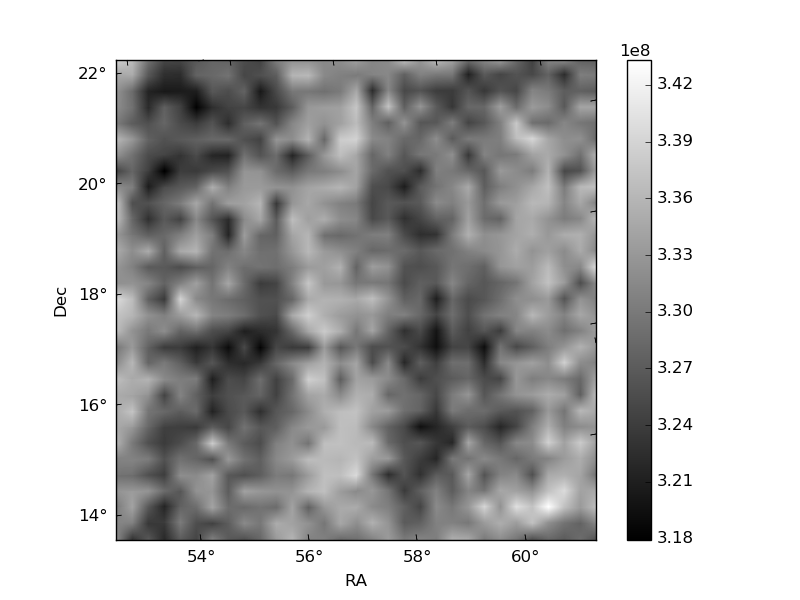
Histogram calculated using DETX and DETY for each event in the final _common_clean file
| Quadrant A | 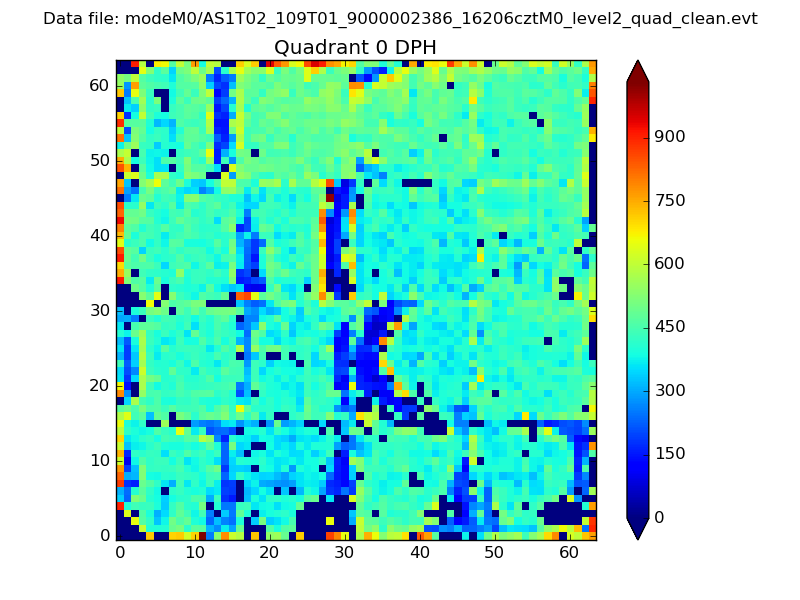 |
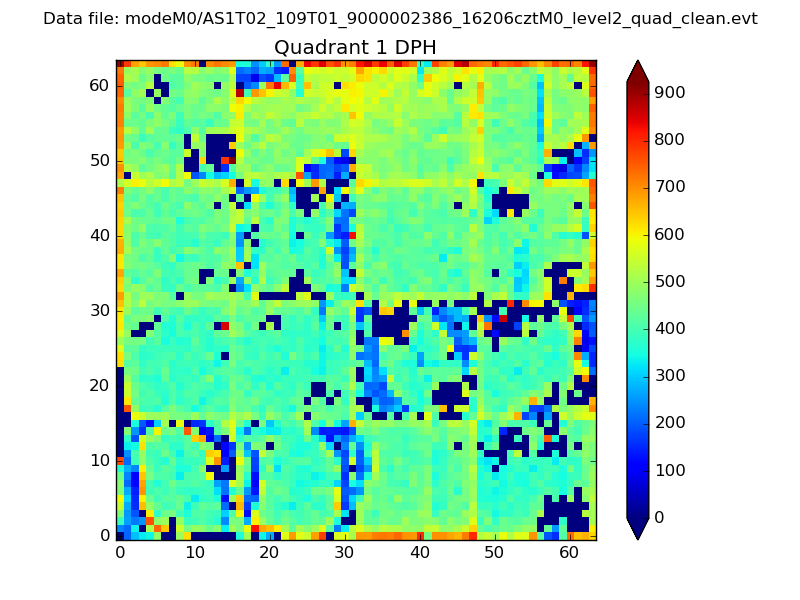 |
Quadrant B |
|---|---|---|---|
| Quadrant D |  |
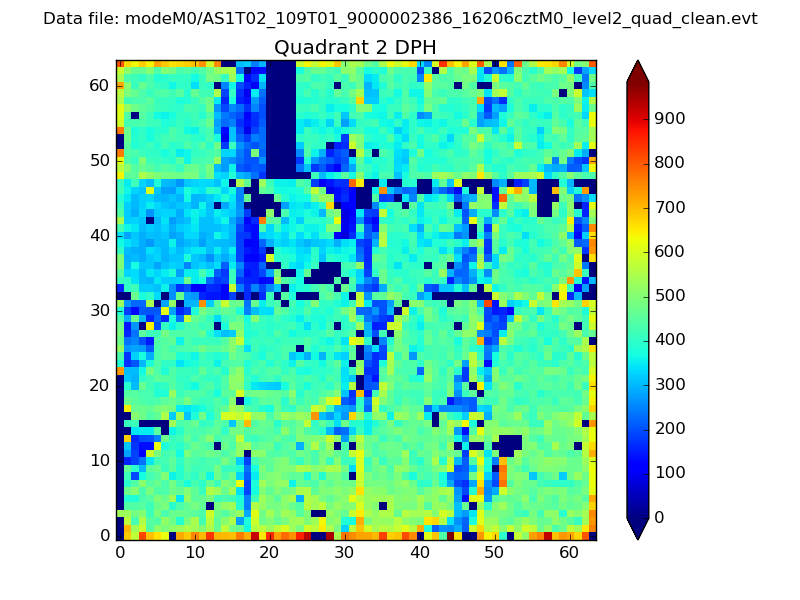 |
Quadrant C |
| Plot type | Count rate plots | Images |
|---|---|---|
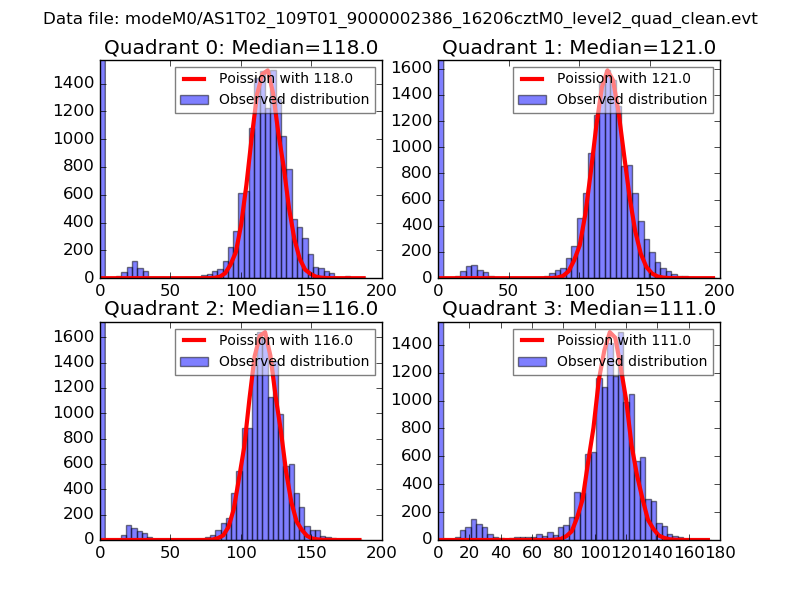
| Comparison with Poisson distribution Blue bars denote a histogram of data divided into 1 sec bins. Red curve is a Poisson curve with rate = median count rate of data. |
 |
 |
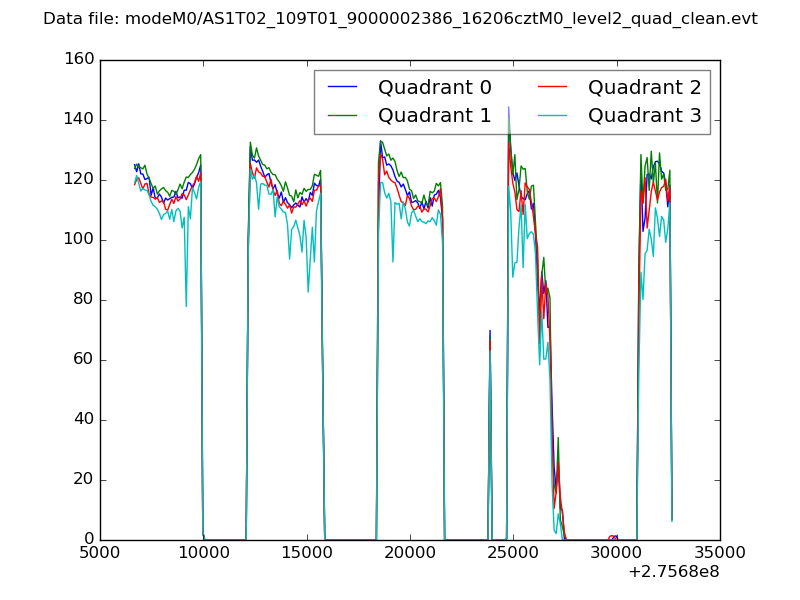
| Quadrant-wise count rates Data is divided into 100 sec bins |
 |
|
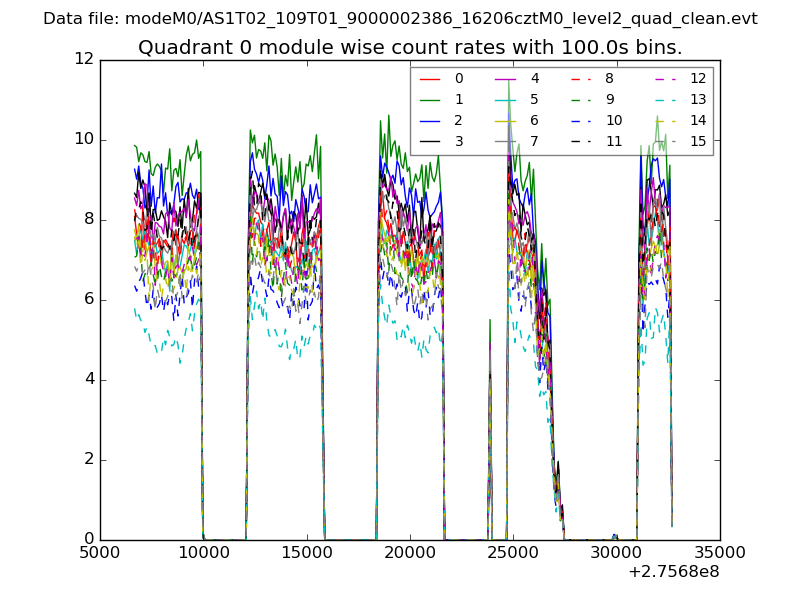
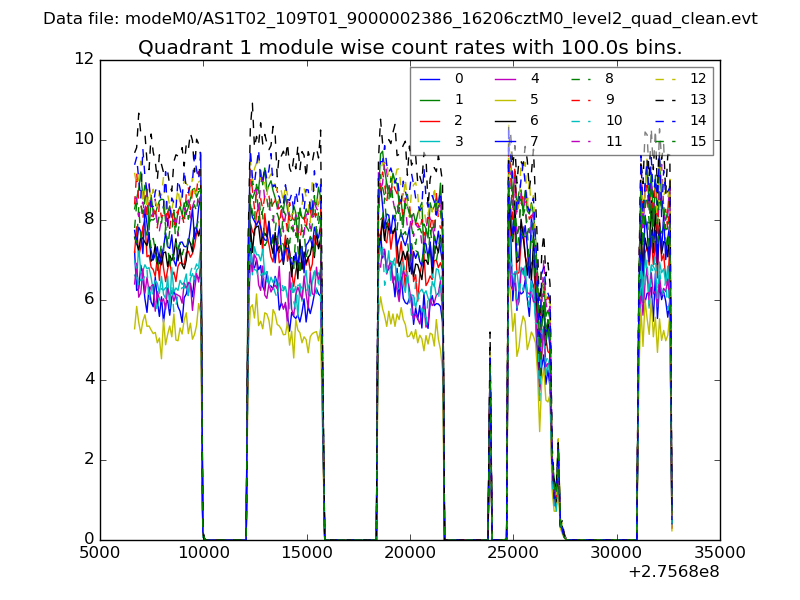
| Module-wise count rates for Quadrant A Data is divided into 100 sec bins |
 |
 |
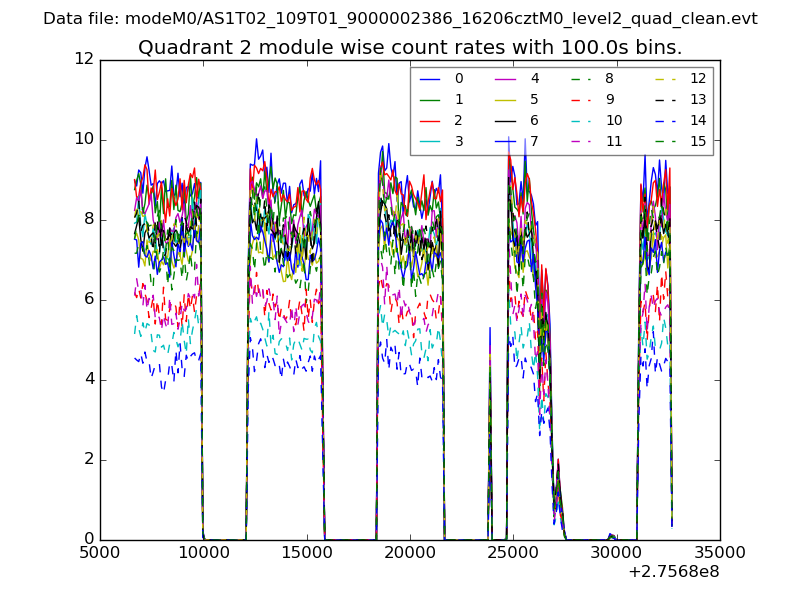
| Module-wise count rates for Quadrant B Data is divided into 100 sec bins |
 |
 |
| Module-wise count rates for Quadrant C Data is divided into 100 sec bins |
 |
 |
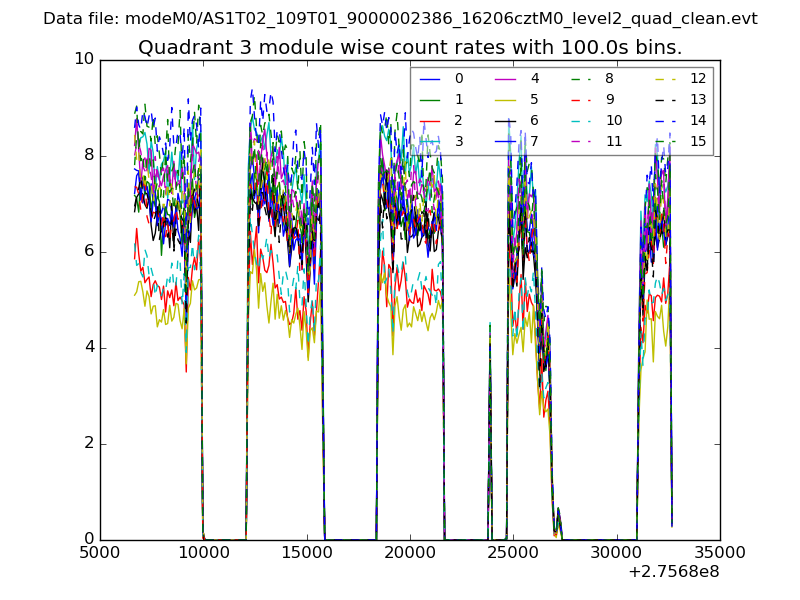
| Module-wise count rates for Quadrant D Data is divided into 100 sec bins |
 |
 |
| Parameter | Plot |
|---|---|
| CZT HV Monitor | 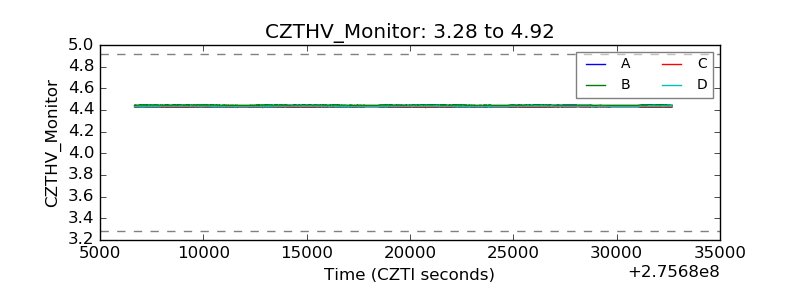 |
| D_VDD | 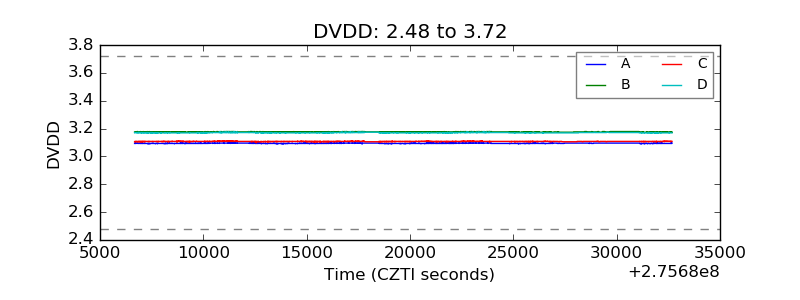 |
| Temperature 1 | 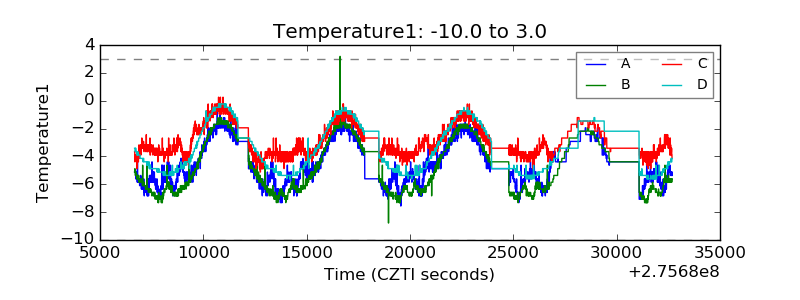 |
| Veto HV Monitor | 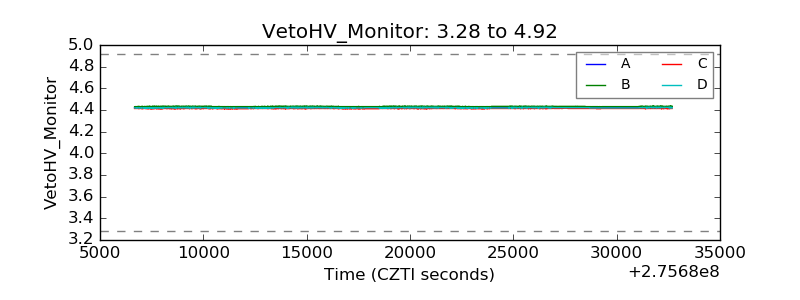 |
| Veto LLD | 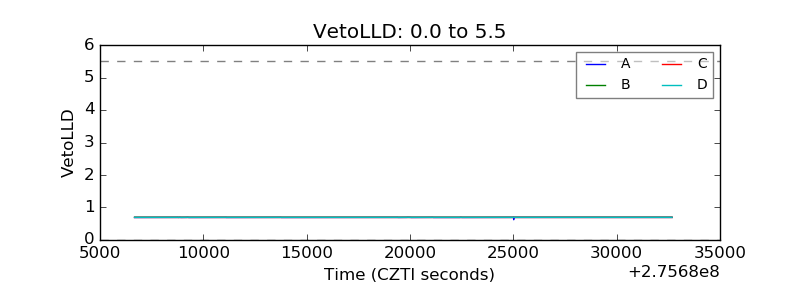 |
| Alpha Counter | 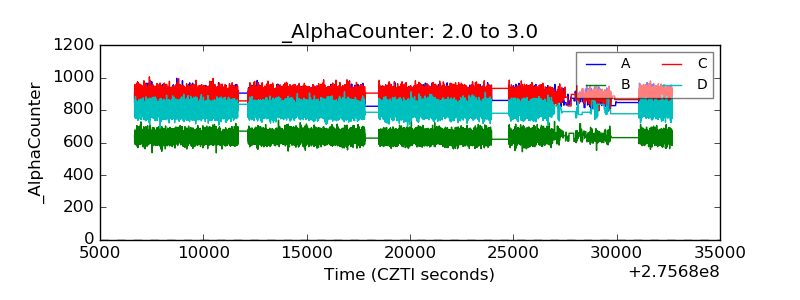 |
| _CPM_Rate | 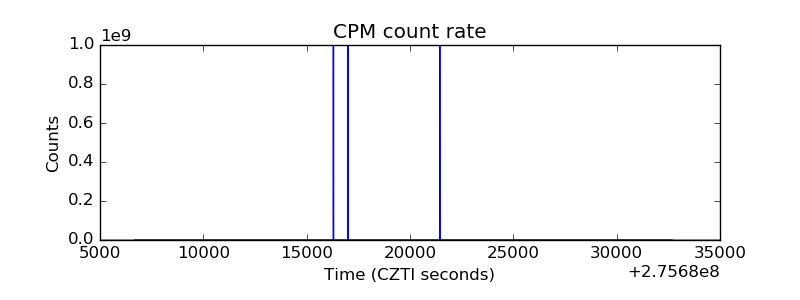 |
| CZT Counter | 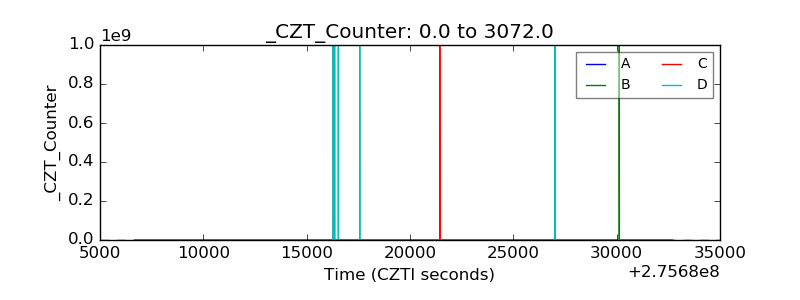 |
| +2.5 Volts monitor | 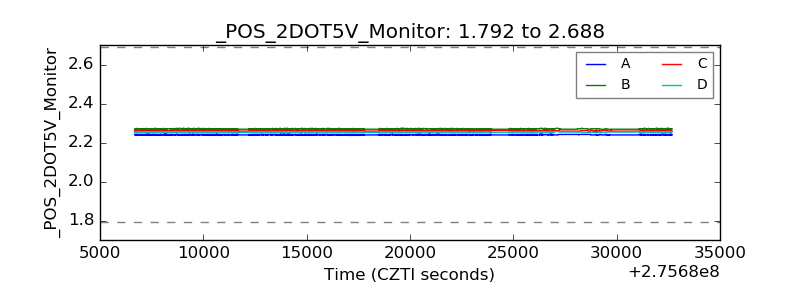 |
| +5 Volts monitor |  |
| _ROLL_ROT | 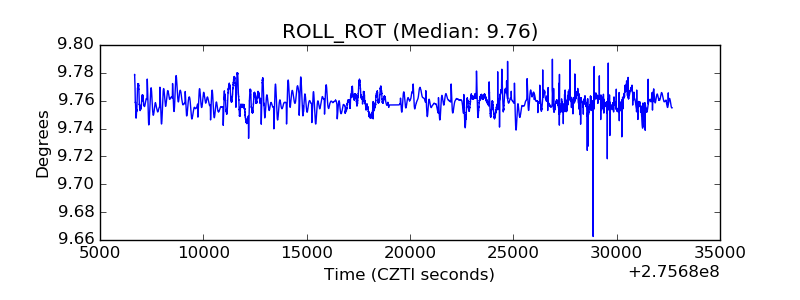 |
| _Roll_DEC | 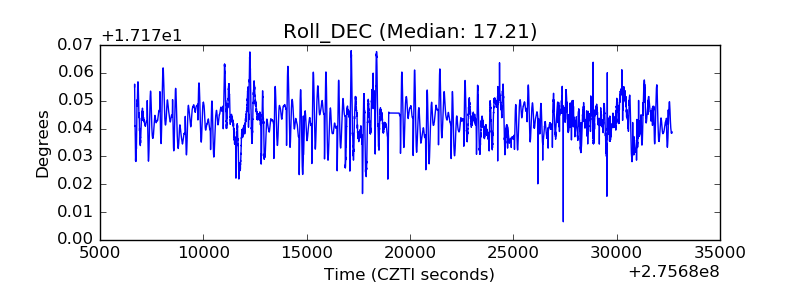 |
| _Roll_RA | 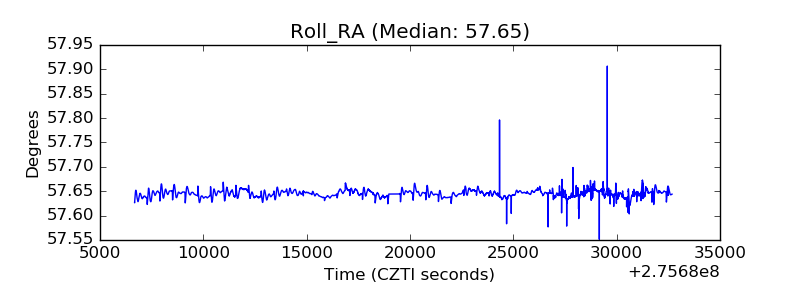 |
| Veto Counter | 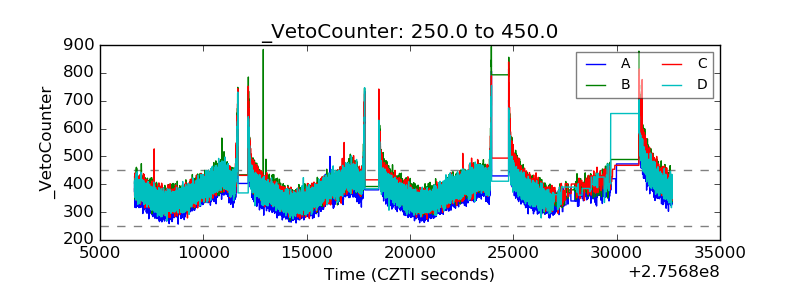 |