| Param | Original file | Final file |
|---|---|---|
| Filename | modeM0/AS1T02_109T01_9000002386_16208cztM0_level2.evt | modeM0/AS1T02_109T01_9000002386_16208cztM0_level2_quad_clean.evt |
| Size (bytes) | 628,957,440 | 93,090,240 |
| Size | 599.8 MB | 88.8 MB |
| Events in quadrant A | 3,382,610 | 598,820 |
| Events in quadrant B | 3,351,994 | 615,960 |
| Events in quadrant C | 3,247,051 | 585,069 |
| Events in quadrant D | 8,615,251 | 554,503 |
| Mode M0 | |||
|---|---|---|---|
| Quadrant | BADHDUFLAG | Total packets | Discarded packets |
| A | 0 | 14286 | 3 |
| B | 0 | 14080 | 2 |
| C | 0 | 13791 | 2 |
| D | 0 | 30313 | 2 |
| Mode SS | |||
|---|---|---|---|
| Quadrant | BADHDUFLAG | Total packets | Discarded packets |
| A | 0 | 136 | 0 |
| B | 0 | 136 | 0 |
| C | 0 | 136 | 0 |
| D | 0 | 136 | 0 |
| Mode M9 | |||
|---|---|---|---|
| Quadrant | BADHDUFLAG | Total packets | Discarded packets |
| A | 0 | 17 | 0 |
| B | 0 | 17 | 0 |
| C | 0 | 17 | 0 |
| D | 0 | 18 | 0 |
| Quadrant | Total seconds | Saturated seconds | Saturation percentage |
|---|---|---|---|
| A | 6664 | 76 | 1.140456% |
| B | 6664 | 56 | 0.840336% |
| C | 6664 | 44 | 0.660264% |
| D | 6664 | 1285 | 19.282713% |
Noise dominated data is calculated using 1-second bins in cleaned event files. If a bin has >2000 counts, and if more than 50% of those come from <1% of pixels, then it is considered to be noise-dominated and hence unusable.
| Quadrant | # 1 sec bins | Bins with >0 counts | Bins with >2000 counts | High rate bins dominated by noise | Noise dominated (total time) | Noise dominated (detector-on time) | Marked lightcurve |
|---|---|---|---|---|---|---|---|
| A | 7790 | 6666 | 28 | 28 | 0.36% | 0.42% | 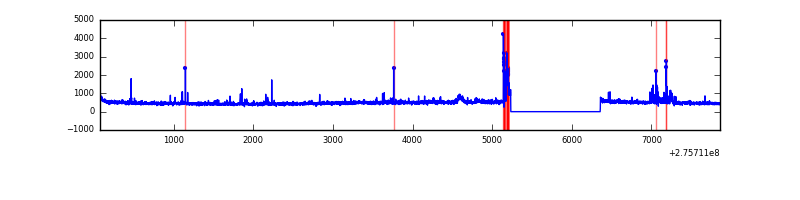 |
| B | 7790 | 6666 | 7 | 7 | 0.09% | 0.11% | 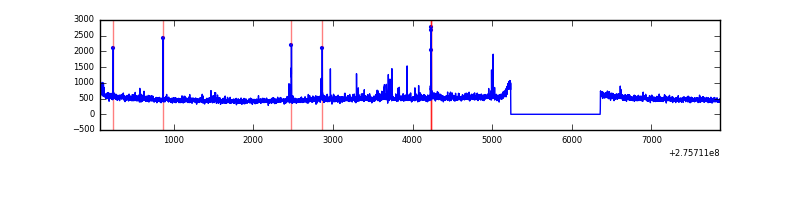 |
| C | 7790 | 6666 | 0 | 0 | 0.00% | 0.00% | 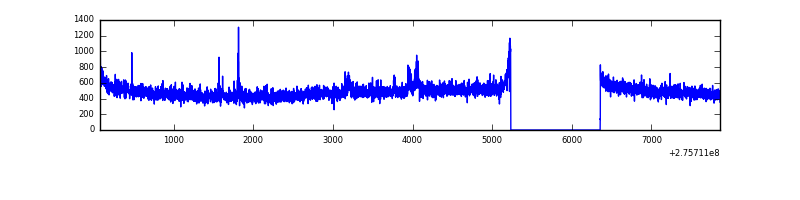 |
| D | 7790 | 6666 | 1049 | 1049 | 13.47% | 15.74% | 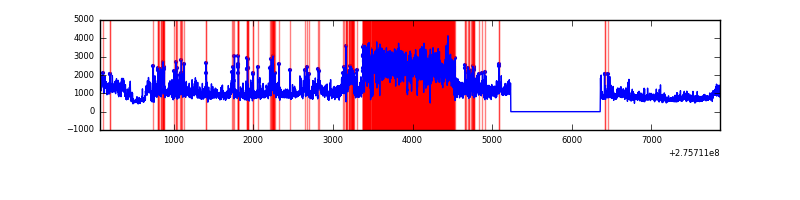 |
Top three noisy pixels from each quadrant. If the there are fewer than three noisy pixels in the level2.evt file, extra rows are filled as -1
| Pixel properties | Quadrant properties | ||||||
|---|---|---|---|---|---|---|---|
| Quadrant | DetID | PixID | Counts | Sigma | Mean | Median | Sigma |
| A | 4 | 2 | 111939 | 673.28 | 816 | 801 | 165.1 |
| A | 15 | 174 | 81993 | 491.87 | 816 | 801 | 165.1 |
| A | 8 | 247 | 53160 | 317.2 | 816 | 801 | 165.1 |
| B | 0 | 198 | 67945 | 433.31 | 815 | 794 | 155.0 |
| B | 3 | 64 | 23819 | 148.57 | 815 | 794 | 155.0 |
| B | 4 | 190 | 20971 | 130.2 | 815 | 794 | 155.0 |
| C | 14 | 238 | 119728 | 659.23 | 777 | 784 | 180.4 |
| C | 3 | 233 | 66454 | 363.97 | 777 | 784 | 180.4 |
| C | 7 | 247 | 20299 | 108.16 | 777 | 784 | 180.4 |
| D | 1 | 52 | 5476430 | 31099.45 | 718 | 694 | 176.1 |
| D | 2 | 233 | 414457 | 2349.97 | 718 | 694 | 176.1 |
| D | 2 | 234 | 22302 | 122.72 | 718 | 694 | 176.1 |
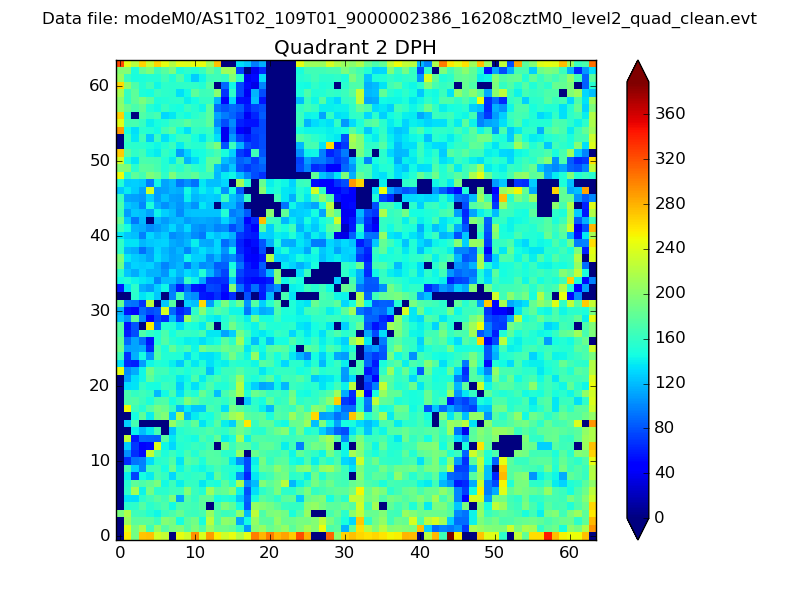
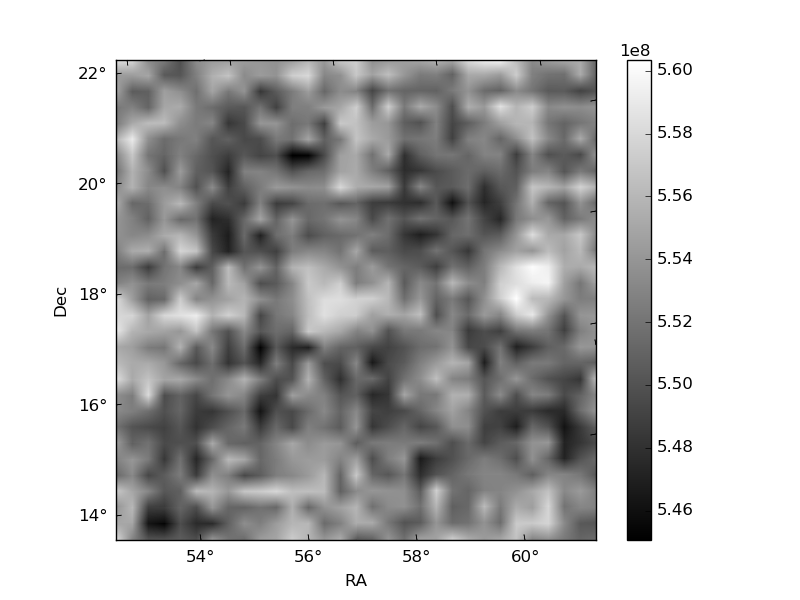
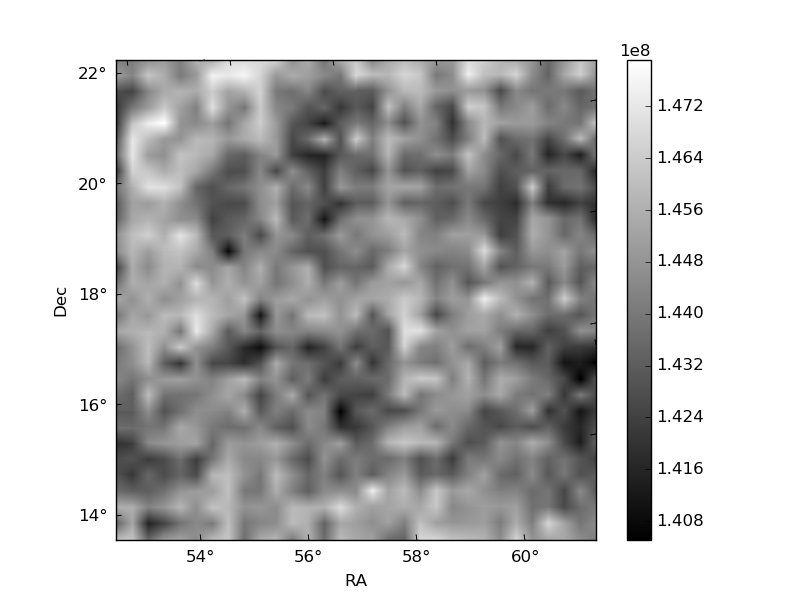
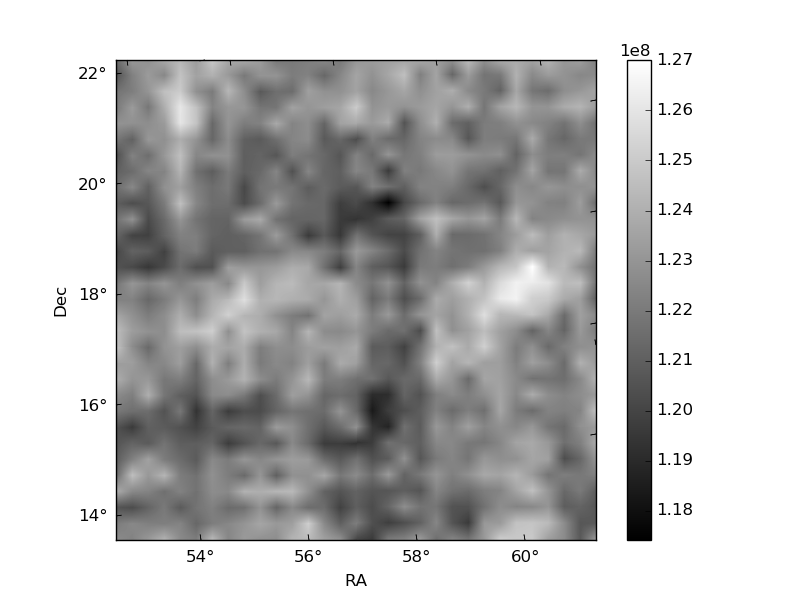
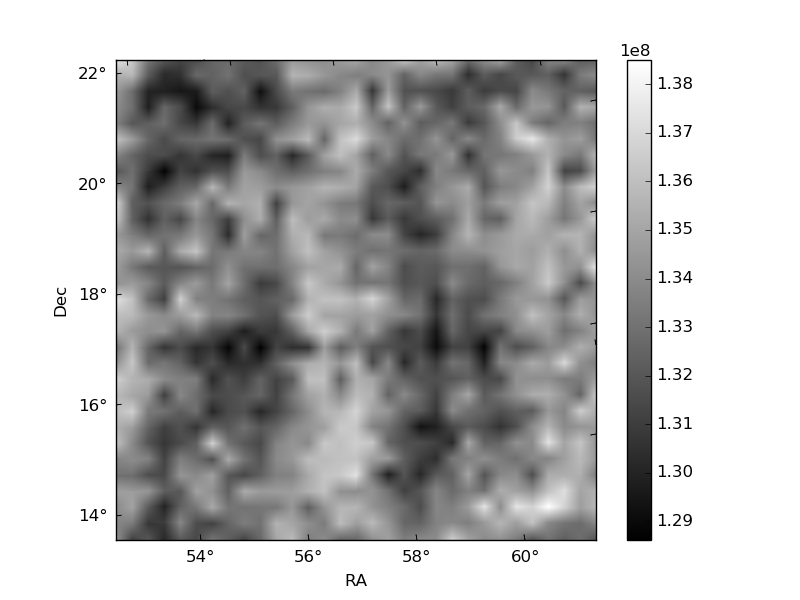
Histogram calculated using DETX and DETY for each event in the final _common_clean file
| Quadrant A | 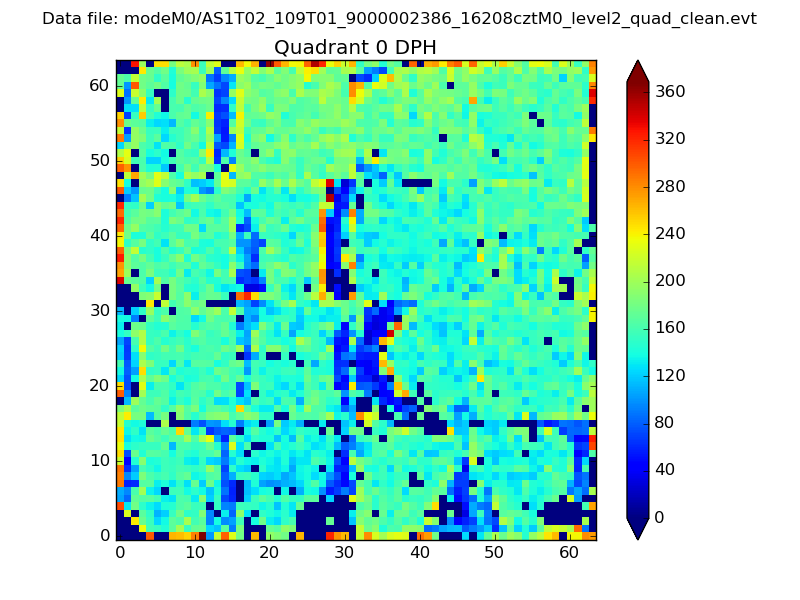 |
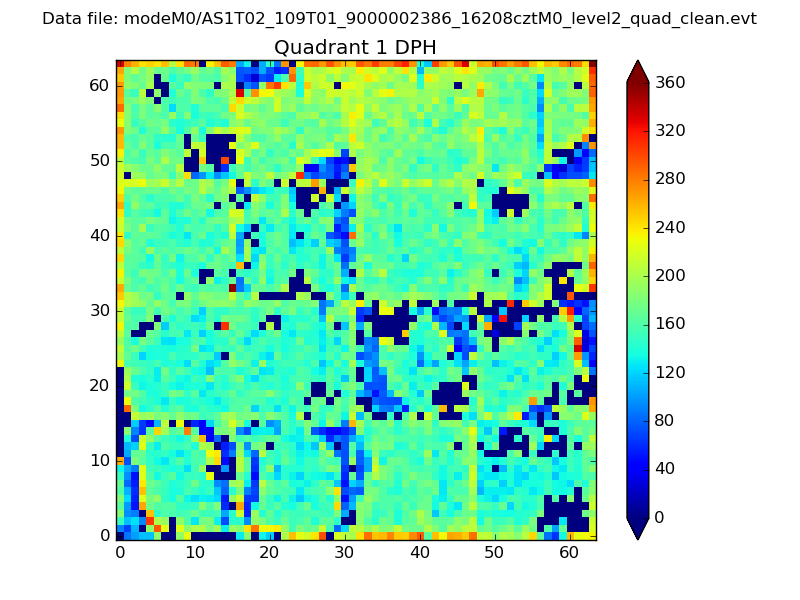 |
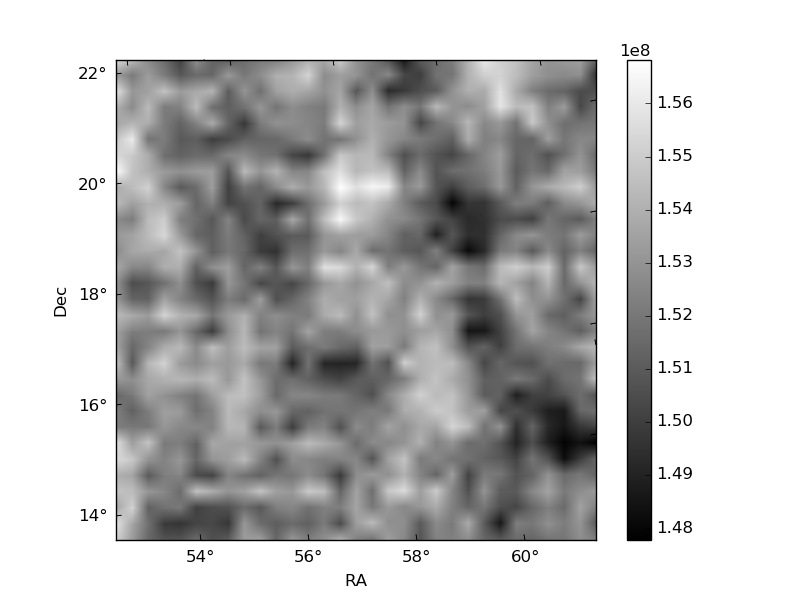
Quadrant B |
|---|---|---|---|
| Quadrant D | 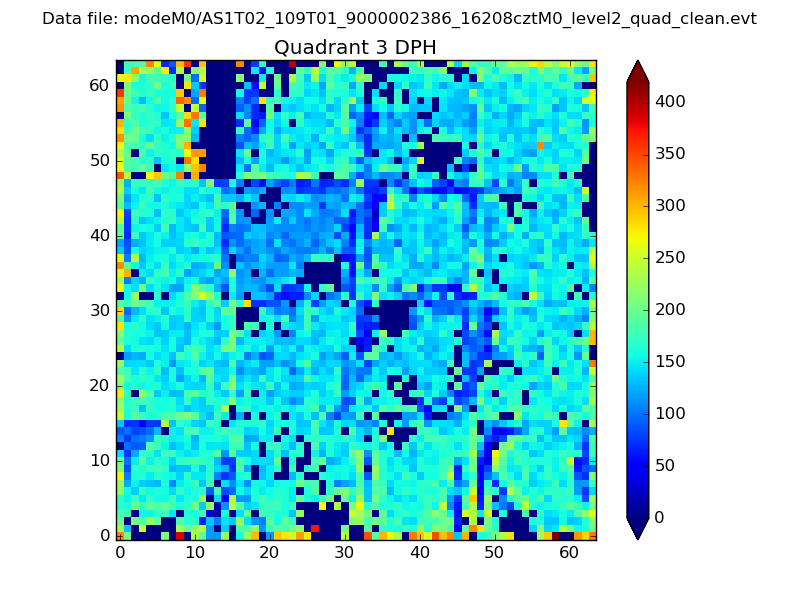 |
 |
Quadrant C |
| Plot type | Count rate plots | Images |
|---|---|---|
| Comparison with Poisson distribution Blue bars denote a histogram of data divided into 1 sec bins. Red curve is a Poisson curve with rate = median count rate of data. |
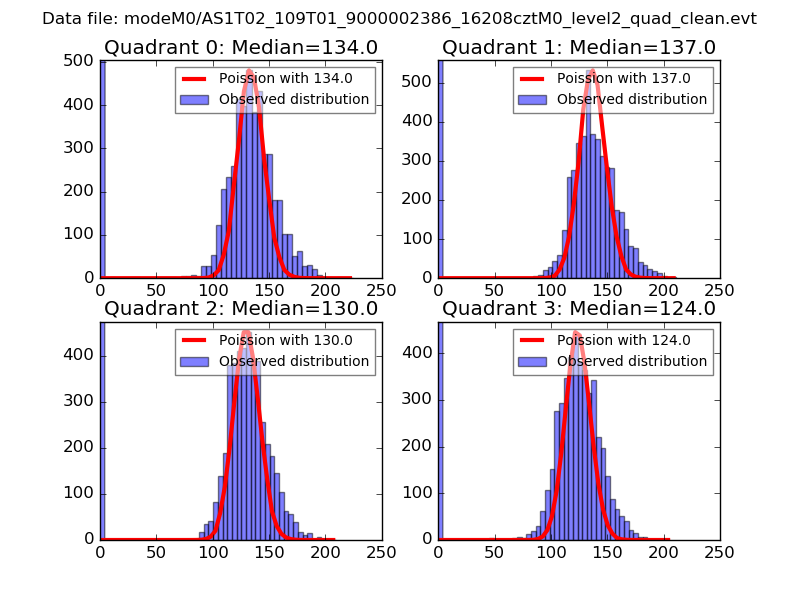 |
 |
| Quadrant-wise count rates Data is divided into 100 sec bins |
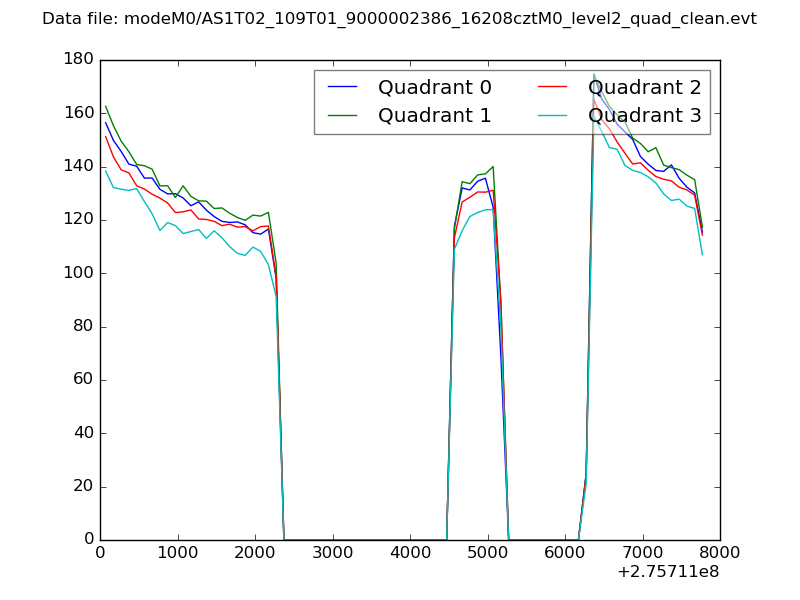 |
|
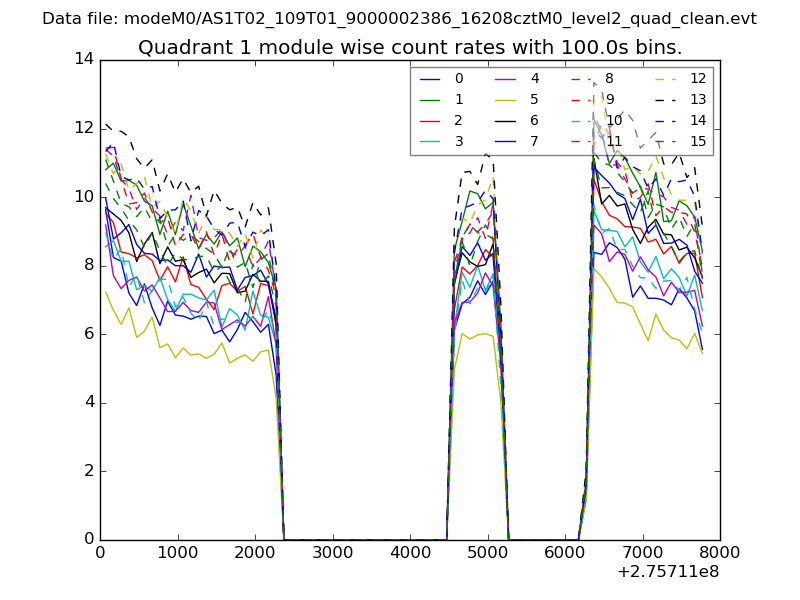
| Module-wise count rates for Quadrant A Data is divided into 100 sec bins |
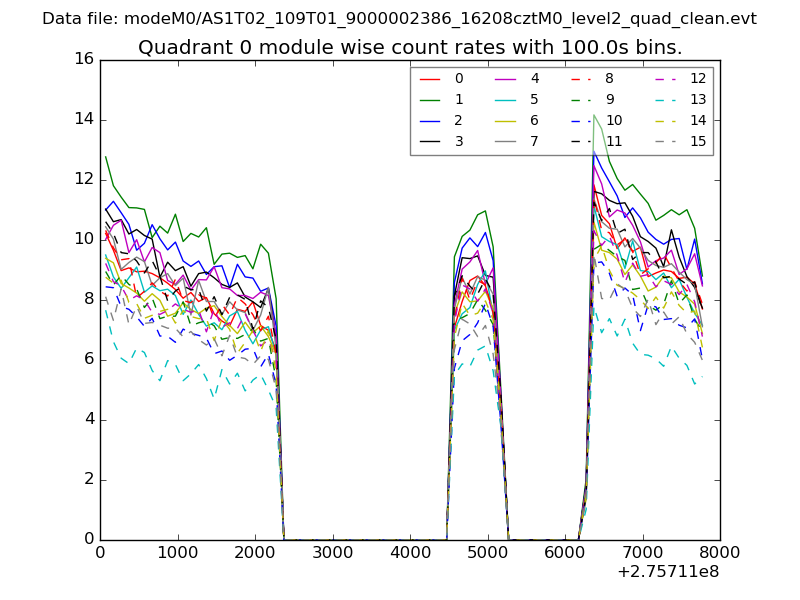 |
 |
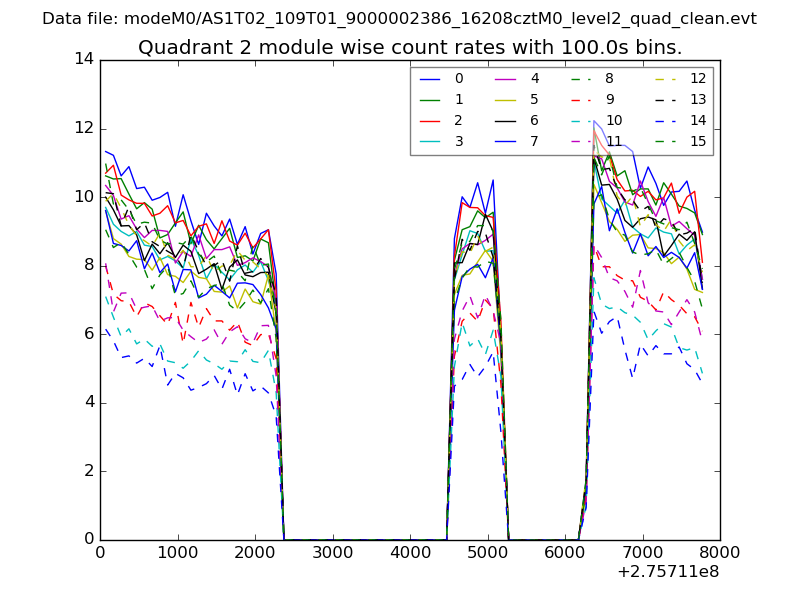
| Module-wise count rates for Quadrant B Data is divided into 100 sec bins |
 |
 |
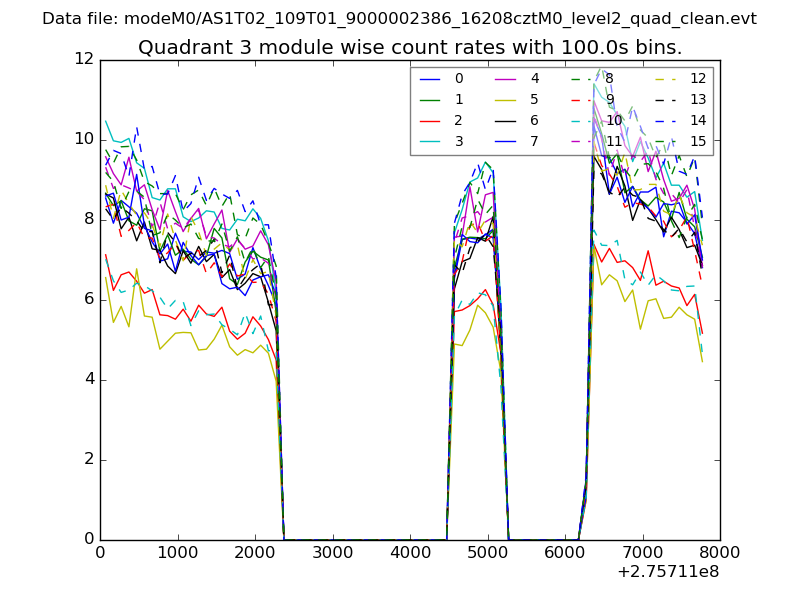
| Module-wise count rates for Quadrant C Data is divided into 100 sec bins |
 |
 |
| Module-wise count rates for Quadrant D Data is divided into 100 sec bins |
 |
 |
| Parameter | Plot |
|---|---|
| CZT HV Monitor | 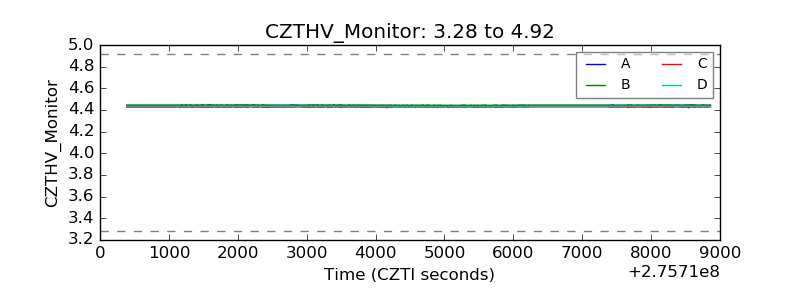 |
| D_VDD | 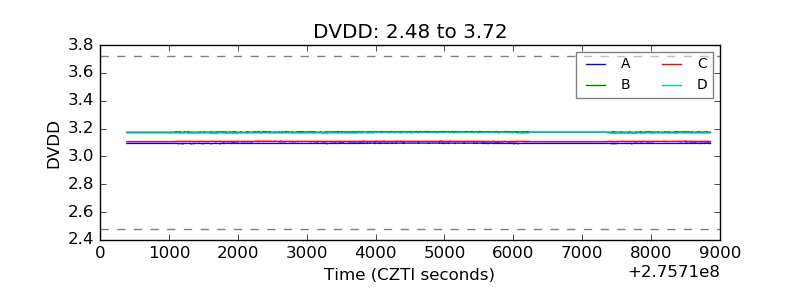 |
| Temperature 1 | 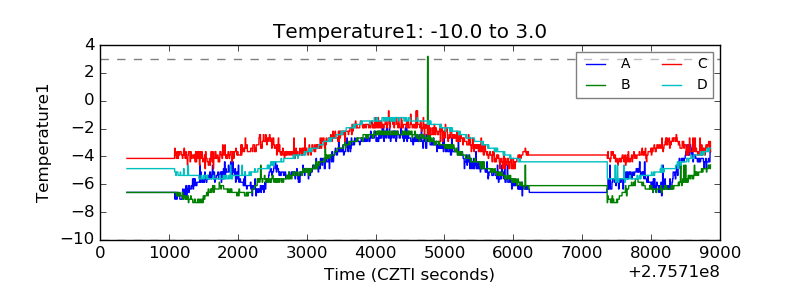 |
| Veto HV Monitor | 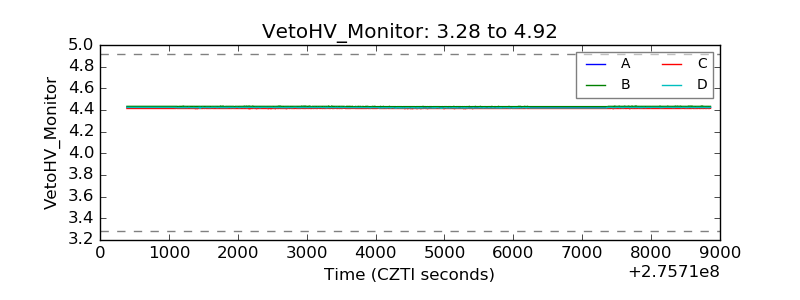 |
| Veto LLD |  |
| Alpha Counter | 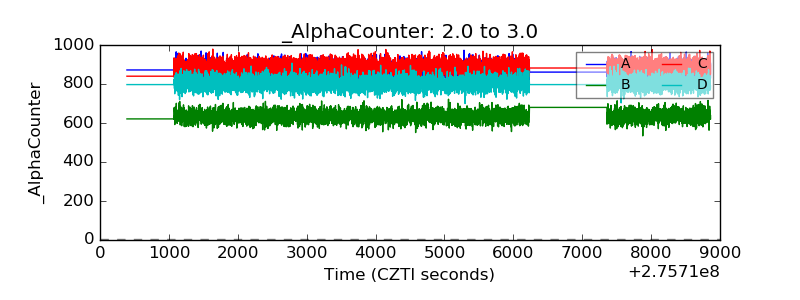 |
| _CPM_Rate | 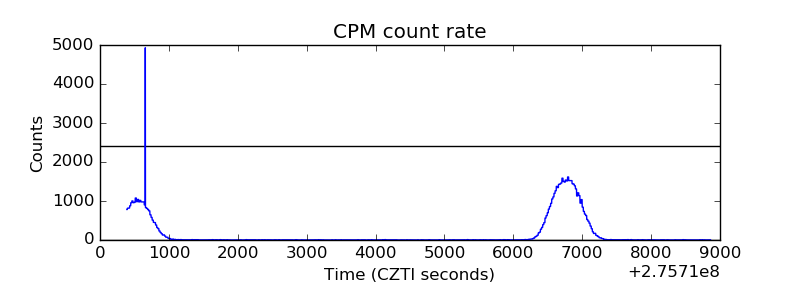 |
| CZT Counter | 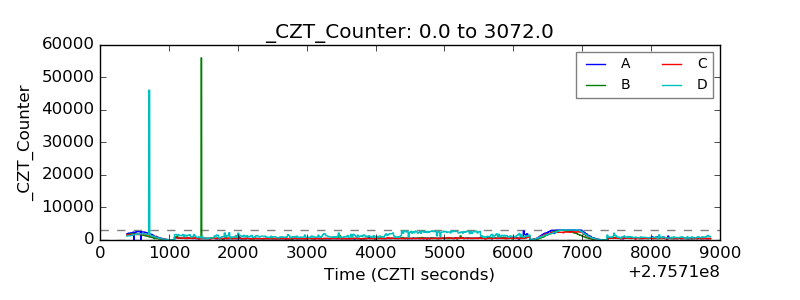 |
| +2.5 Volts monitor |  |
| +5 Volts monitor | 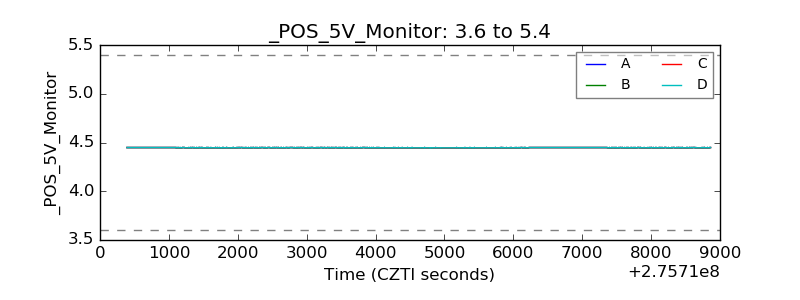 |
| _ROLL_ROT | 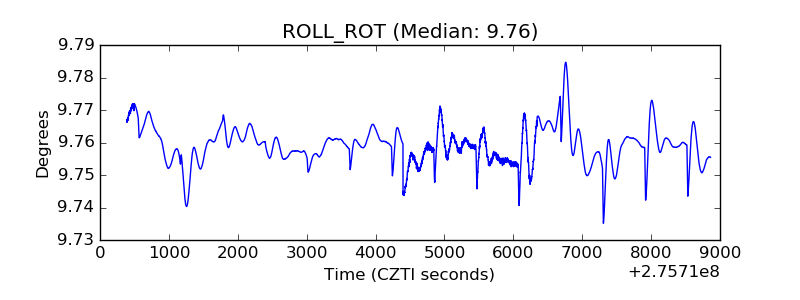 |
| _Roll_DEC | 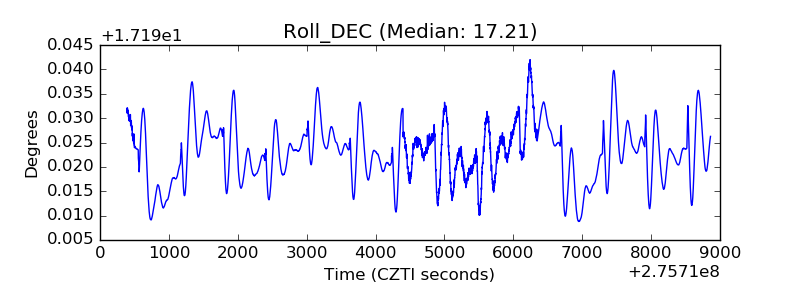 |
| _Roll_RA | 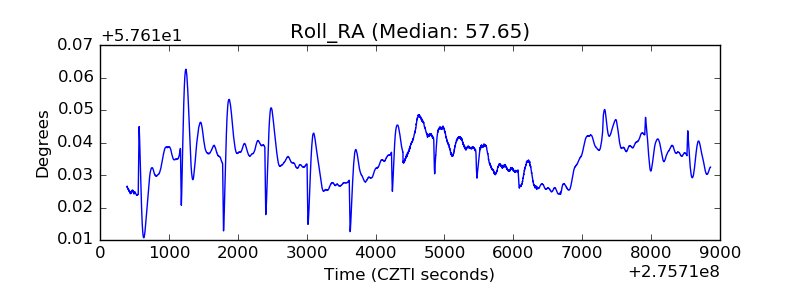 |
| Veto Counter | 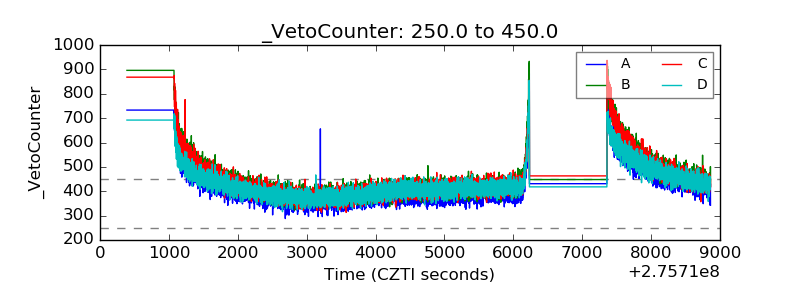 |