| Param | Original file | Final file |
|---|---|---|
| Filename | modeM0/AS1T02_109T01_9000002386_16210cztM0_level2.evt | modeM0/AS1T02_109T01_9000002386_16210cztM0_level2_quad_clean.evt |
| Size (bytes) | 434,407,680 | 76,878,720 |
| Size | 414.3 MB | 73.3 MB |
| Events in quadrant A | 3,073,878 | 489,703 |
| Events in quadrant B | 3,110,046 | 499,457 |
| Events in quadrant C | 2,990,579 | 472,246 |
| Events in quadrant D | 3,593,970 | 467,677 |
| Mode M0 | |||
|---|---|---|---|
| Quadrant | BADHDUFLAG | Total packets | Discarded packets |
| A | 0 | 12426 | 2 |
| B | 0 | 12456 | 1 |
| C | 0 | 12107 | 1 |
| D | 0 | 14123 | 1 |
| Mode SS | |||
|---|---|---|---|
| Quadrant | BADHDUFLAG | Total packets | Discarded packets |
| A | 0 | 116 | 0 |
| B | 0 | 116 | 0 |
| C | 0 | 116 | 0 |
| D | 0 | 116 | 0 |
| Mode M9 | |||
|---|---|---|---|
| Quadrant | BADHDUFLAG | Total packets | Discarded packets |
| A | 0 | 13 | 0 |
| B | 0 | 13 | 0 |
| C | 0 | 13 | 0 |
| D | 0 | 13 | 0 |
| Quadrant | Total seconds | Saturated seconds | Saturation percentage |
|---|---|---|---|
| A | 5705 | 75 | 1.314636% |
| B | 5705 | 79 | 1.384750% |
| C | 5705 | 66 | 1.156880% |
| D | 5705 | 205 | 3.593339% |
Noise dominated data is calculated using 1-second bins in cleaned event files. If a bin has >2000 counts, and if more than 50% of those come from <1% of pixels, then it is considered to be noise-dominated and hence unusable.
| Quadrant | # 1 sec bins | Bins with >0 counts | Bins with >2000 counts | High rate bins dominated by noise | Noise dominated (total time) | Noise dominated (detector-on time) | Marked lightcurve |
|---|---|---|---|---|---|---|---|
| A | 7001 | 5707 | 20 | 20 | 0.29% | 0.35% | 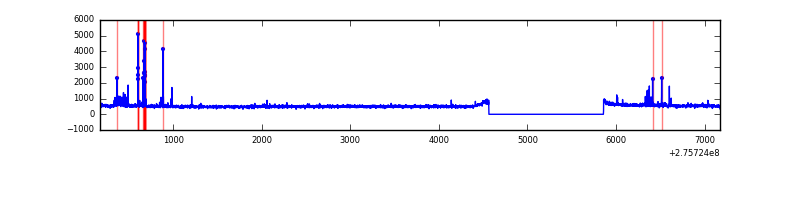 |
| B | 7001 | 5707 | 17 | 17 | 0.24% | 0.30% | 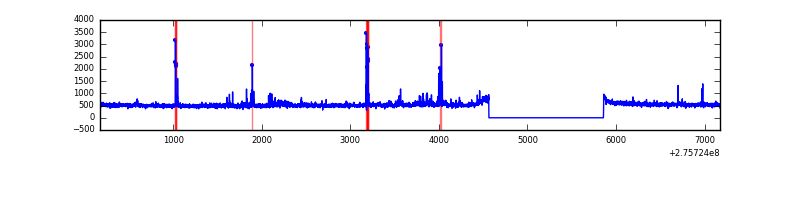 |
| C | 7001 | 5707 | 0 | 0 | 0.00% | 0.00% | 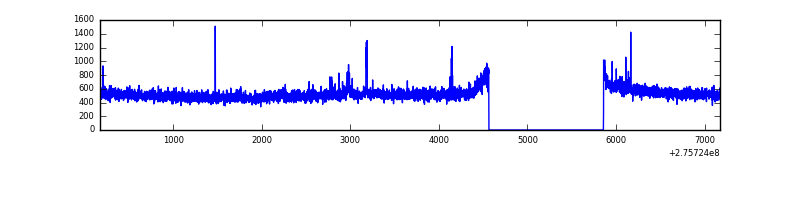 |
| D | 7001 | 5707 | 132 | 132 | 1.89% | 2.31% | 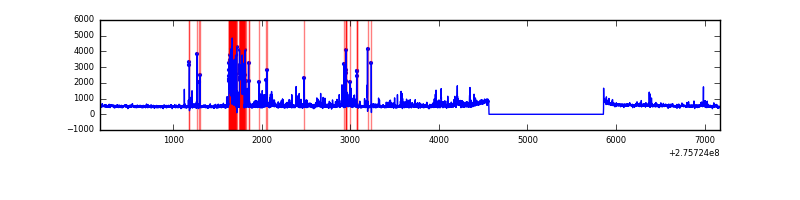 |
Top three noisy pixels from each quadrant. If the there are fewer than three noisy pixels in the level2.evt file, extra rows are filled as -1
| Pixel properties | Quadrant properties | ||||||
|---|---|---|---|---|---|---|---|
| Quadrant | DetID | PixID | Counts | Sigma | Mean | Median | Sigma |
| A | 4 | 2 | 153502 | 1002.24 | 760 | 746 | 152.4 |
| A | 0 | 226 | 6986 | 40.94 | 760 | 746 | 152.4 |
| A | 12 | 194 | 5707 | 32.55 | 760 | 746 | 152.4 |
| B | 0 | 189 | 112210 | 789.8 | 747 | 732 | 141.1 |
| B | 0 | 198 | 43571 | 303.51 | 747 | 732 | 141.1 |
| B | 15 | 201 | 22466 | 153.98 | 747 | 732 | 141.1 |
| C | 14 | 238 | 113224 | 682.13 | 716 | 722 | 164.9 |
| C | 3 | 233 | 43023 | 256.48 | 716 | 722 | 164.9 |
| C | 7 | 247 | 21920 | 128.53 | 716 | 722 | 164.9 |
| D | 1 | 52 | 356116 | 2015.49 | 726 | 706 | 176.3 |
| D | 15 | 0 | 330630 | 1870.96 | 726 | 706 | 176.3 |
| D | 2 | 233 | 142583 | 804.57 | 726 | 706 | 176.3 |
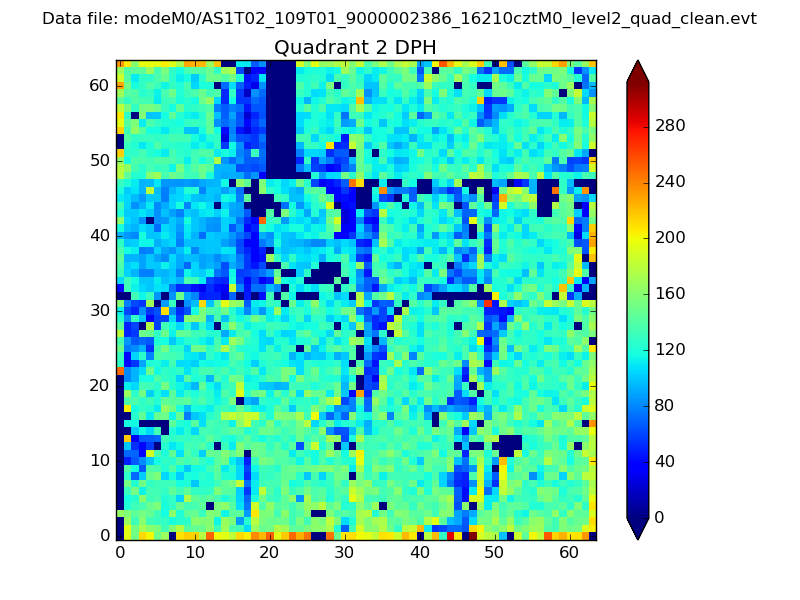
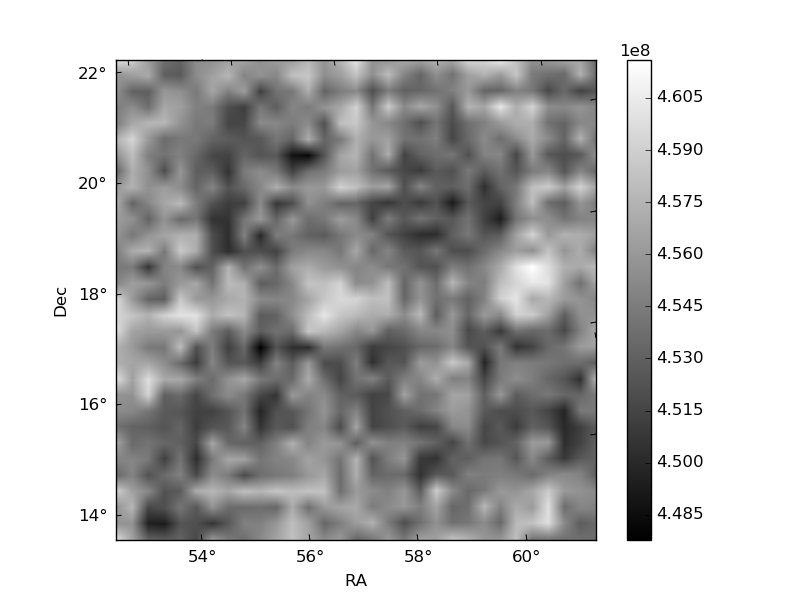
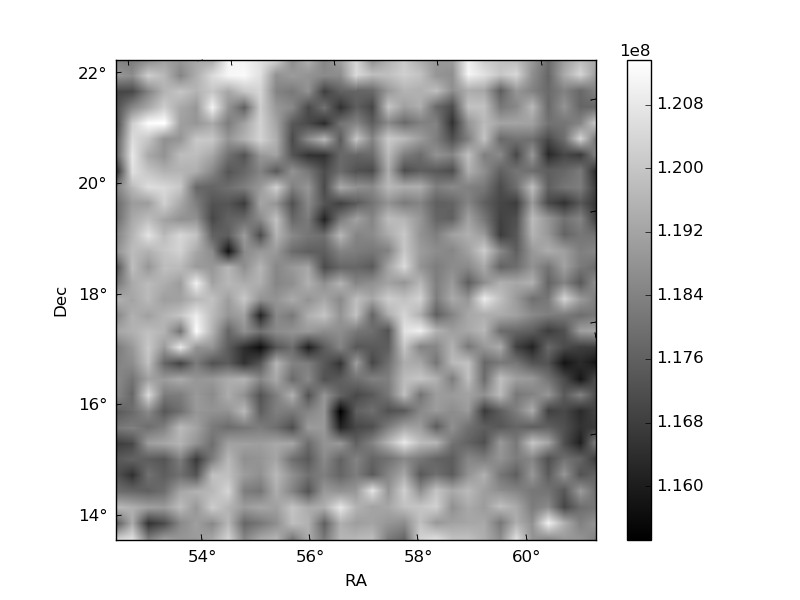
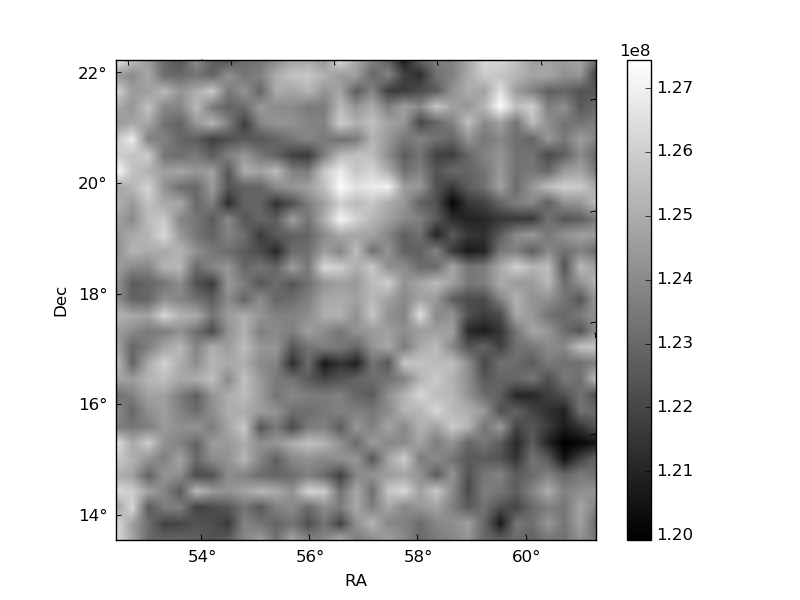
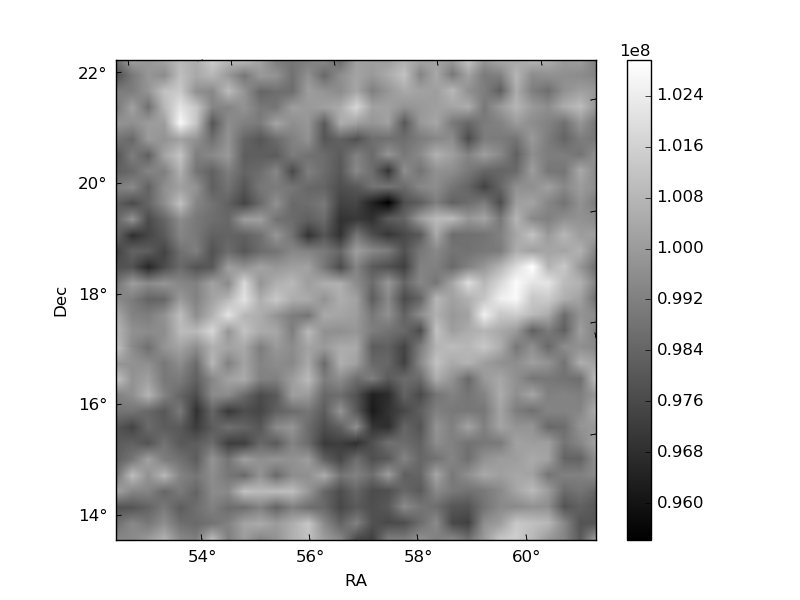
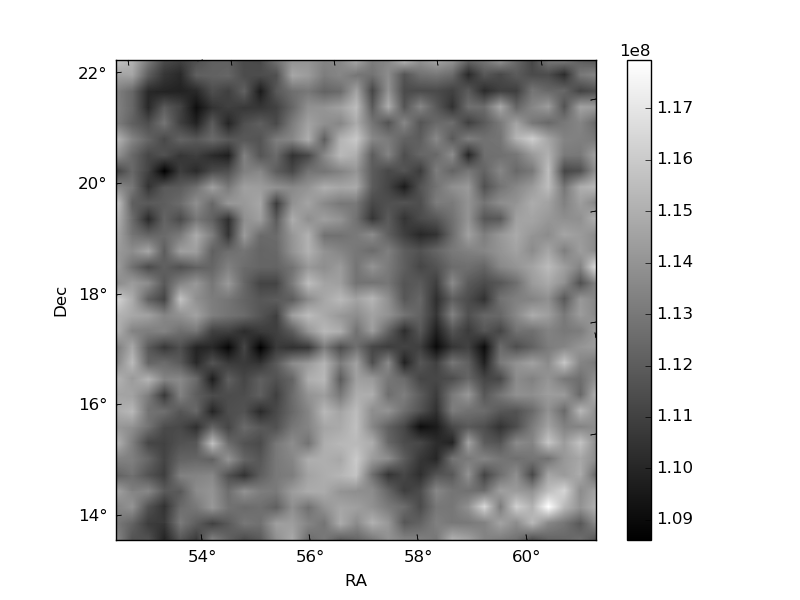
Histogram calculated using DETX and DETY for each event in the final _common_clean file
| Quadrant A | 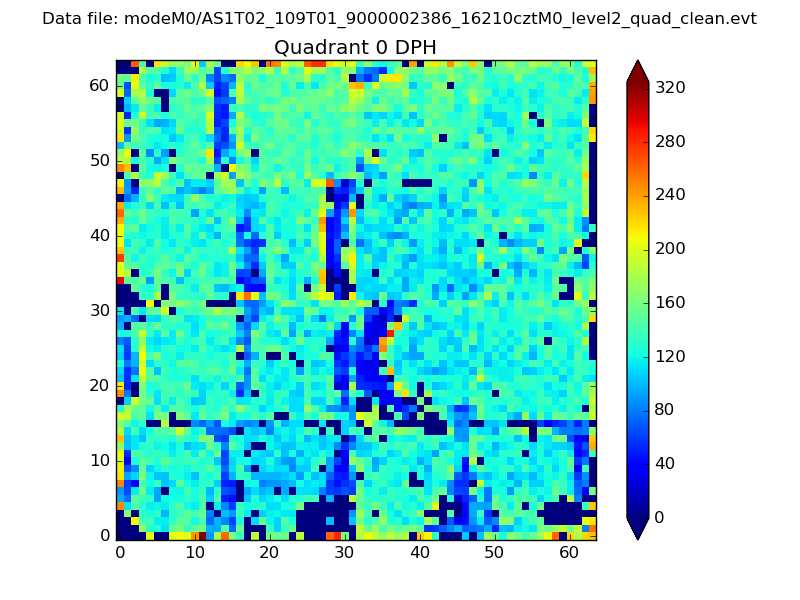 |
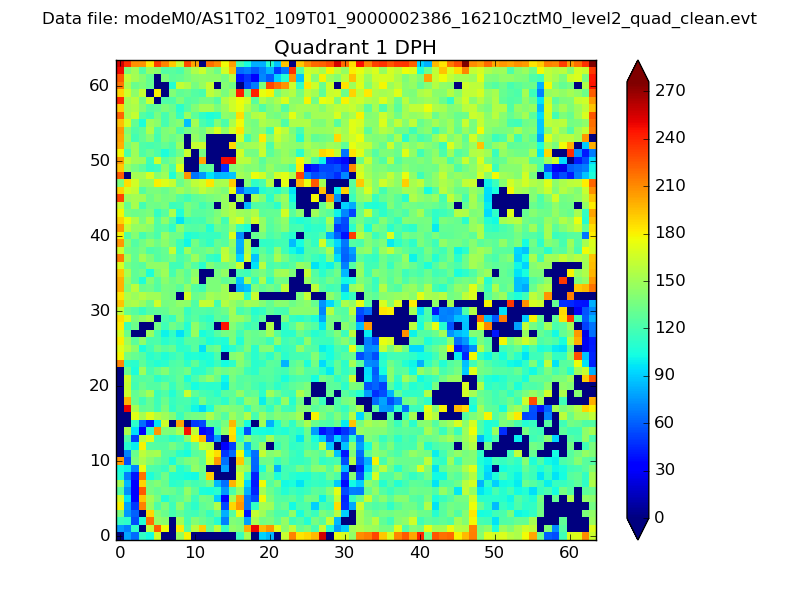 |
Quadrant B |
|---|---|---|---|
| Quadrant D | 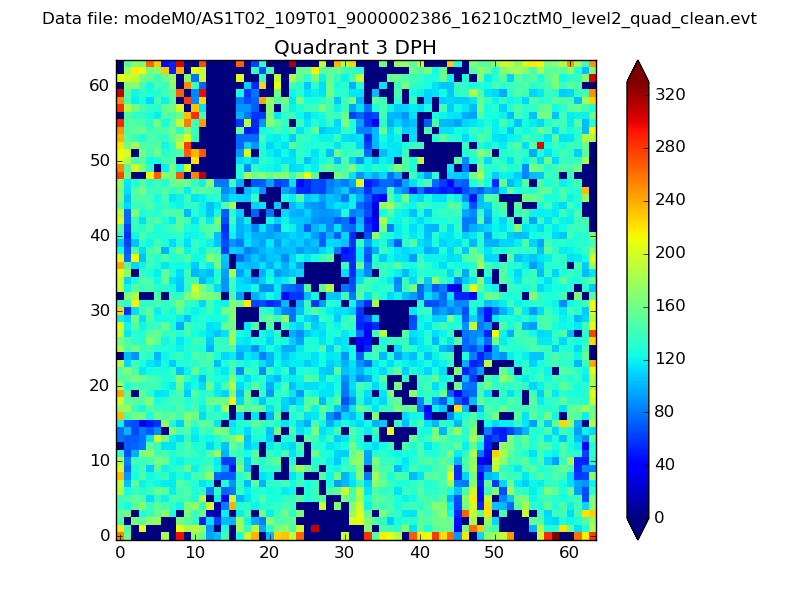 |
 |
Quadrant C |
| Plot type | Count rate plots | Images |
|---|---|---|
| Comparison with Poisson distribution Blue bars denote a histogram of data divided into 1 sec bins. Red curve is a Poisson curve with rate = median count rate of data. |
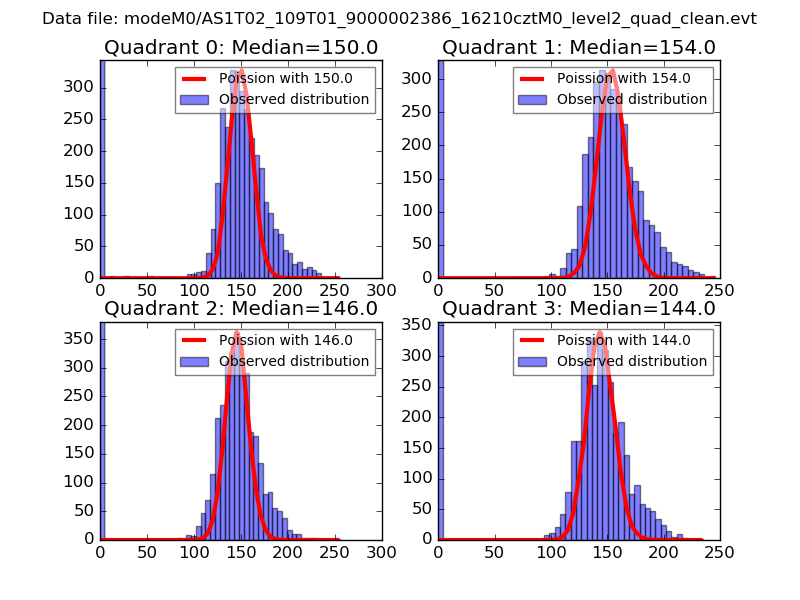 |
 |
| Quadrant-wise count rates Data is divided into 100 sec bins |
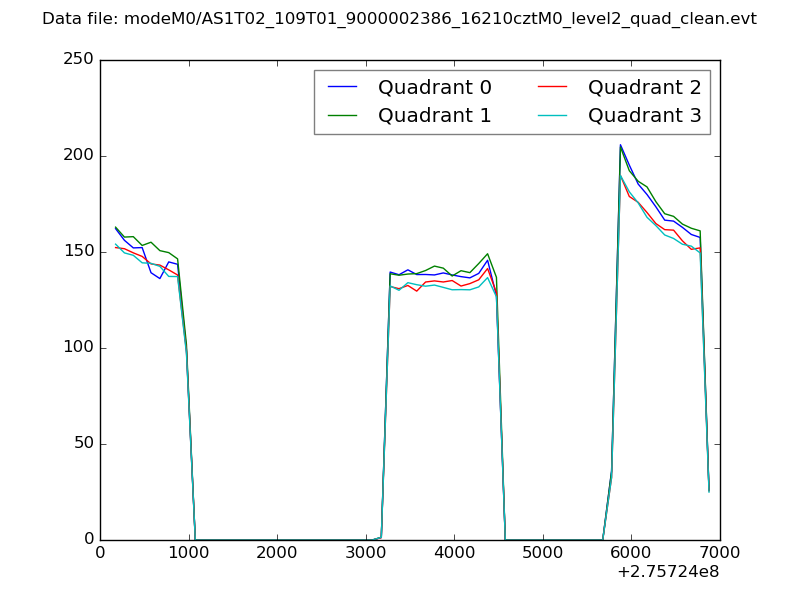 |
|
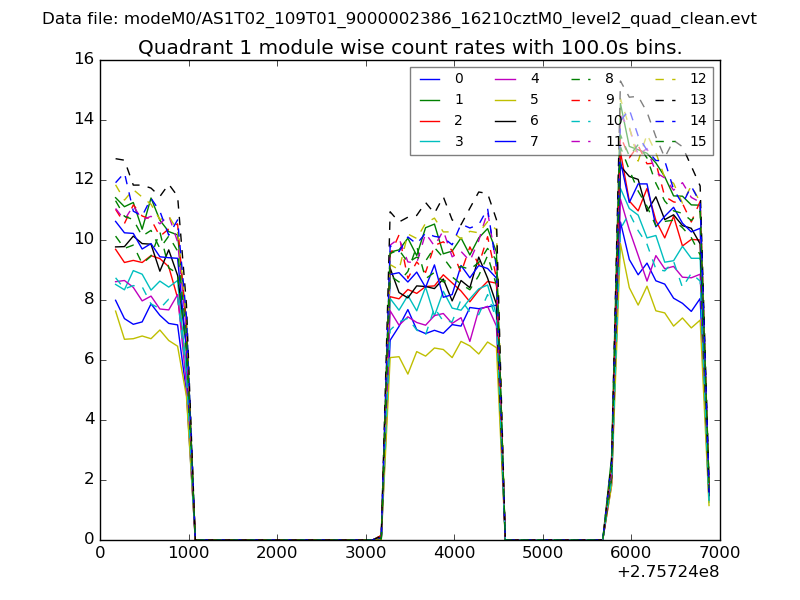
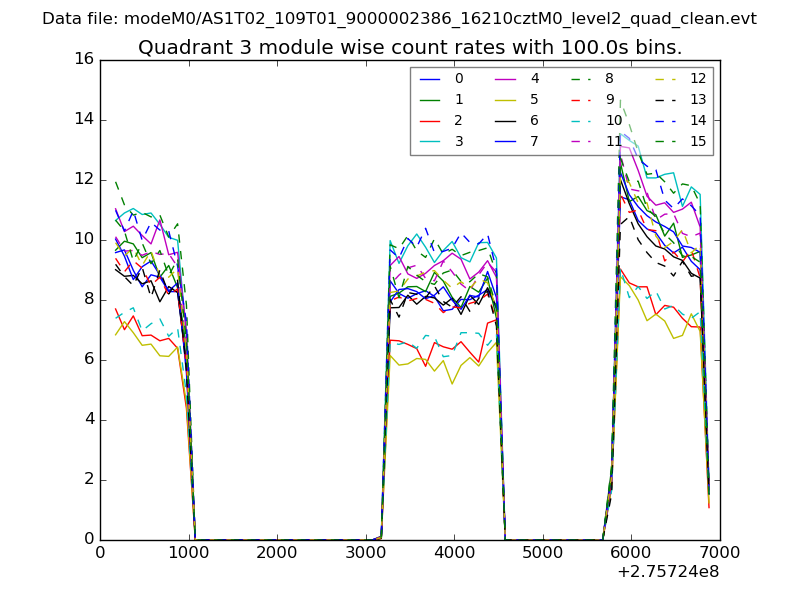
| Module-wise count rates for Quadrant A Data is divided into 100 sec bins |
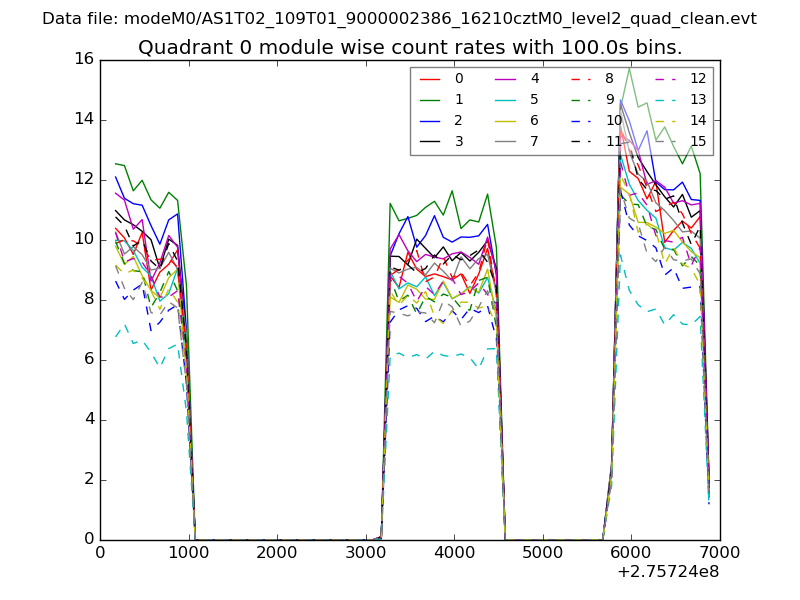 |
 |
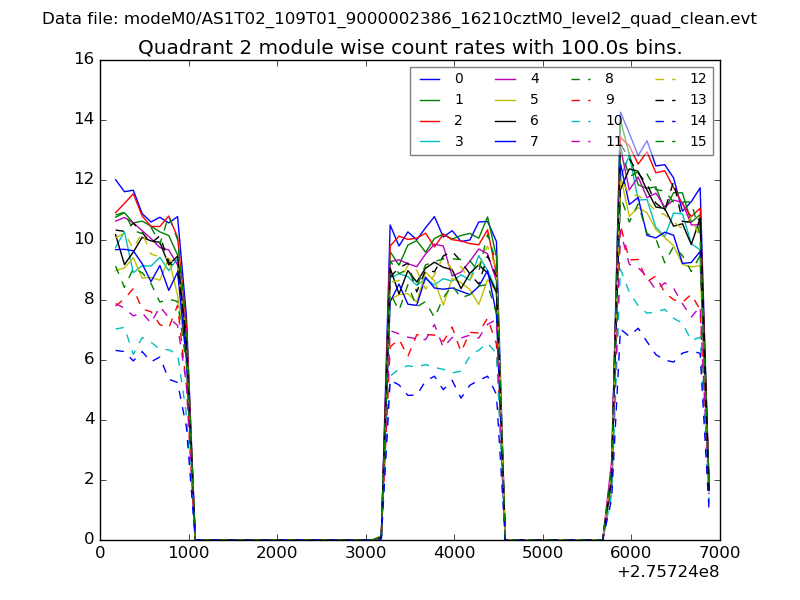
| Module-wise count rates for Quadrant B Data is divided into 100 sec bins |
 |
 |
| Module-wise count rates for Quadrant C Data is divided into 100 sec bins |
 |
 |
| Module-wise count rates for Quadrant D Data is divided into 100 sec bins |
 |
 |
| Parameter | Plot |
|---|---|
| CZT HV Monitor | 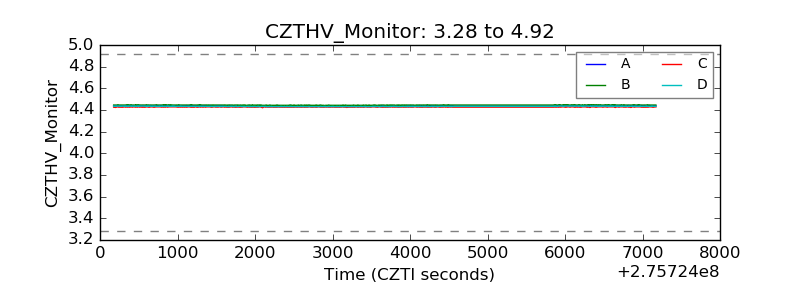 |
| D_VDD | 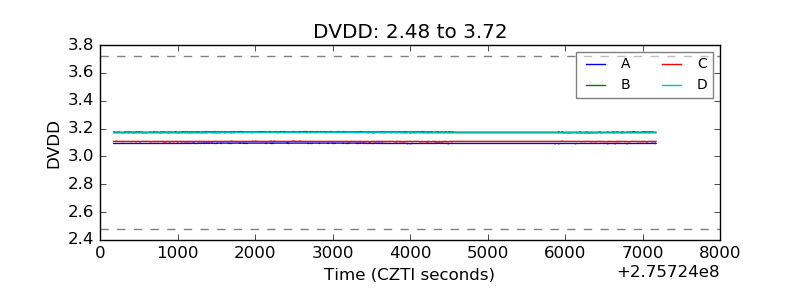 |
| Temperature 1 | 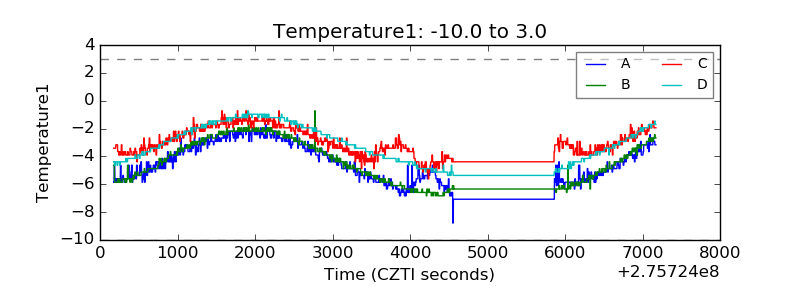 |
| Veto HV Monitor | 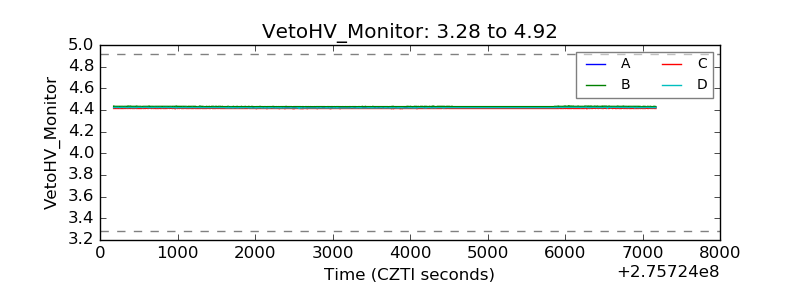 |
| Veto LLD | 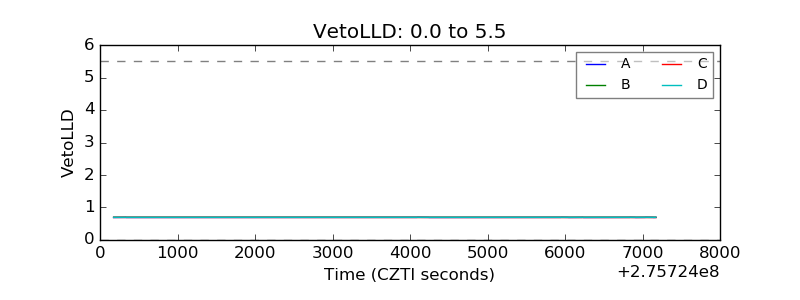 |
| Alpha Counter | 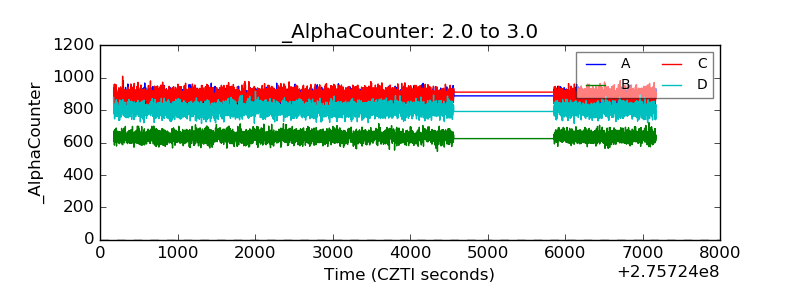 |
| _CPM_Rate | 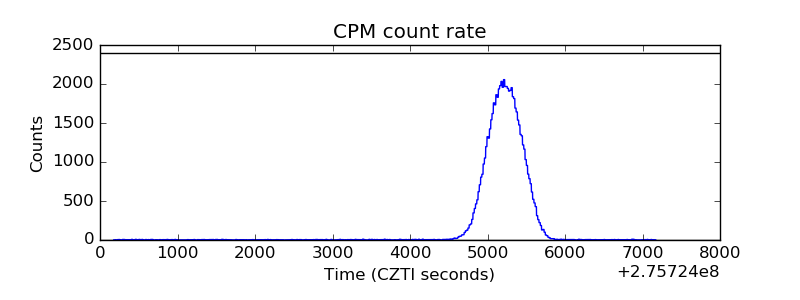 |
| CZT Counter |  |
| +2.5 Volts monitor |  |
| +5 Volts monitor |  |
| _ROLL_ROT | 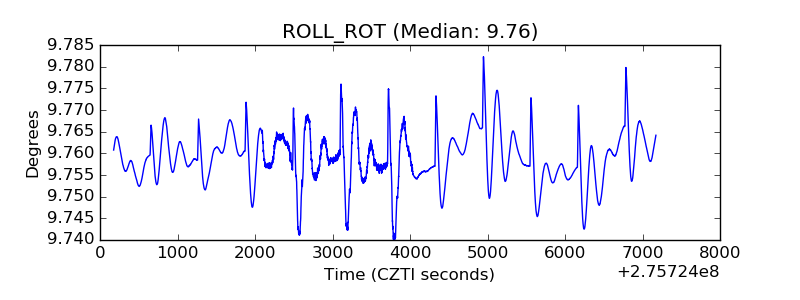 |
| _Roll_DEC | 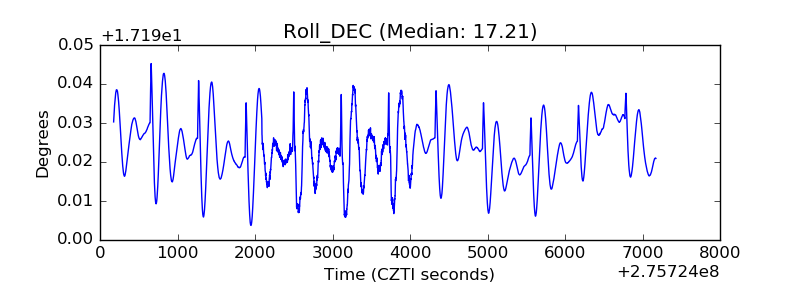 |
| _Roll_RA |  |
| Veto Counter | 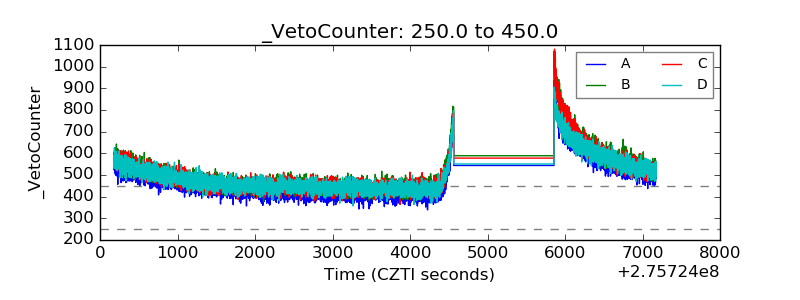 |