| Param | Original file | Final file |
|---|---|---|
| Filename | modeM0/AS1T02_109T01_9000002386_16211cztM0_level2.evt | modeM0/AS1T02_109T01_9000002386_16211cztM0_level2_quad_clean.evt |
| Size (bytes) | 433,370,880 | 73,918,080 |
| Size | 413.3 MB | 70.5 MB |
| Events in quadrant A | 3,110,280 | 467,577 |
| Events in quadrant B | 3,176,770 | 474,146 |
| Events in quadrant C | 3,046,879 | 449,901 |
| Events in quadrant D | 3,398,235 | 442,801 |
| Mode M0 | |||
|---|---|---|---|
| Quadrant | BADHDUFLAG | Total packets | Discarded packets |
| A | 0 | 12539 | 2 |
| B | 0 | 12644 | 1 |
| C | 0 | 12236 | 1 |
| D | 0 | 13699 | 1 |
| Mode SS | |||
|---|---|---|---|
| Quadrant | BADHDUFLAG | Total packets | Discarded packets |
| A | 0 | 116 | 0 |
| B | 0 | 116 | 0 |
| C | 0 | 116 | 0 |
| D | 0 | 116 | 0 |
| Mode M9 | |||
|---|---|---|---|
| Quadrant | BADHDUFLAG | Total packets | Discarded packets |
| A | 0 | 14 | 0 |
| B | 0 | 14 | 0 |
| C | 0 | 14 | 0 |
| D | 0 | 14 | 0 |
| Quadrant | Total seconds | Saturated seconds | Saturation percentage |
|---|---|---|---|
| A | 5783 | 82 | 1.417949% |
| B | 5783 | 93 | 1.608162% |
| C | 5783 | 84 | 1.452533% |
| D | 5783 | 87 | 1.504409% |
Noise dominated data is calculated using 1-second bins in cleaned event files. If a bin has >2000 counts, and if more than 50% of those come from <1% of pixels, then it is considered to be noise-dominated and hence unusable.
| Quadrant | # 1 sec bins | Bins with >0 counts | Bins with >2000 counts | High rate bins dominated by noise | Noise dominated (total time) | Noise dominated (detector-on time) | Marked lightcurve |
|---|---|---|---|---|---|---|---|
| A | 7094 | 5785 | 4 | 4 | 0.06% | 0.07% | 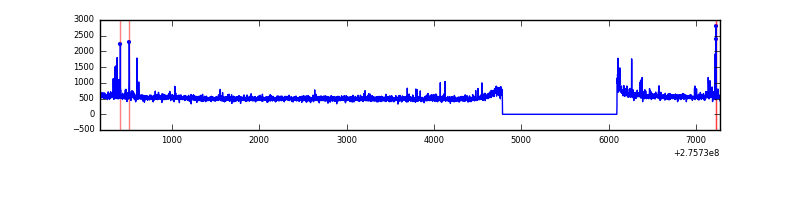 |
| B | 7094 | 5785 | 12 | 12 | 0.17% | 0.21% | 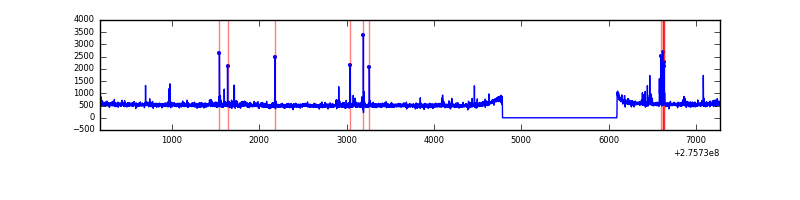 |
| C | 7094 | 5785 | 0 | 0 | 0.00% | 0.00% | 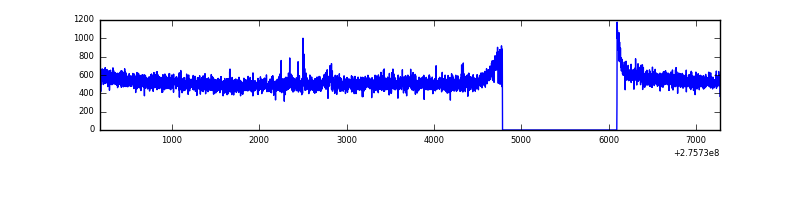 |
| D | 7094 | 5785 | 25 | 25 | 0.35% | 0.43% | 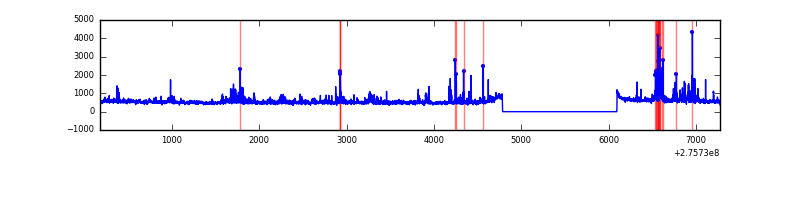 |
Top three noisy pixels from each quadrant. If the there are fewer than three noisy pixels in the level2.evt file, extra rows are filled as -1
| Pixel properties | Quadrant properties | ||||||
|---|---|---|---|---|---|---|---|
| Quadrant | DetID | PixID | Counts | Sigma | Mean | Median | Sigma |
| A | 4 | 2 | 79011 | 500.78 | 786 | 772 | 156.2 |
| A | 0 | 226 | 7181 | 41.02 | 786 | 772 | 156.2 |
| A | 12 | 194 | 5879 | 32.69 | 786 | 772 | 156.2 |
| B | 0 | 189 | 46535 | 314.55 | 774 | 758 | 145.5 |
| B | 4 | 173 | 43632 | 294.6 | 774 | 758 | 145.5 |
| B | 0 | 198 | 38467 | 259.11 | 774 | 758 | 145.5 |
| C | 14 | 238 | 115583 | 673.84 | 741 | 749 | 170.4 |
| C | 3 | 233 | 21601 | 122.36 | 741 | 749 | 170.4 |
| C | 7 | 247 | 12960 | 71.65 | 741 | 749 | 170.4 |
| D | 1 | 52 | 261054 | 1390.59 | 764 | 741 | 187.2 |
| D | 2 | 233 | 204650 | 1089.28 | 764 | 741 | 187.2 |
| D | 2 | 234 | 20205 | 103.98 | 764 | 741 | 187.2 |
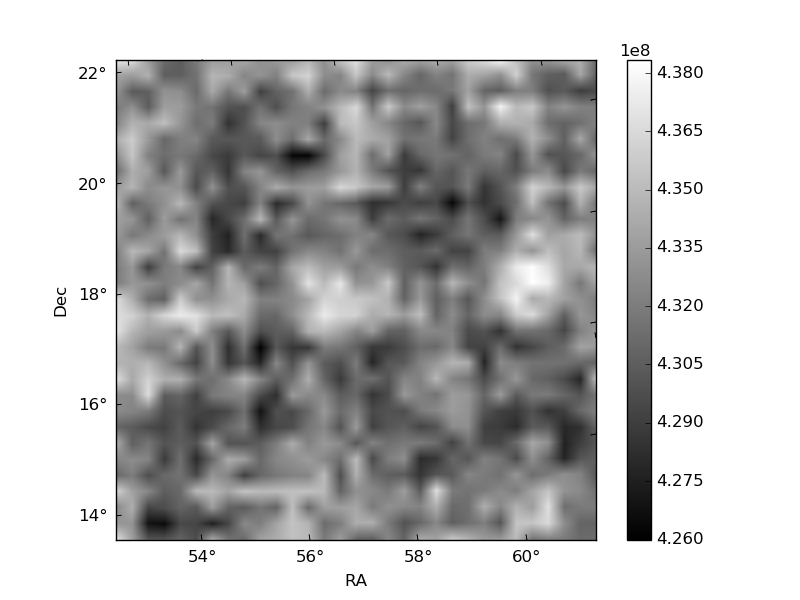
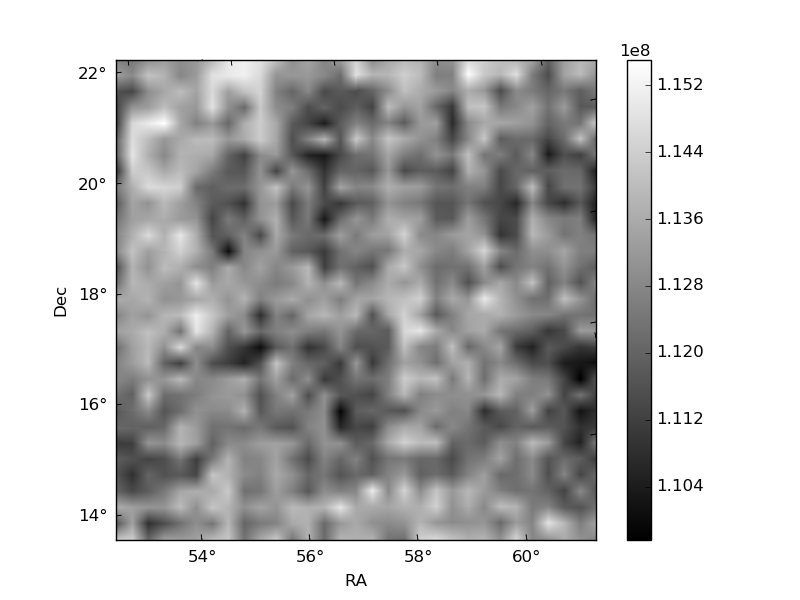
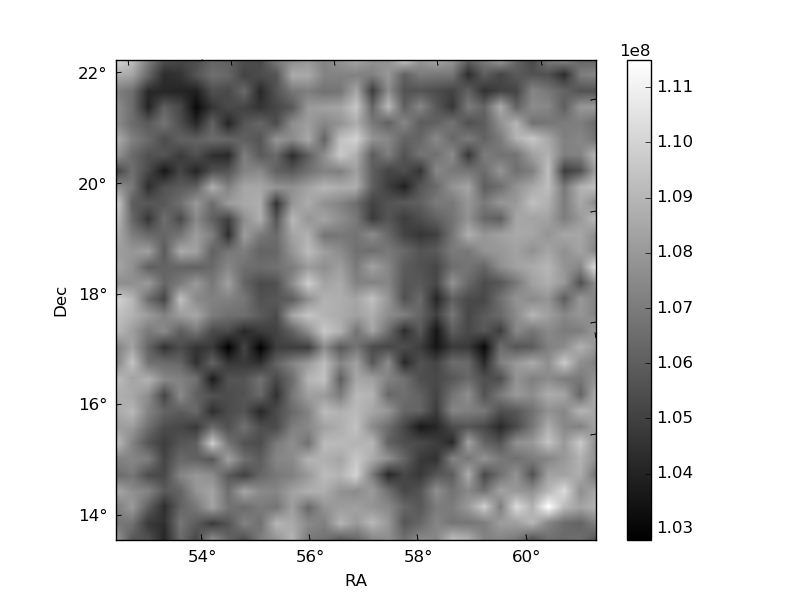
Histogram calculated using DETX and DETY for each event in the final _common_clean file
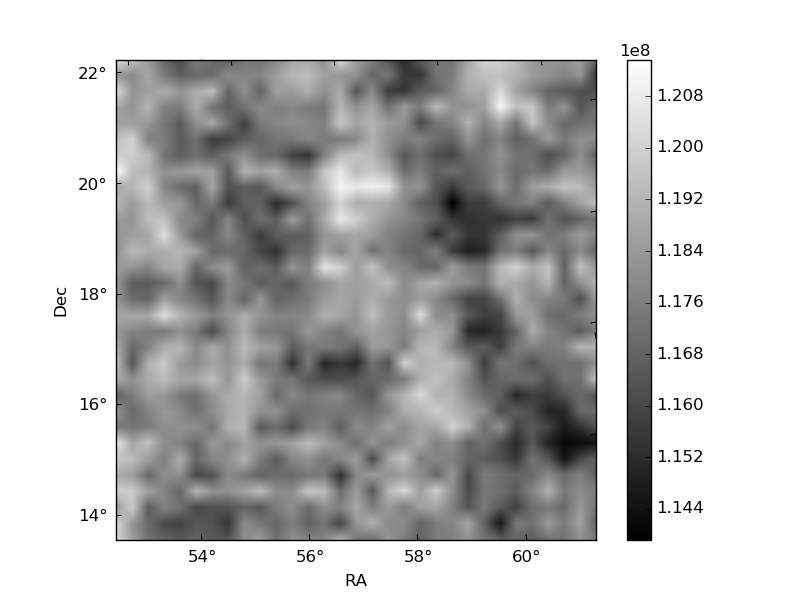
| Quadrant A | 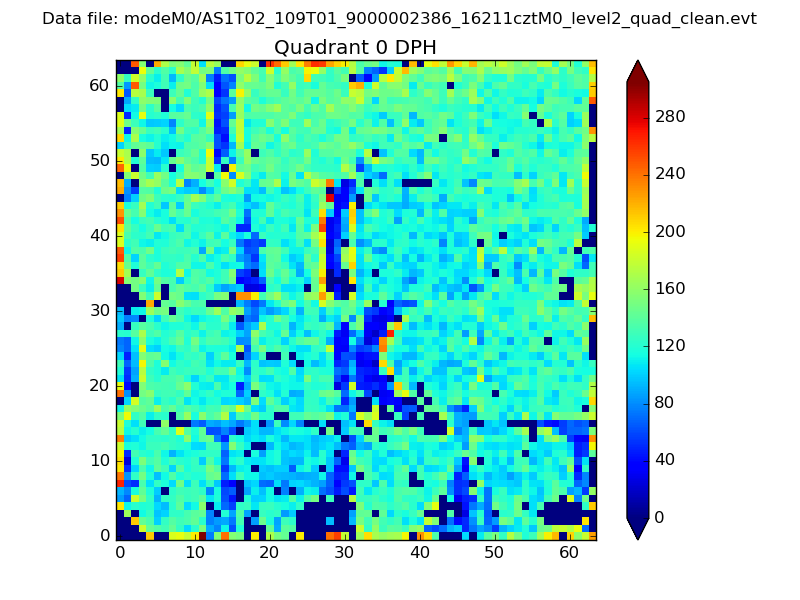 |
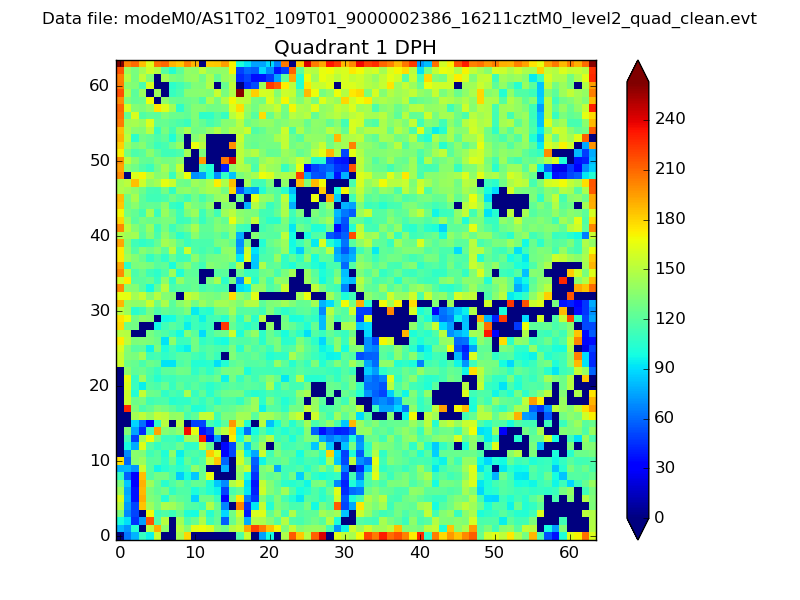 |
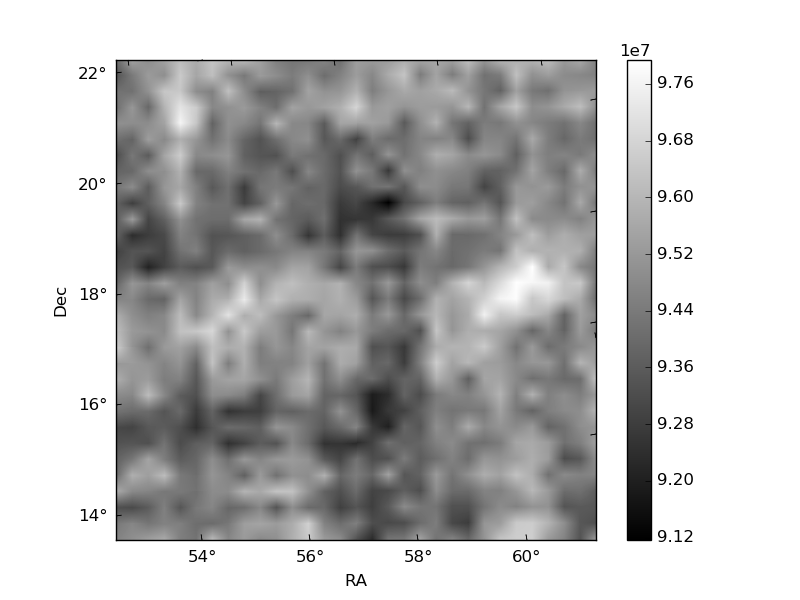
Quadrant B |
|---|---|---|---|
| Quadrant D | 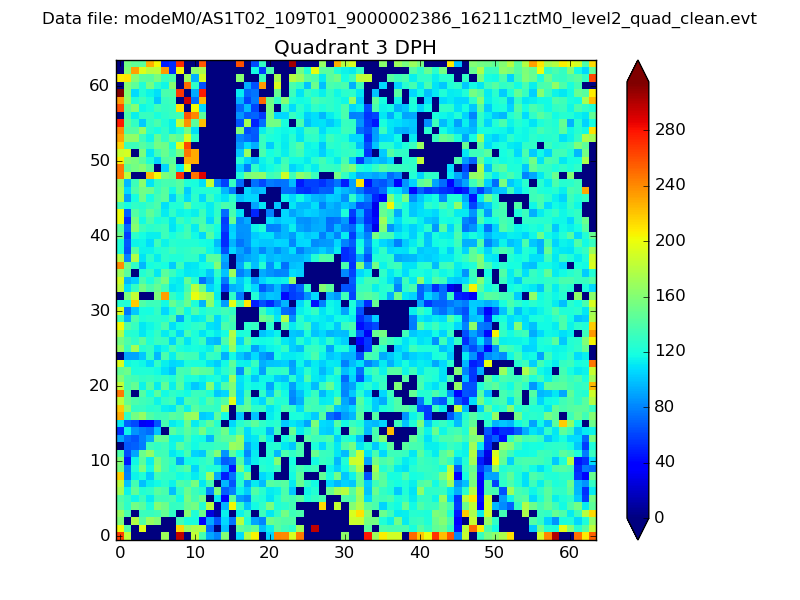 |
 |
Quadrant C |
| Plot type | Count rate plots | Images |
|---|---|---|
| Comparison with Poisson distribution Blue bars denote a histogram of data divided into 1 sec bins. Red curve is a Poisson curve with rate = median count rate of data. |
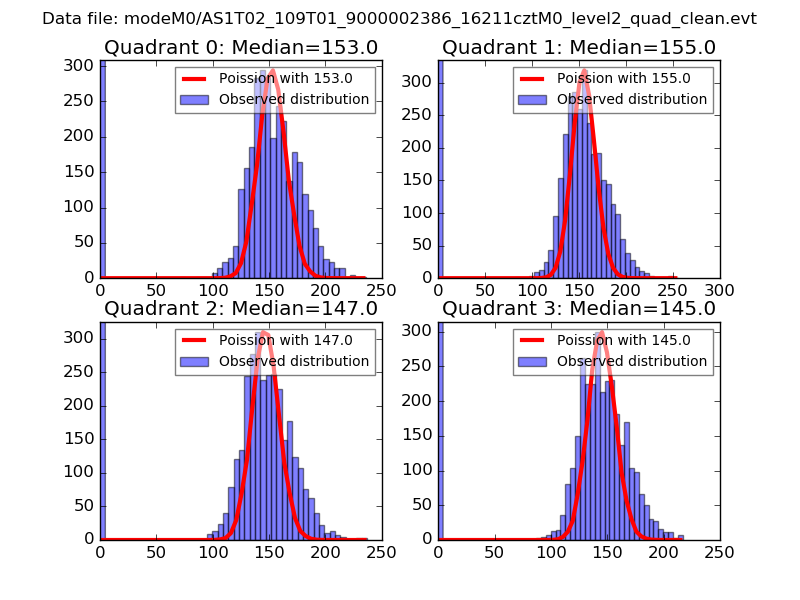 |
 |
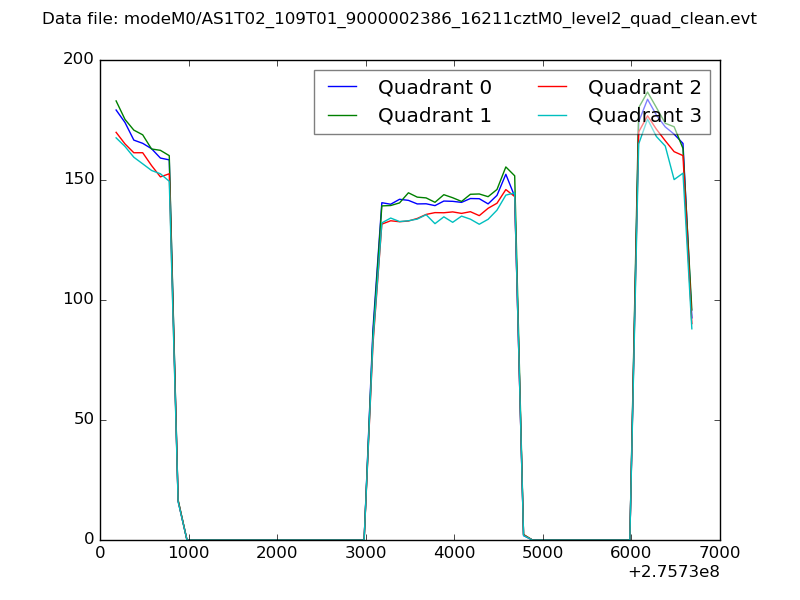
| Quadrant-wise count rates Data is divided into 100 sec bins |
 |
|
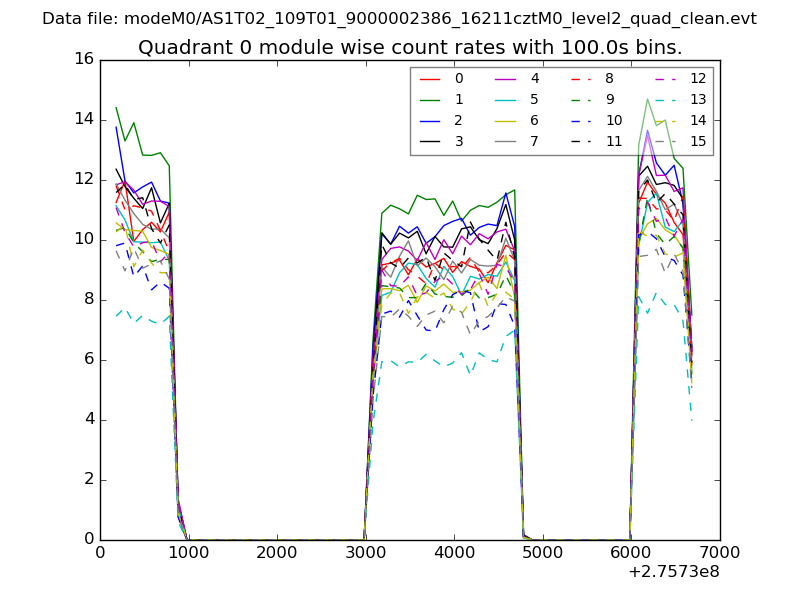
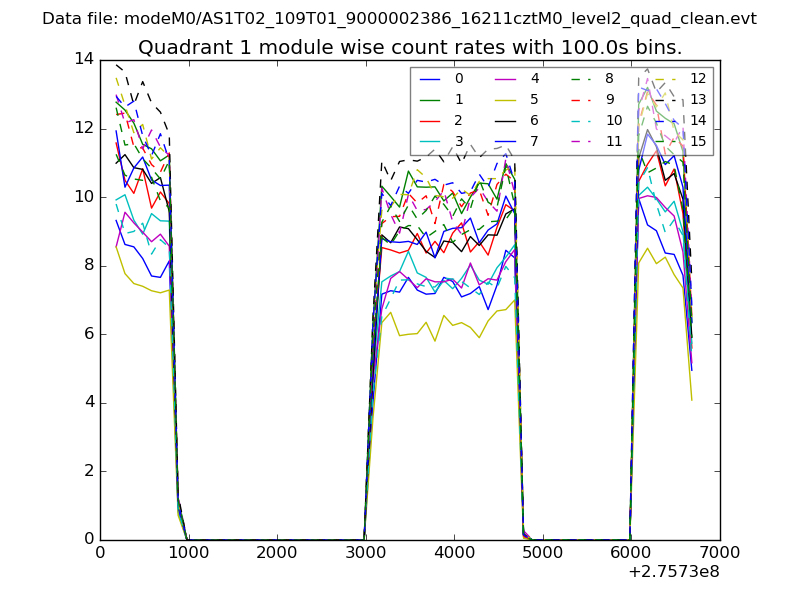
| Module-wise count rates for Quadrant A Data is divided into 100 sec bins |
 |
 |
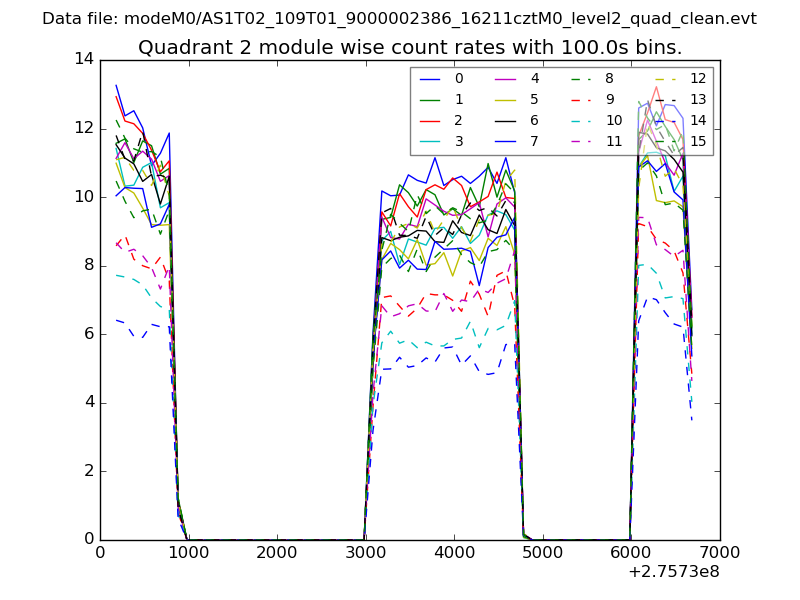
| Module-wise count rates for Quadrant B Data is divided into 100 sec bins |
 |
 |
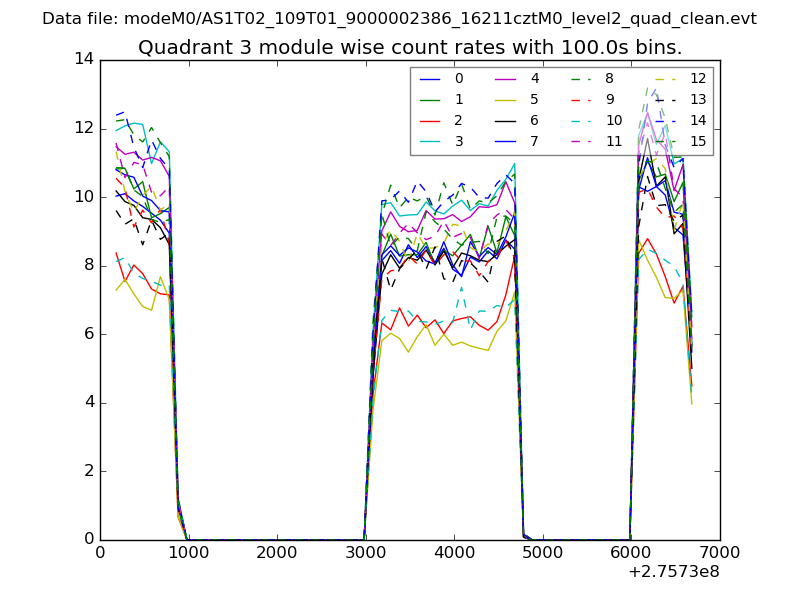
| Module-wise count rates for Quadrant C Data is divided into 100 sec bins |
 |
 |
| Module-wise count rates for Quadrant D Data is divided into 100 sec bins |
 |
 |
| Parameter | Plot |
|---|---|
| CZT HV Monitor | 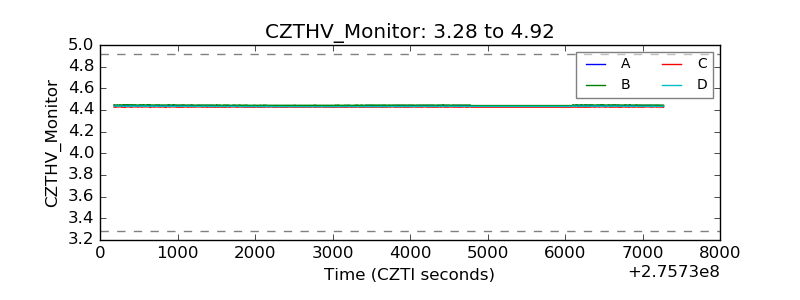 |
| D_VDD | 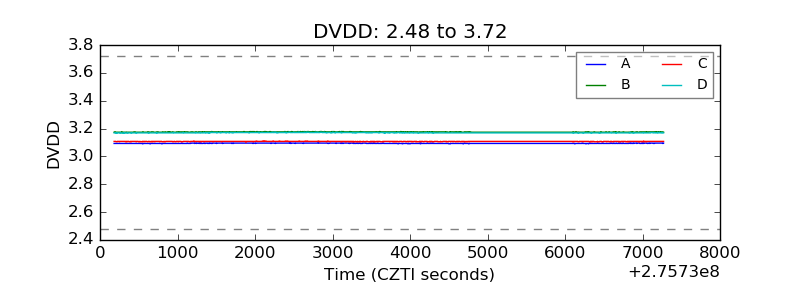 |
| Temperature 1 | 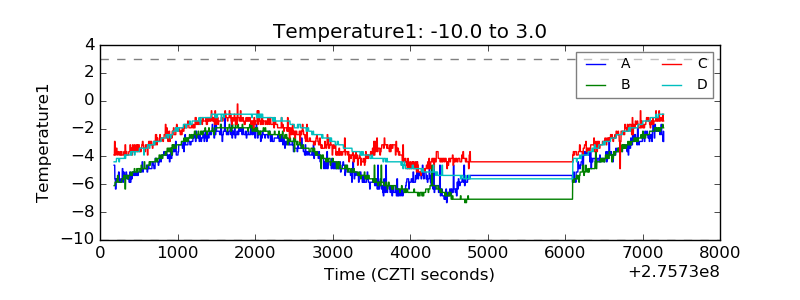 |
| Veto HV Monitor | 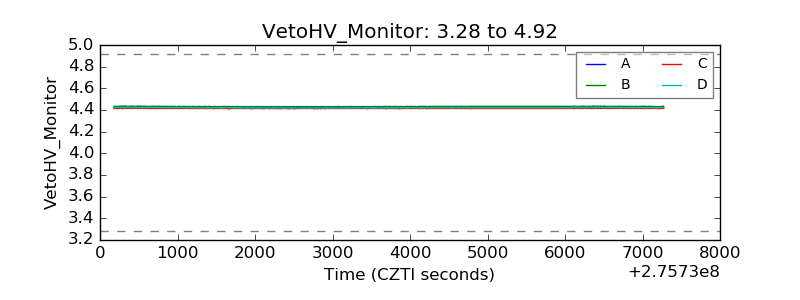 |
| Veto LLD | 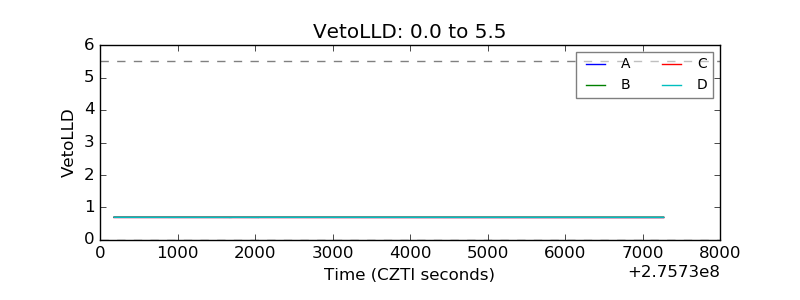 |
| Alpha Counter | 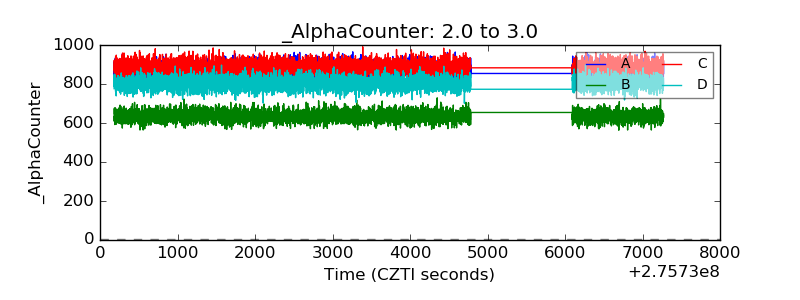 |
| _CPM_Rate | 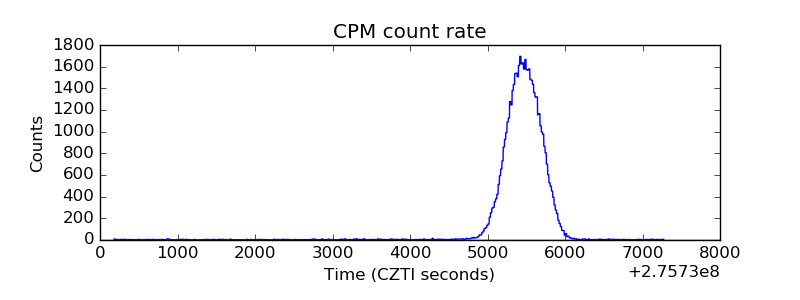 |
| CZT Counter | 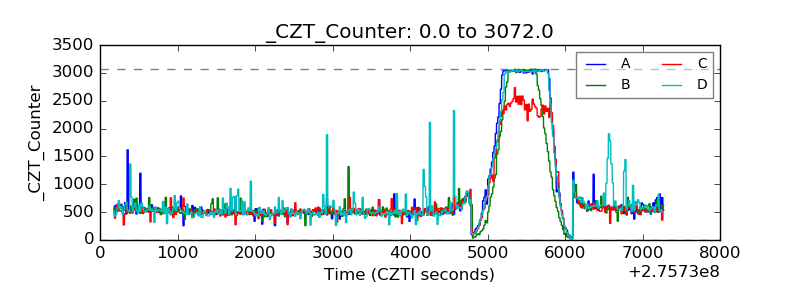 |
| +2.5 Volts monitor |  |
| +5 Volts monitor |  |
| _ROLL_ROT | 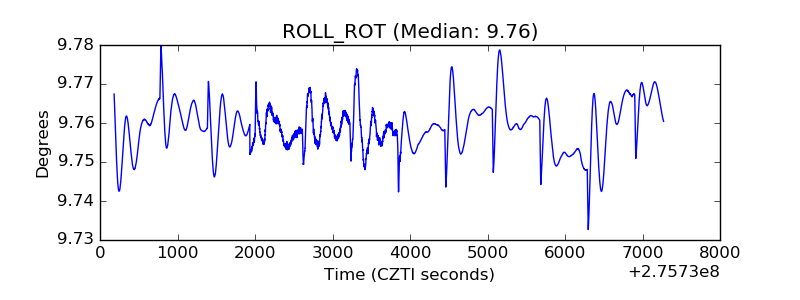 |
| _Roll_DEC |  |
| _Roll_RA | 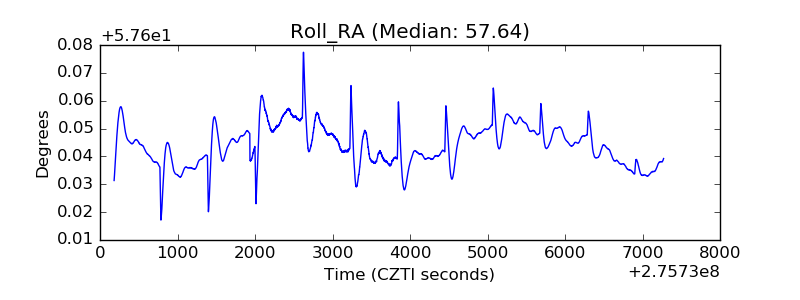 |
| Veto Counter | 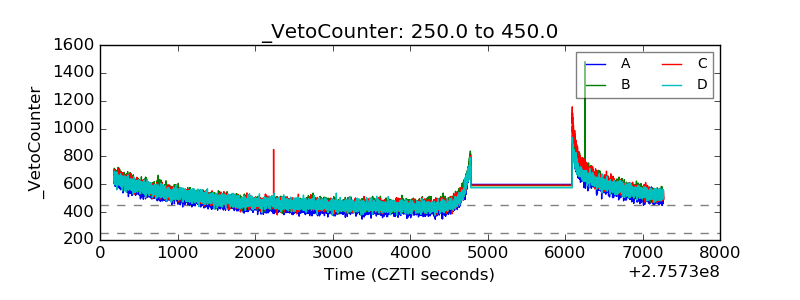 |