| Param | Original file | Final file |
|---|---|---|
| Filename | modeM0/AS1T02_109T01_9000002386_16213cztM0_level2.evt | modeM0/AS1T02_109T01_9000002386_16213cztM0_level2_quad_clean.evt |
| Size (bytes) | 551,280,960 | 68,135,040 |
| Size | 525.7 MB | 65.0 MB |
| Events in quadrant A | 5,043,070 | 399,035 |
| Events in quadrant B | 3,723,268 | 410,276 |
| Events in quadrant C | 3,686,202 | 394,315 |
| Events in quadrant D | 3,786,629 | 389,957 |
| Mode M0 | |||
|---|---|---|---|
| Quadrant | BADHDUFLAG | Total packets | Discarded packets |
| A | 0 | 19227 | 3 |
| B | 0 | 15064 | 2 |
| C | 0 | 14805 | 2 |
| D | 0 | 15567 | 2 |
| Mode SS | |||
|---|---|---|---|
| Quadrant | BADHDUFLAG | Total packets | Discarded packets |
| A | 0 | 136 | 0 |
| B | 0 | 136 | 0 |
| C | 0 | 136 | 0 |
| D | 0 | 136 | 0 |
| Mode M9 | |||
|---|---|---|---|
| Quadrant | BADHDUFLAG | Total packets | Discarded packets |
| A | 0 | 18 | 0 |
| B | 0 | 18 | 0 |
| C | 0 | 18 | 0 |
| D | 0 | 19 | 0 |
| Quadrant | Total seconds | Saturated seconds | Saturation percentage |
|---|---|---|---|
| A | 6733 | 687 | 10.203475% |
| B | 6733 | 112 | 1.663449% |
| C | 6733 | 166 | 2.465469% |
| D | 6733 | 111 | 1.648596% |
Noise dominated data is calculated using 1-second bins in cleaned event files. If a bin has >2000 counts, and if more than 50% of those come from <1% of pixels, then it is considered to be noise-dominated and hence unusable.
| Quadrant | # 1 sec bins | Bins with >0 counts | Bins with >2000 counts | High rate bins dominated by noise | Noise dominated (total time) | Noise dominated (detector-on time) | Marked lightcurve |
|---|---|---|---|---|---|---|---|
| A | 7799 | 6735 | 435 | 435 | 5.58% | 6.46% | 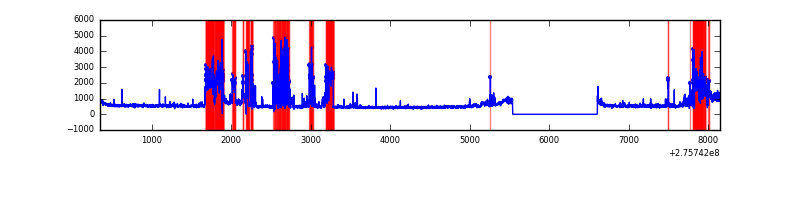 |
| B | 7799 | 6735 | 2 | 2 | 0.03% | 0.03% |  |
| C | 7799 | 6735 | 22 | 22 | 0.28% | 0.33% | 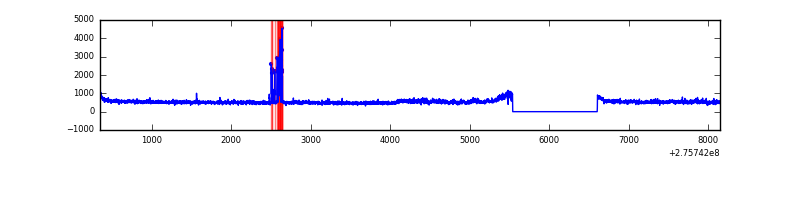 |
| D | 7799 | 6735 | 30 | 30 | 0.38% | 0.45% | 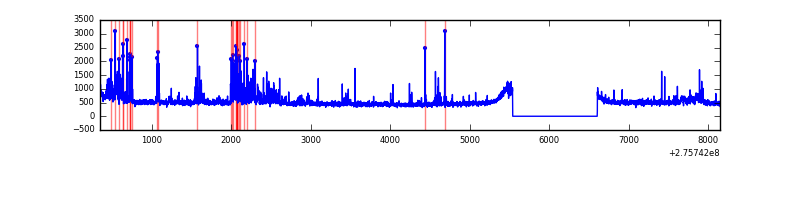 |
Top three noisy pixels from each quadrant. If the there are fewer than three noisy pixels in the level2.evt file, extra rows are filled as -1
| Pixel properties | Quadrant properties | ||||||
|---|---|---|---|---|---|---|---|
| Quadrant | DetID | PixID | Counts | Sigma | Mean | Median | Sigma |
| A | 15 | 174 | 1620907 | 9436.56 | 853 | 836 | 171.7 |
| A | 4 | 2 | 90440 | 521.92 | 853 | 836 | 171.7 |
| A | 0 | 253 | 23144 | 129.94 | 853 | 836 | 171.7 |
| B | 3 | 64 | 135810 | 814.54 | 870 | 848 | 165.7 |
| B | 0 | 198 | 83227 | 497.19 | 870 | 848 | 165.7 |
| B | 0 | 189 | 29728 | 174.3 | 870 | 848 | 165.7 |
| C | 7 | 247 | 154305 | 794.5 | 835 | 841 | 193.2 |
| C | 14 | 238 | 129954 | 668.43 | 835 | 841 | 193.2 |
| C | 0 | 207 | 116004 | 596.21 | 835 | 841 | 193.2 |
| D | 1 | 52 | 336213 | 1597.6 | 857 | 833 | 209.9 |
| D | 2 | 233 | 108764 | 514.13 | 857 | 833 | 209.9 |
| D | 15 | 0 | 54199 | 254.21 | 857 | 833 | 209.9 |
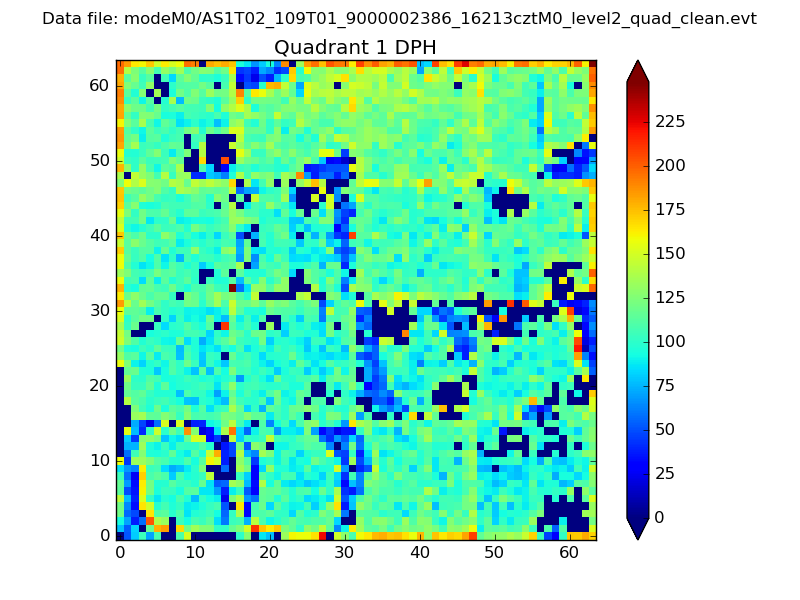
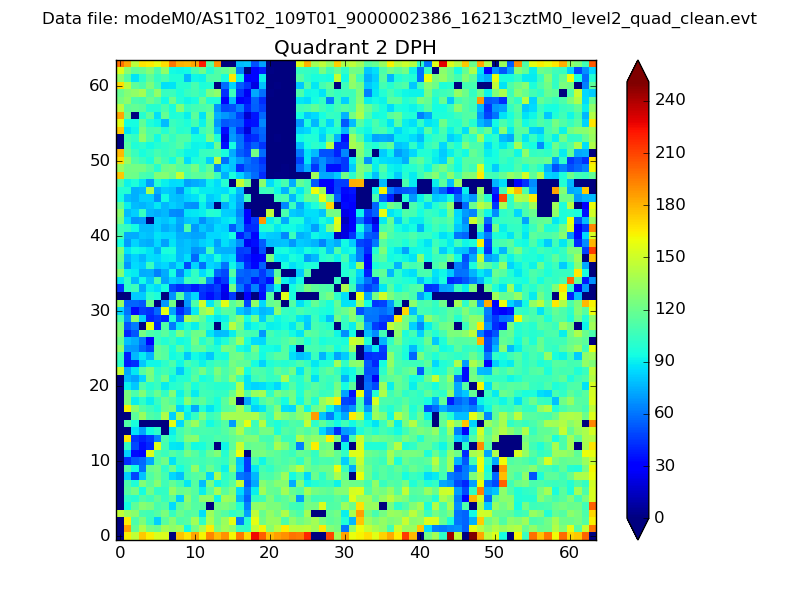
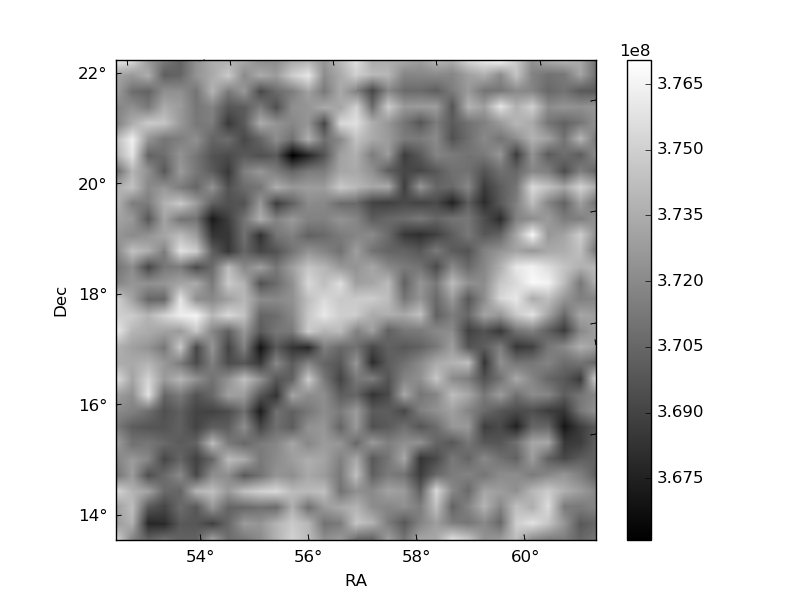
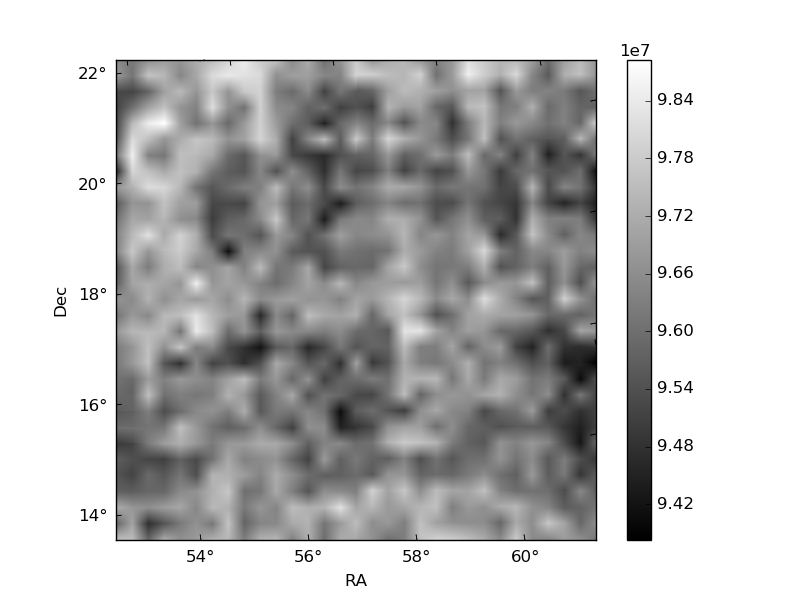
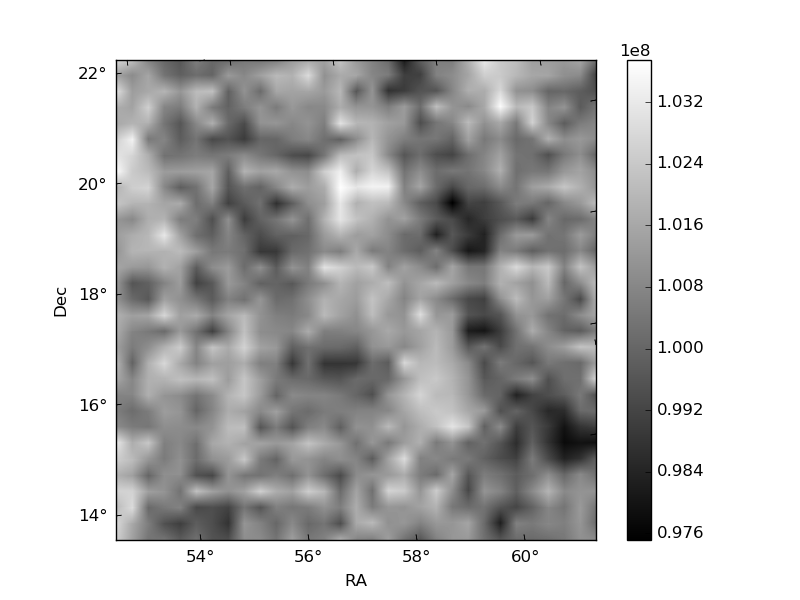
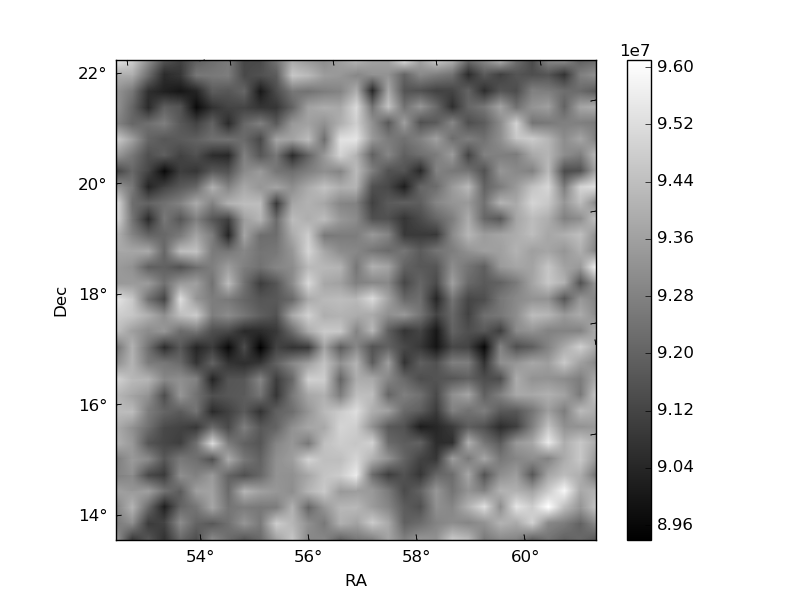
Histogram calculated using DETX and DETY for each event in the final _common_clean file
| Quadrant A | 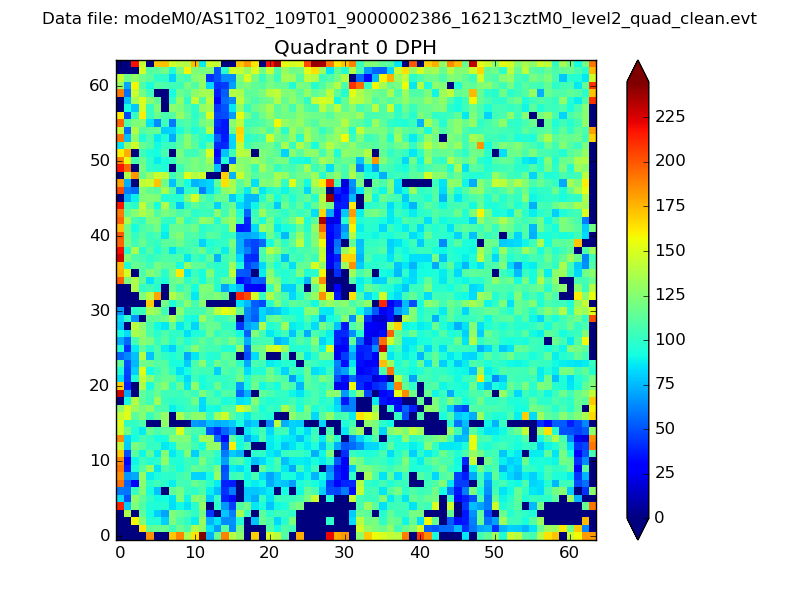 |
 |
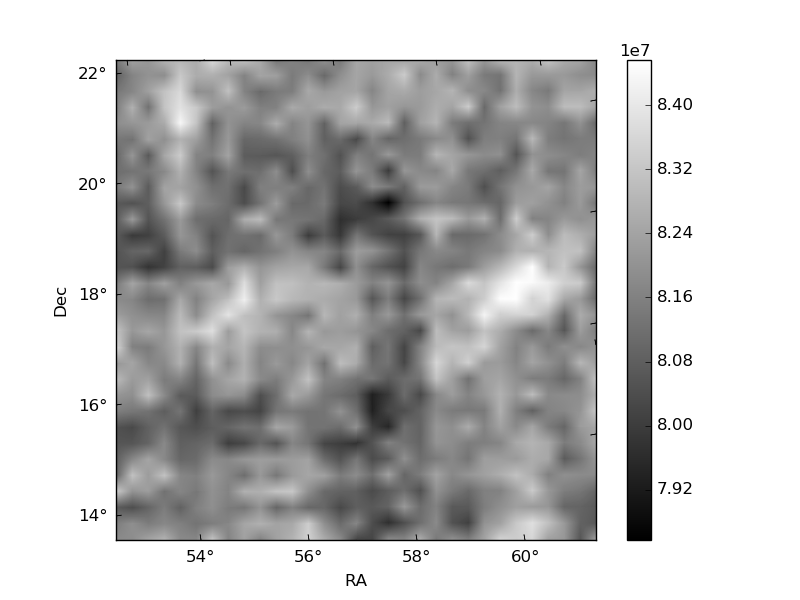
Quadrant B |
|---|---|---|---|
| Quadrant D | 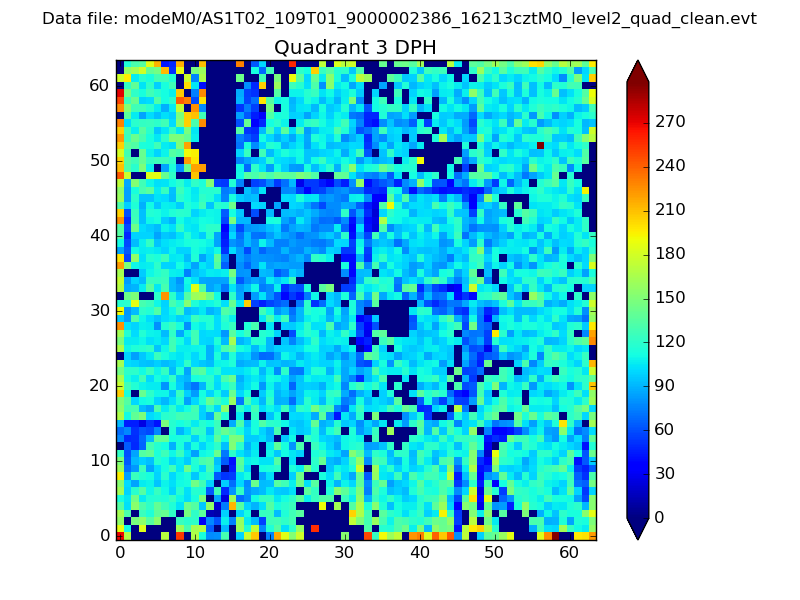 |
 |
Quadrant C |
| Plot type | Count rate plots | Images |
|---|---|---|
| Comparison with Poisson distribution Blue bars denote a histogram of data divided into 1 sec bins. Red curve is a Poisson curve with rate = median count rate of data. |
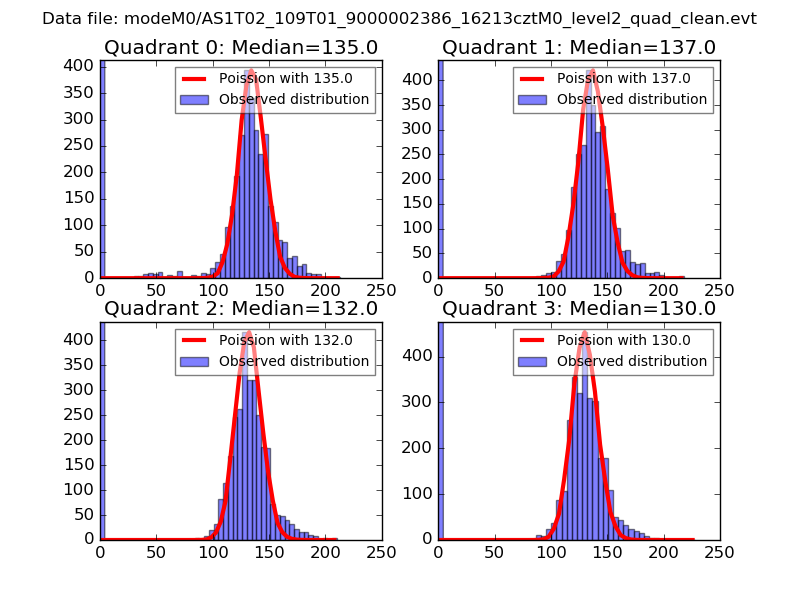 |
 |
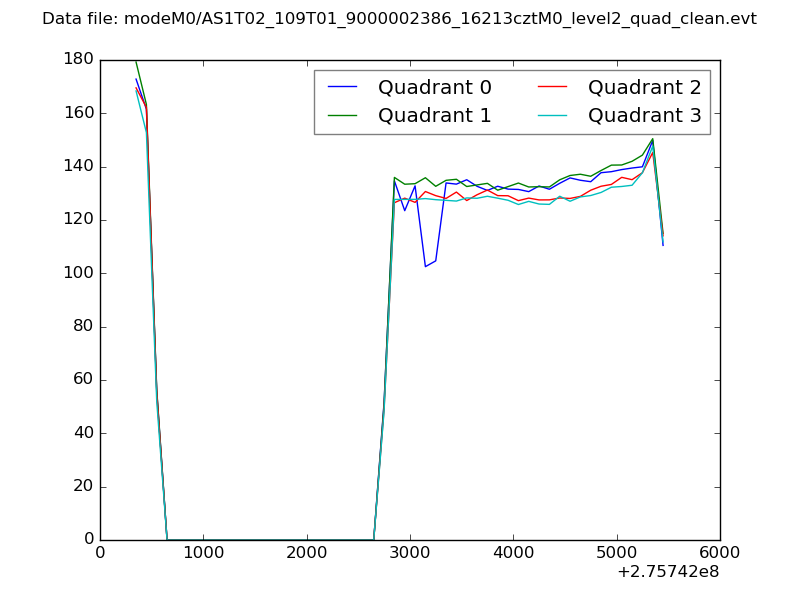
| Quadrant-wise count rates Data is divided into 100 sec bins |
 |
|
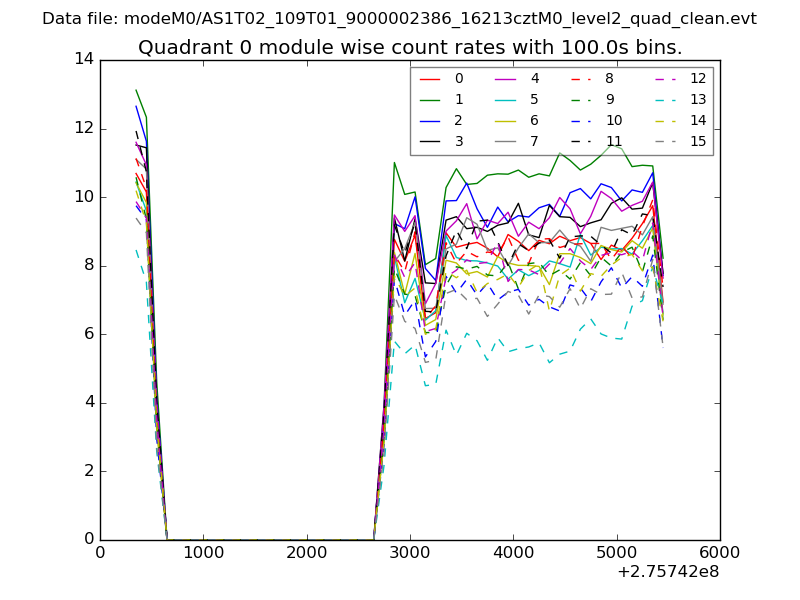
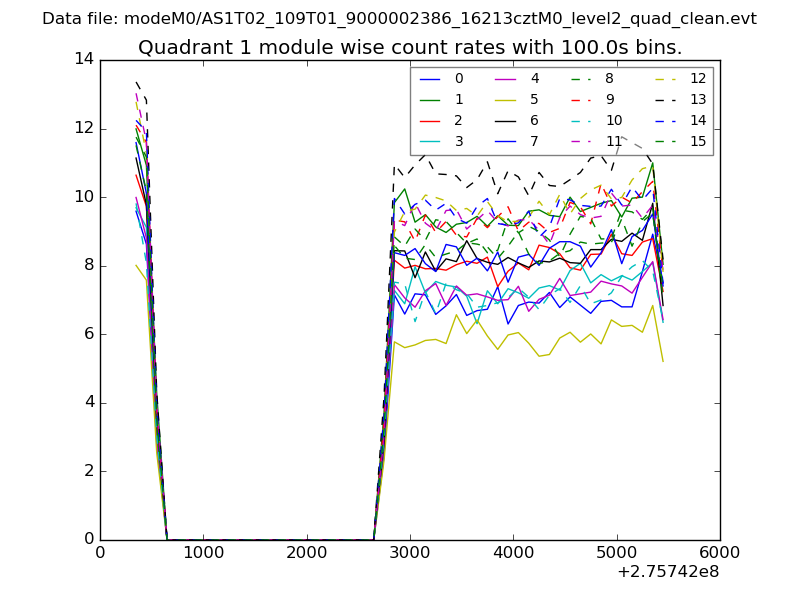
| Module-wise count rates for Quadrant A Data is divided into 100 sec bins |
 |
 |
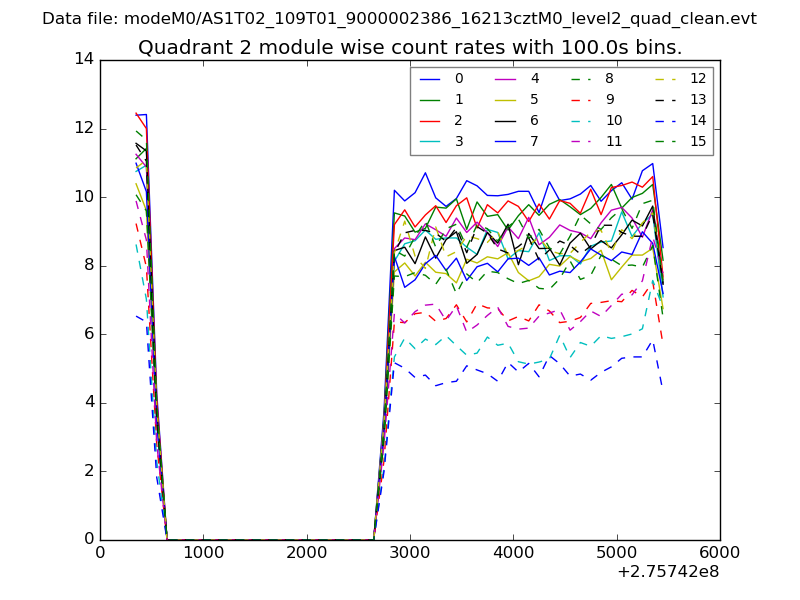
| Module-wise count rates for Quadrant B Data is divided into 100 sec bins |
 |
 |
| Module-wise count rates for Quadrant C Data is divided into 100 sec bins |
 |
 |
| Module-wise count rates for Quadrant D Data is divided into 100 sec bins |
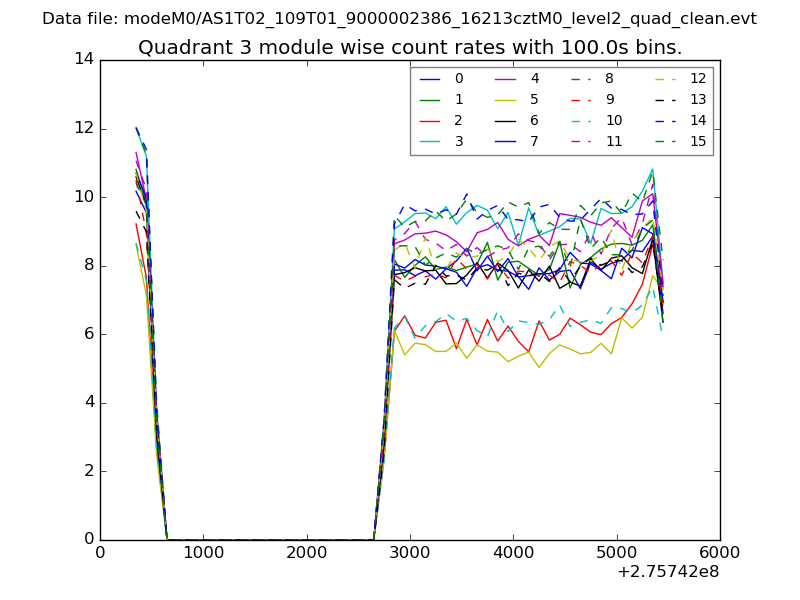 |
 |
| Parameter | Plot |
|---|---|
| CZT HV Monitor | 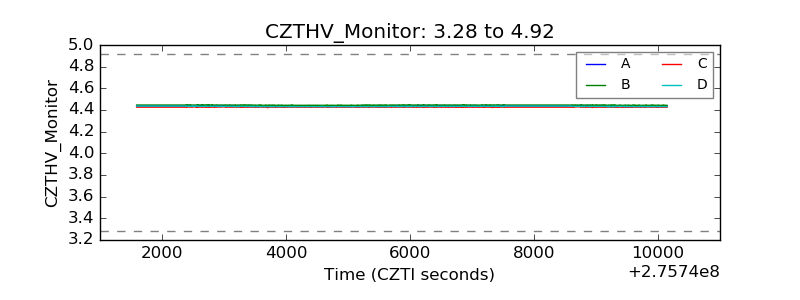 |
| D_VDD | 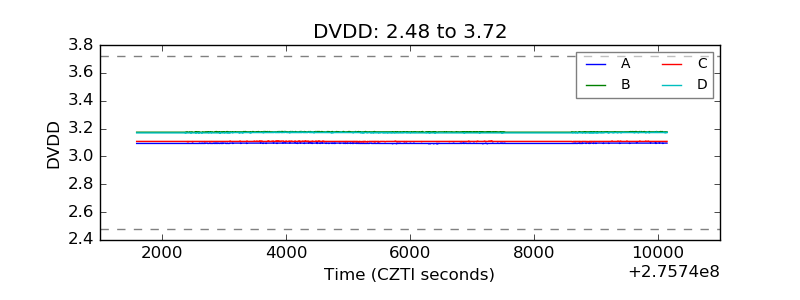 |
| Temperature 1 | 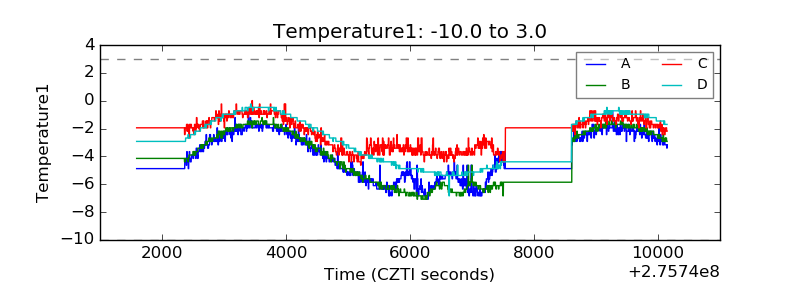 |
| Veto HV Monitor |  |
| Veto LLD | 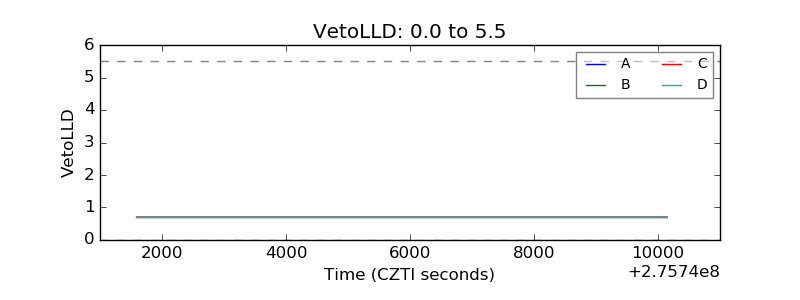 |
| Alpha Counter | 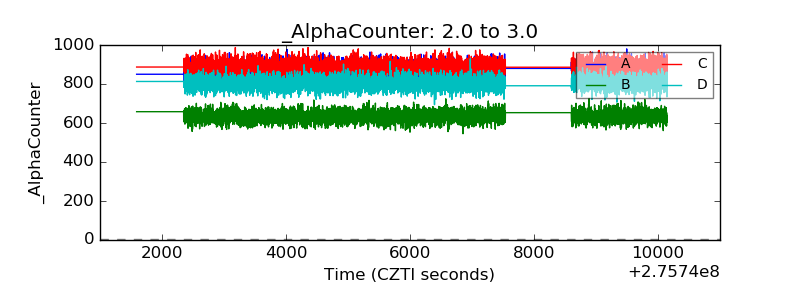 |
| _CPM_Rate | 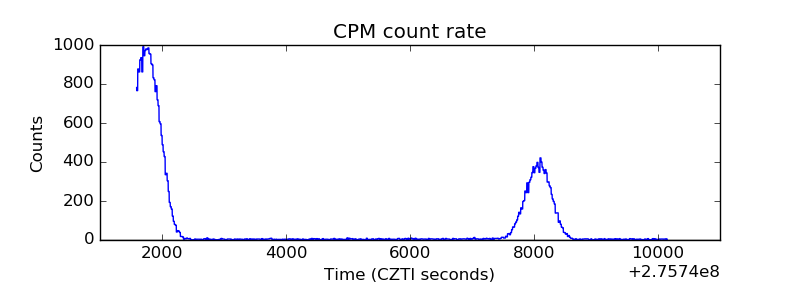 |
| CZT Counter | 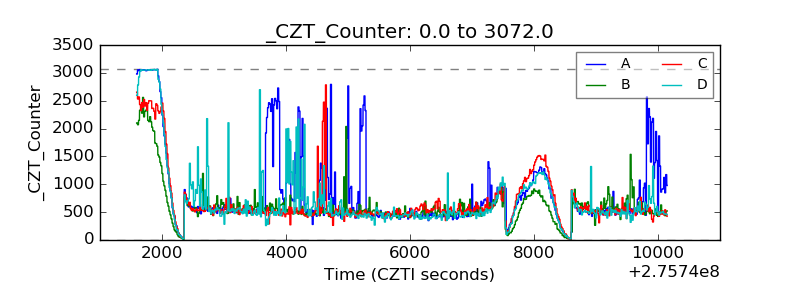 |
| +2.5 Volts monitor |  |
| +5 Volts monitor |  |
| _ROLL_ROT | 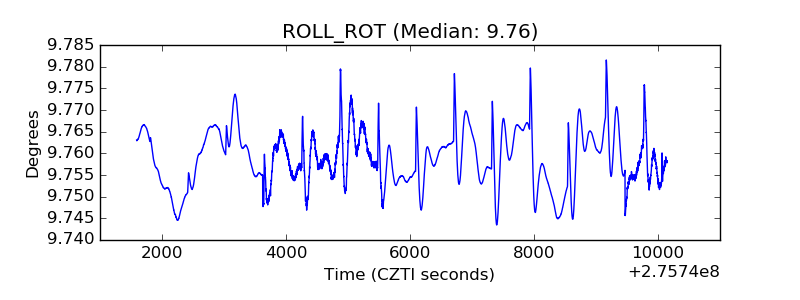 |
| _Roll_DEC | 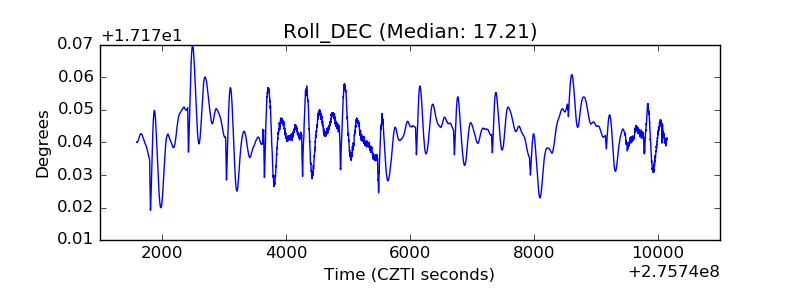 |
| _Roll_RA | 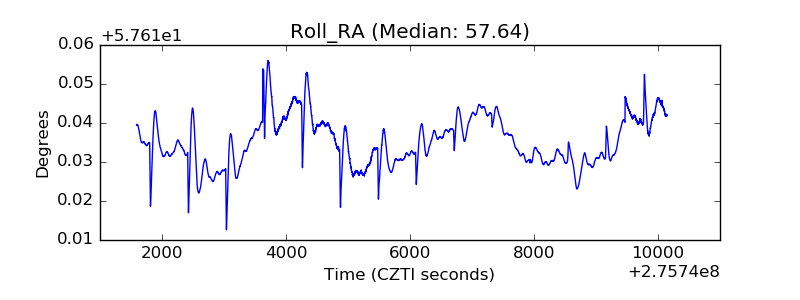 |
| Veto Counter | 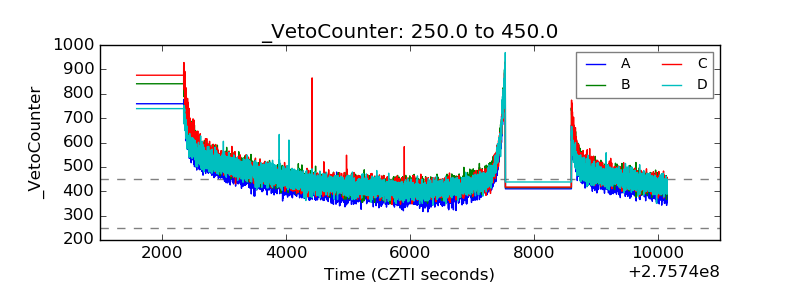 |