| Param | Original file | Final file |
|---|---|---|
| Filename | modeM0/AS1T02_109T01_9000002386_16214cztM0_level2.evt | modeM0/AS1T02_109T01_9000002386_16214cztM0_level2_quad_clean.evt |
| Size (bytes) | 555,160,320 | 73,022,400 |
| Size | 529.4 MB | 69.6 MB |
| Events in quadrant A | 5,568,025 | 421,292 |
| Events in quadrant B | 3,637,797 | 448,282 |
| Events in quadrant C | 3,575,028 | 431,415 |
| Events in quadrant D | 3,561,461 | 426,582 |
| Mode M0 | |||
|---|---|---|---|
| Quadrant | BADHDUFLAG | Total packets | Discarded packets |
| A | 0 | 21046 | 3 |
| B | 0 | 15200 | 2 |
| C | 0 | 14744 | 2 |
| D | 0 | 15109 | 2 |
| Mode SS | |||
|---|---|---|---|
| Quadrant | BADHDUFLAG | Total packets | Discarded packets |
| A | 0 | 138 | 0 |
| B | 0 | 138 | 0 |
| C | 0 | 138 | 0 |
| D | 0 | 138 | 0 |
| Mode M9 | |||
|---|---|---|---|
| Quadrant | BADHDUFLAG | Total packets | Discarded packets |
| A | 0 | 14 | 0 |
| B | 0 | 14 | 0 |
| C | 0 | 14 | 0 |
| D | 0 | 15 | 0 |
| Quadrant | Total seconds | Saturated seconds | Saturation percentage |
|---|---|---|---|
| A | 6946 | 964 | 13.878491% |
| B | 6946 | 96 | 1.382090% |
| C | 6946 | 157 | 2.260294% |
| D | 6946 | 83 | 1.194932% |
Noise dominated data is calculated using 1-second bins in cleaned event files. If a bin has >2000 counts, and if more than 50% of those come from <1% of pixels, then it is considered to be noise-dominated and hence unusable.
| Quadrant | # 1 sec bins | Bins with >0 counts | Bins with >2000 counts | High rate bins dominated by noise | Noise dominated (total time) | Noise dominated (detector-on time) | Marked lightcurve |
|---|---|---|---|---|---|---|---|
| A | 7652 | 6948 | 717 | 717 | 9.37% | 10.32% |  |
| B | 7652 | 6948 | 2 | 2 | 0.03% | 0.03% | 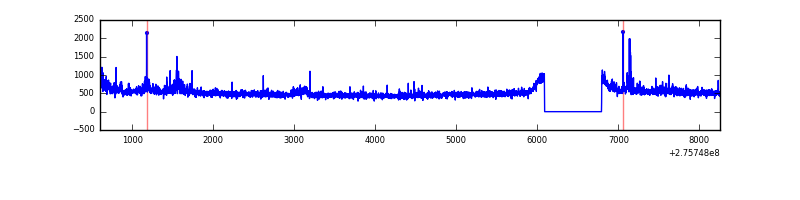 |
| C | 7652 | 6948 | 2 | 2 | 0.03% | 0.03% | 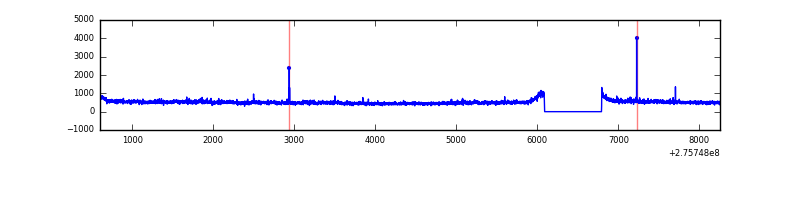 |
| D | 7652 | 6948 | 11 | 11 | 0.14% | 0.16% | 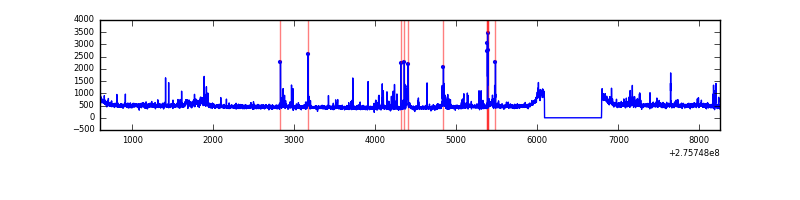 |
Top three noisy pixels from each quadrant. If the there are fewer than three noisy pixels in the level2.evt file, extra rows are filled as -1
| Pixel properties | Quadrant properties | ||||||
|---|---|---|---|---|---|---|---|
| Quadrant | DetID | PixID | Counts | Sigma | Mean | Median | Sigma |
| A | 15 | 174 | 2022417 | 11825.92 | 845 | 826 | 170.9 |
| A | 4 | 2 | 248410 | 1448.32 | 845 | 826 | 170.9 |
| A | 9 | 143 | 30694 | 174.72 | 845 | 826 | 170.9 |
| B | 3 | 64 | 109513 | 650.07 | 871 | 847 | 167.2 |
| B | 0 | 198 | 44053 | 258.47 | 871 | 847 | 167.2 |
| B | 3 | 209 | 19598 | 112.17 | 871 | 847 | 167.2 |
| C | 14 | 238 | 129434 | 659.06 | 834 | 841 | 195.1 |
| C | 7 | 247 | 84918 | 430.91 | 834 | 841 | 195.1 |
| C | 3 | 233 | 84563 | 429.09 | 834 | 841 | 195.1 |
| D | 2 | 233 | 146300 | 691.27 | 855 | 829 | 210.4 |
| D | 1 | 52 | 53752 | 251.49 | 855 | 829 | 210.4 |
| D | 15 | 0 | 48851 | 228.2 | 855 | 829 | 210.4 |
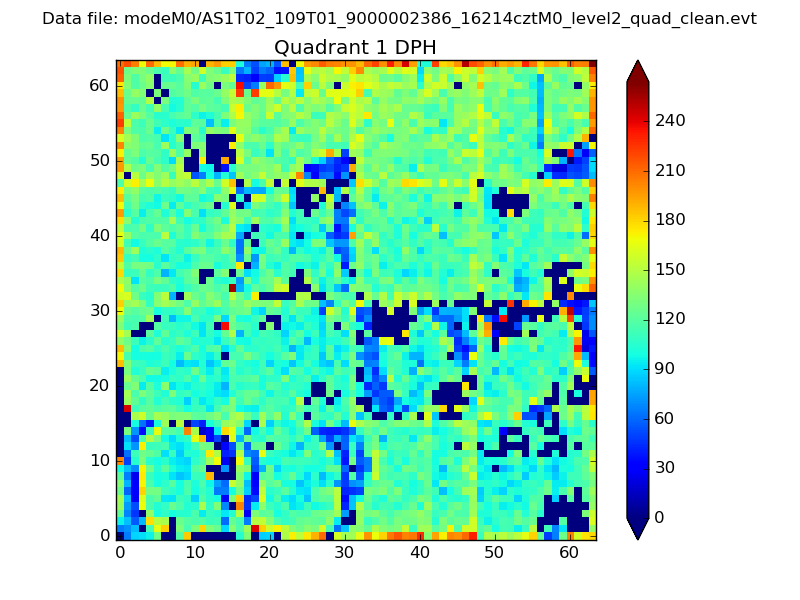
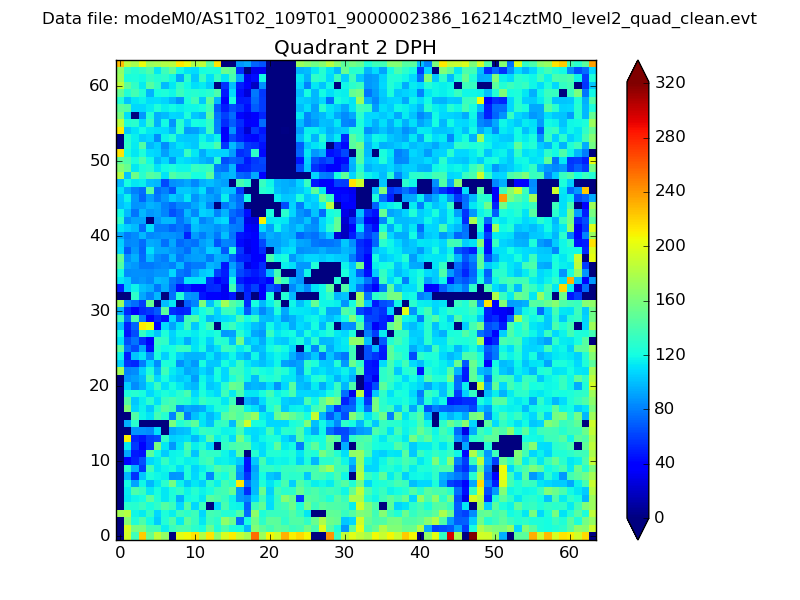
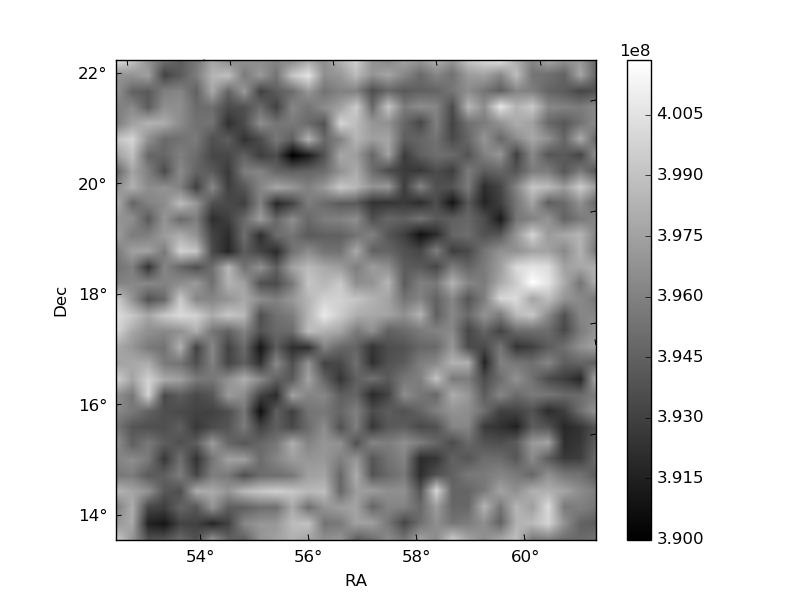
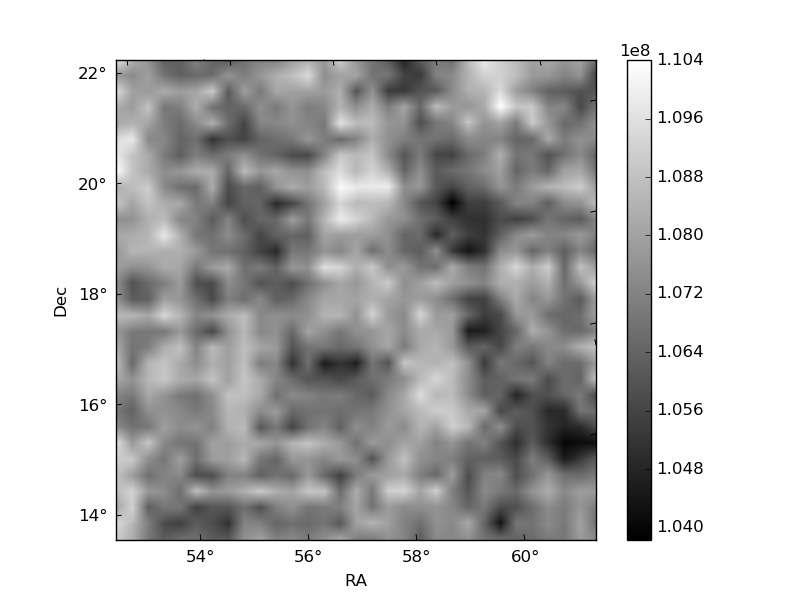
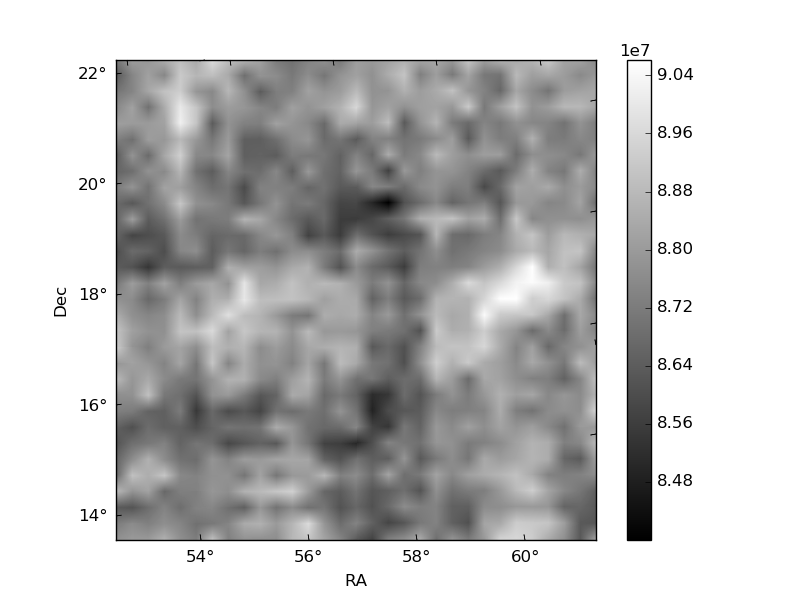
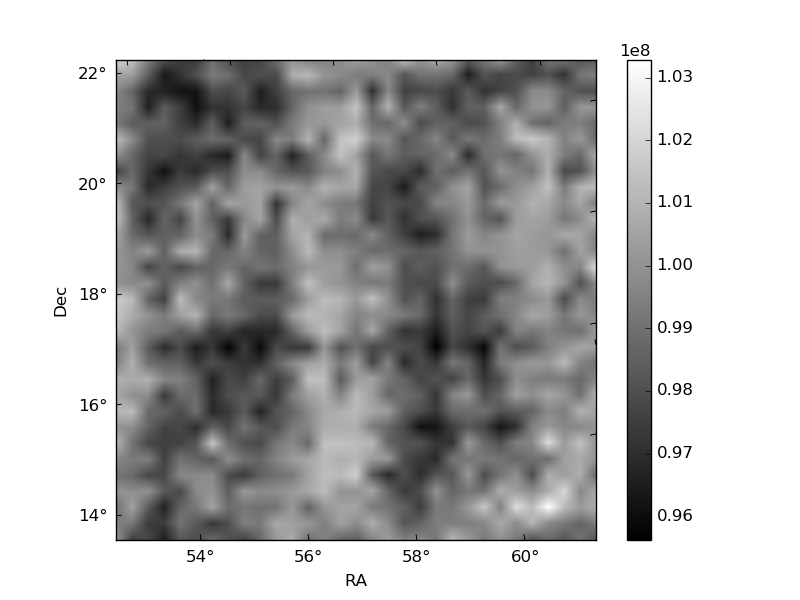
Histogram calculated using DETX and DETY for each event in the final _common_clean file
| Quadrant A | 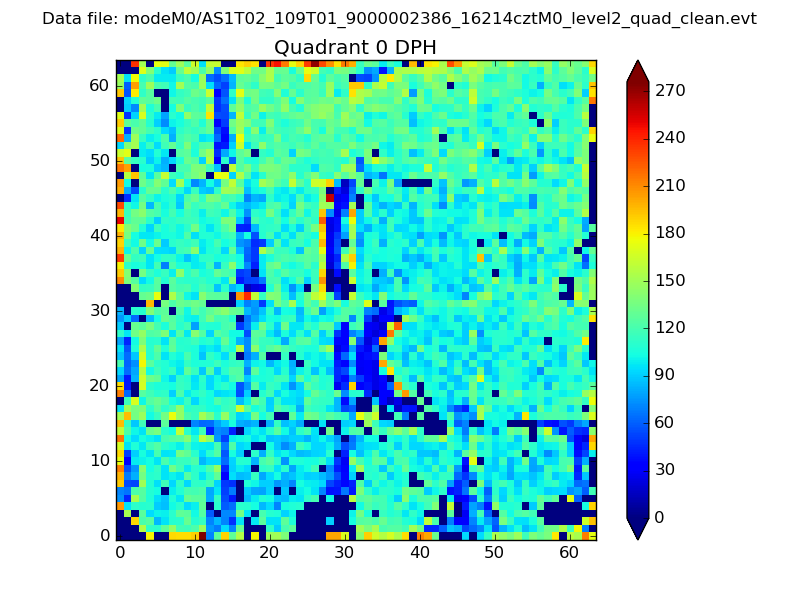 |
 |
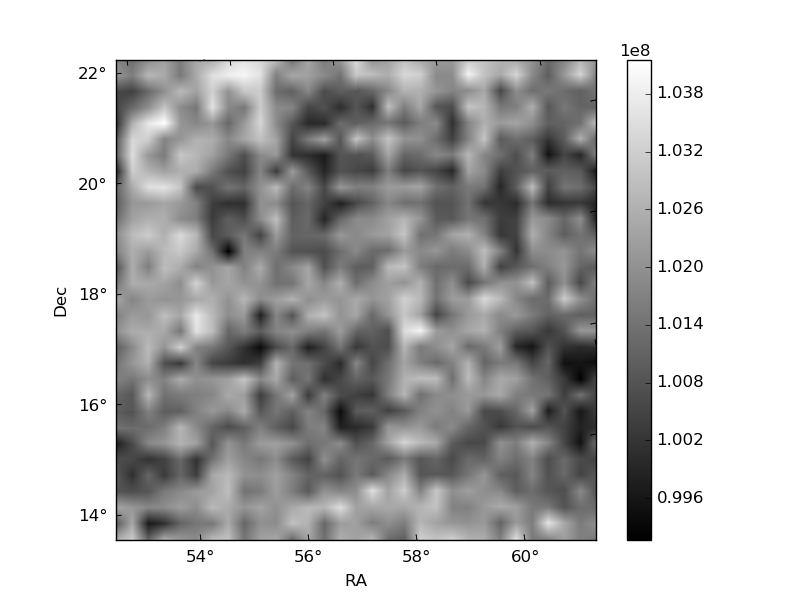
Quadrant B |
|---|---|---|---|
| Quadrant D | 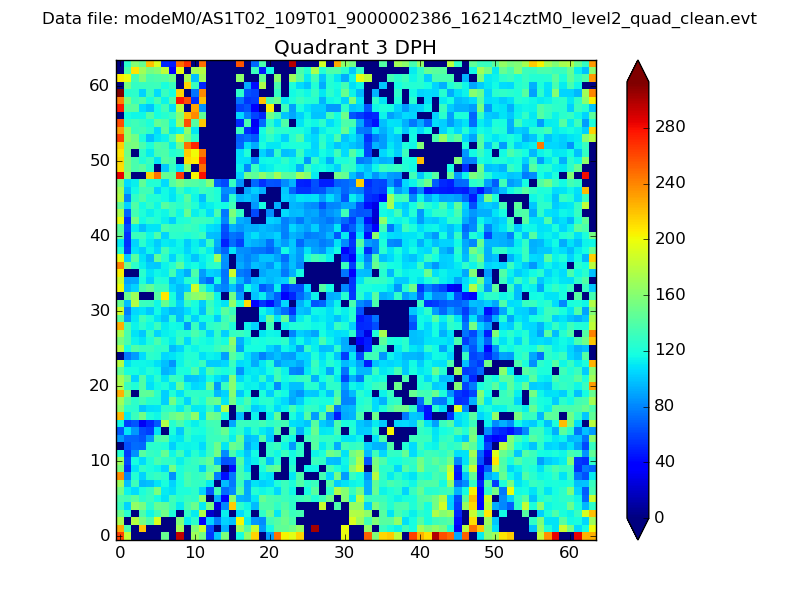 |
 |
Quadrant C |
| Plot type | Count rate plots | Images |
|---|---|---|
| Comparison with Poisson distribution Blue bars denote a histogram of data divided into 1 sec bins. Red curve is a Poisson curve with rate = median count rate of data. |
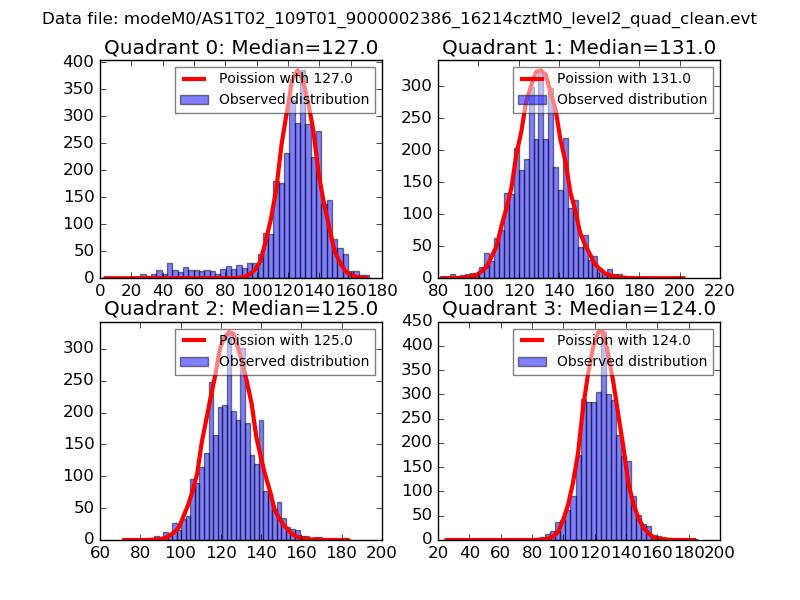 |
 |
| Quadrant-wise count rates Data is divided into 100 sec bins |
 |
|
| Module-wise count rates for Quadrant A Data is divided into 100 sec bins |
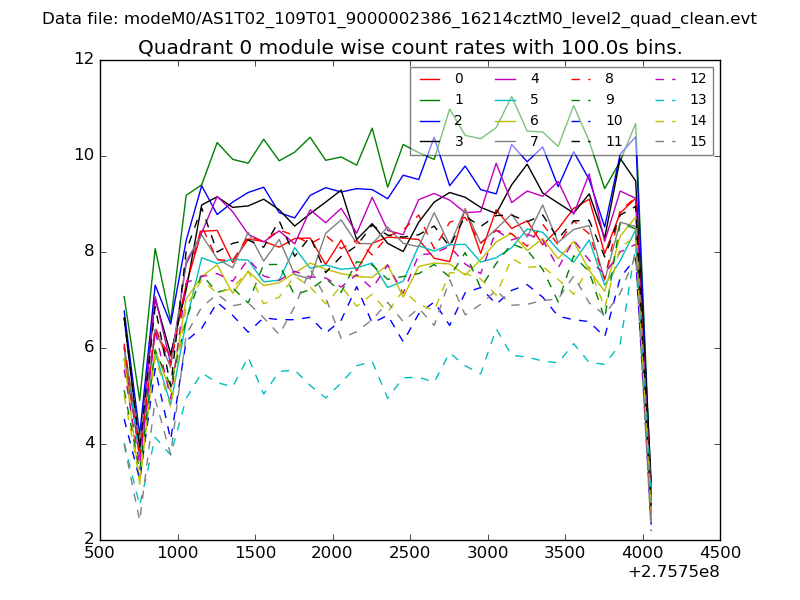 |
 |
| Module-wise count rates for Quadrant B Data is divided into 100 sec bins |
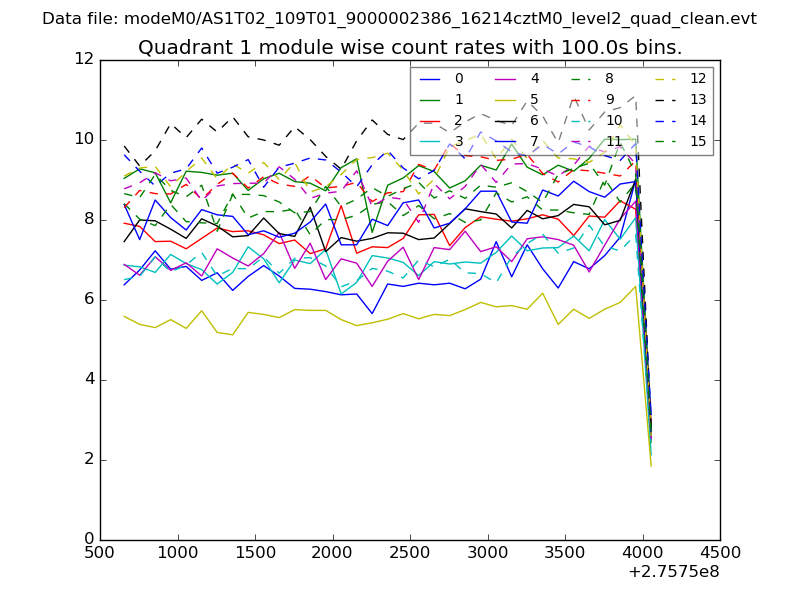 |
 |
| Module-wise count rates for Quadrant C Data is divided into 100 sec bins |
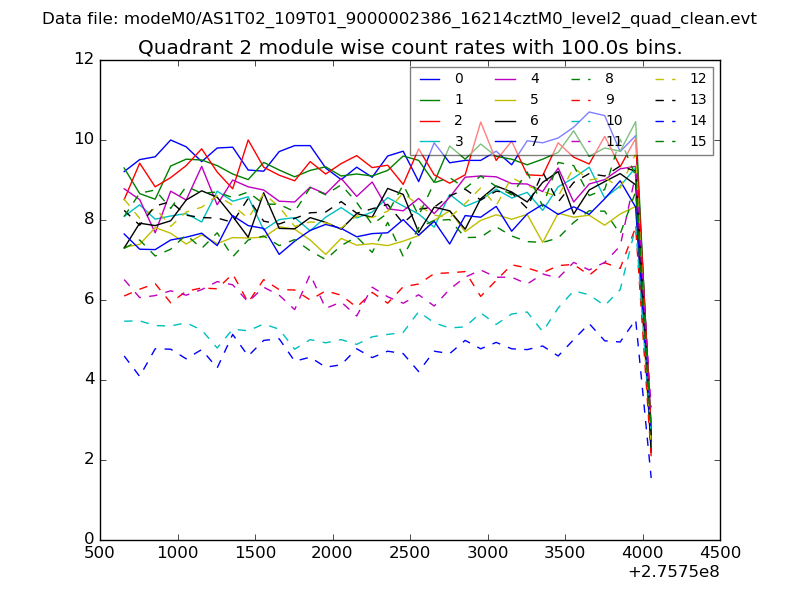 |
 |
| Module-wise count rates for Quadrant D Data is divided into 100 sec bins |
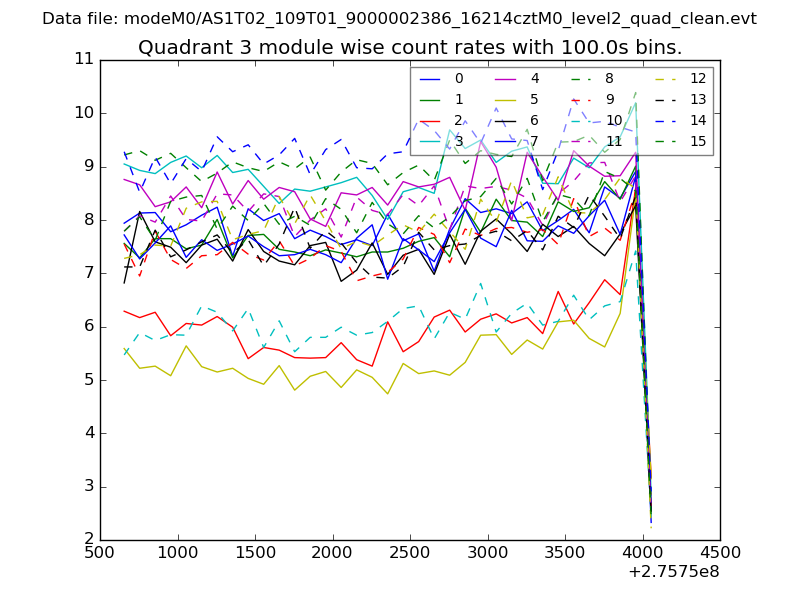 |
 |
| Parameter | Plot |
|---|---|
| CZT HV Monitor | 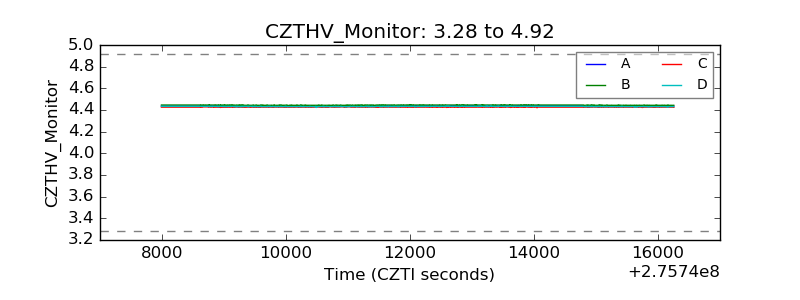 |
| D_VDD | 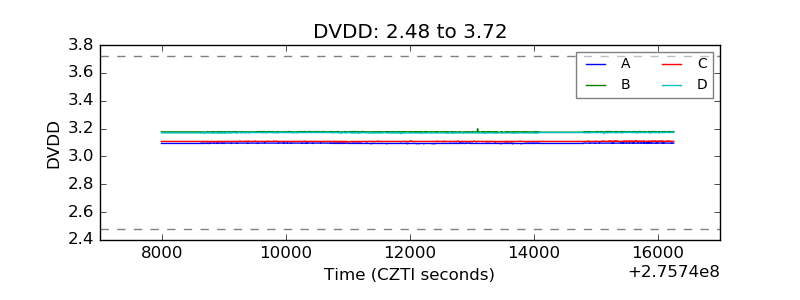 |
| Temperature 1 | 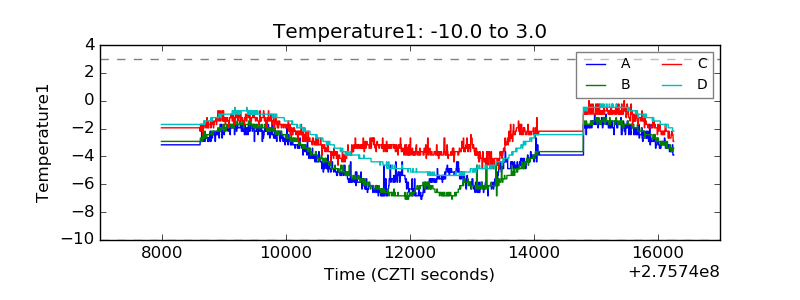 |
| Veto HV Monitor | 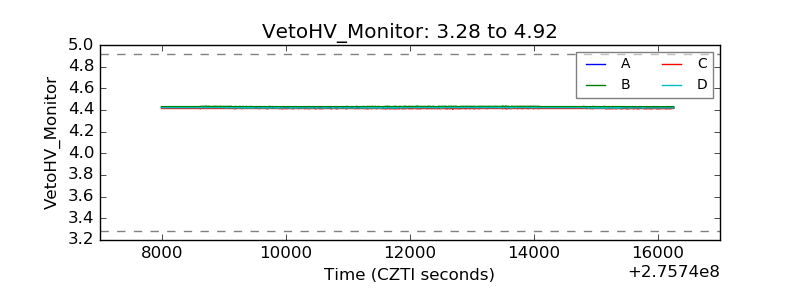 |
| Veto LLD | 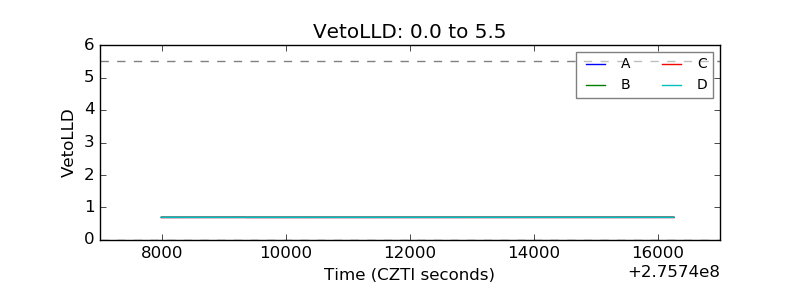 |
| Alpha Counter |  |
| _CPM_Rate | 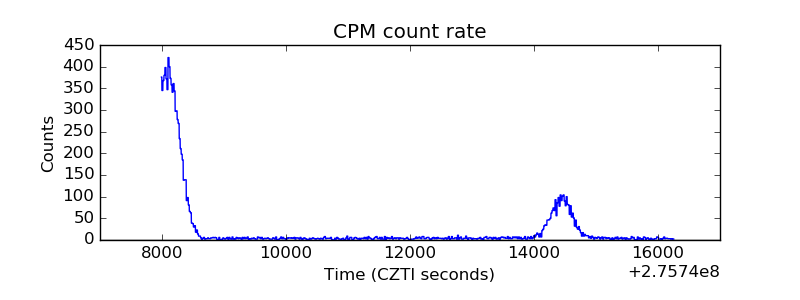 |
| CZT Counter | 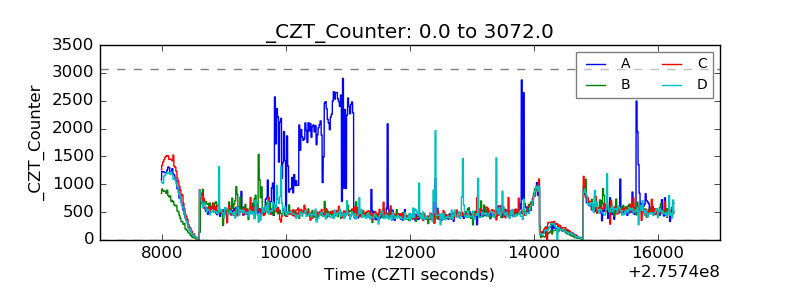 |
| +2.5 Volts monitor | 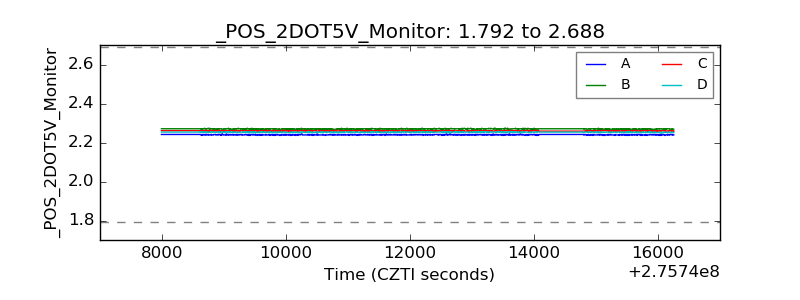 |
| +5 Volts monitor |  |
| _ROLL_ROT | 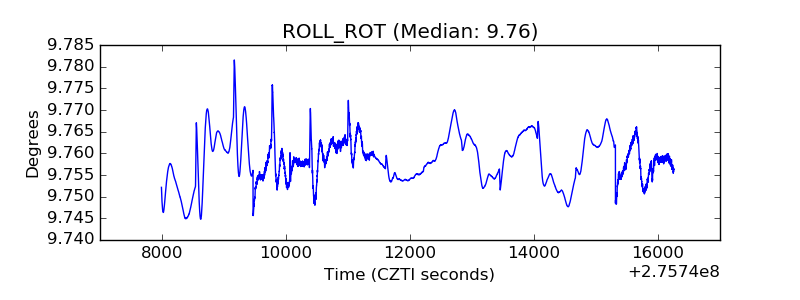 |
| _Roll_DEC | 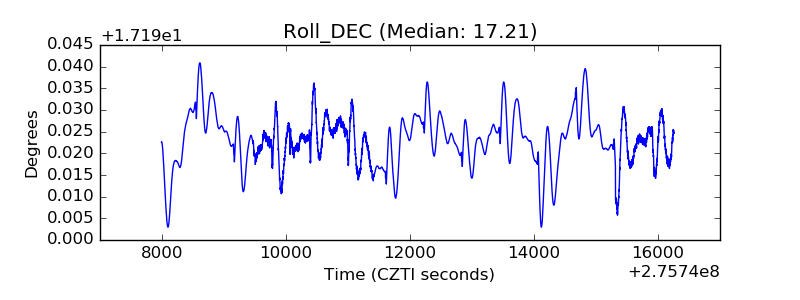 |
| _Roll_RA | 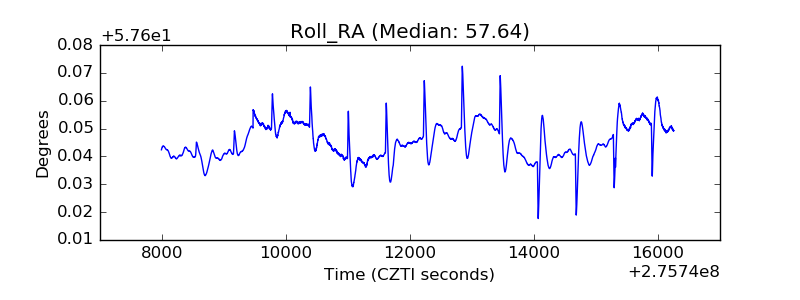 |
| Veto Counter | 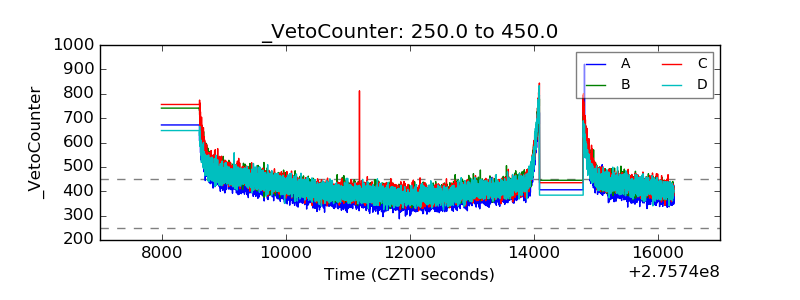 |