| Param | Original file | Final file |
|---|---|---|
| Filename | modeM0/AS1T02_110T01_9000002388cztM0_level2.fits | modeM0/AS1T02_110T01_9000002388cztM0_level2_quad_clean.evt |
| Size (bytes) | 282,064,320 | 280,851,840 |
| Size | 269.0 MB | 267.8 MB |
| Events in quadrant A | 1,688,728 | 1,664,365 |
| Events in quadrant B | 1,624,698 | 1,673,131 |
| Events in quadrant C | 1,663,480 | 1,586,250 |
| Events in quadrant D | 1,471,216 | 1,487,315 |
| Mode M0 | |||
|---|---|---|---|
| Quadrant | BADHDUFLAG | Total packets | Discarded packets |
| A | 0 | 72051 | 0 |
| B | 0 | 66098 | 0 |
| C | 0 | 62599 | 0 |
| D | 0 | 66609 | 0 |
| Mode M9 | |||
|---|---|---|---|
| Quadrant | BADHDUFLAG | Total packets | Discarded packets |
| A | 0 | 29 | 0 |
| B | 0 | 29 | 0 |
| C | 0 | 29 | 0 |
| D | 0 | 29 | 0 |
| Mode SS | |||
|---|---|---|---|
| Quadrant | BADHDUFLAG | Total packets | Discarded packets |
| A | 0 | 620 | 0 |
| B | 0 | 620 | 0 |
| C | 0 | 620 | 0 |
| D | 0 | 620 | 0 |
| Quadrant | Total seconds | Saturated seconds | Saturation percentage |
|---|---|---|---|
| A | 30473 | 751 | 2.464477% |
| B | 30473 | 370 | 1.214190% |
| C | 30473 | 340 | 1.115742% |
| D | 30473 | 289 | 0.948381% |
Noise dominated data is calculated using 1-second bins in cleaned event files. If a bin has >2000 counts, and if more than 50% of those come from <1% of pixels, then it is considered to be noise-dominated and hence unusable.
| Quadrant | # 1 sec bins | Bins with >0 counts | Bins with >2000 counts | High rate bins dominated by noise | Noise dominated (total time) | Noise dominated (detector-on time) | Marked lightcurve |
|---|---|---|---|---|---|---|---|
| A | 32858 | 30473 | 0 | 0 | 0.00% | 0.00% | 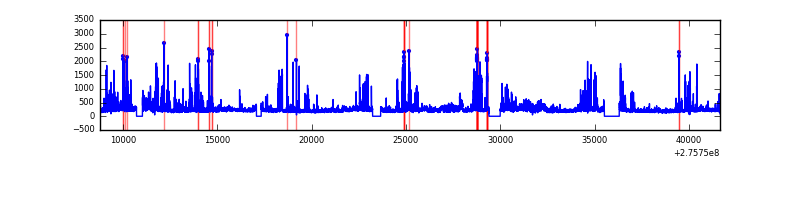 |
| B | 32858 | 30473 | 0 | 0 | 0.00% | 0.00% |  |
| C | 32858 | 30473 | 0 | 0 | 0.00% | 0.00% |  |
| D | 32858 | 30473 | 0 | 0 | 0.00% | 0.00% |  |
Top three noisy pixels from each quadrant. If the there are fewer than three noisy pixels in the level2.evt file, extra rows are filled as -1
| Pixel properties | Quadrant properties | ||||||
|---|---|---|---|---|---|---|---|
| Quadrant | DetID | PixID | Counts | Sigma | Mean | Median | Sigma |
| A | 0 | 29 | 1627 | 10.87 | 439 | 410 | 111.9 |
| A | 9 | 19 | 1351 | 8.41 | 439 | 410 | 111.9 |
| A | 7 | 110 | 1301 | 7.96 | 439 | 410 | 111.9 |
| B | 2 | 9 | 1318 | 10.34 | 429 | 407 | 88.1 |
| B | 3 | 17 | 1198 | 8.97 | 429 | 407 | 88.1 |
| B | 2 | 8 | 1115 | 8.03 | 429 | 407 | 88.1 |
| C | 1 | 80 | 1229 | 7.27 | 438 | 407 | 113.1 |
| C | 1 | 81 | 1223 | 7.21 | 438 | 407 | 113.1 |
| C | 12 | 241 | 1196 | 6.98 | 438 | 407 | 113.1 |
| D | 3 | 14 | 1091 | 6.28 | 419 | 383 | 112.7 |
| D | 3 | 31 | 1039 | 5.82 | 419 | 383 | 112.7 |
| D | 7 | 5 | 1034 | 5.78 | 419 | 383 | 112.7 |
Histogram calculated using DETX and DETY for each event in the final _common_clean file
| Quadrant A | 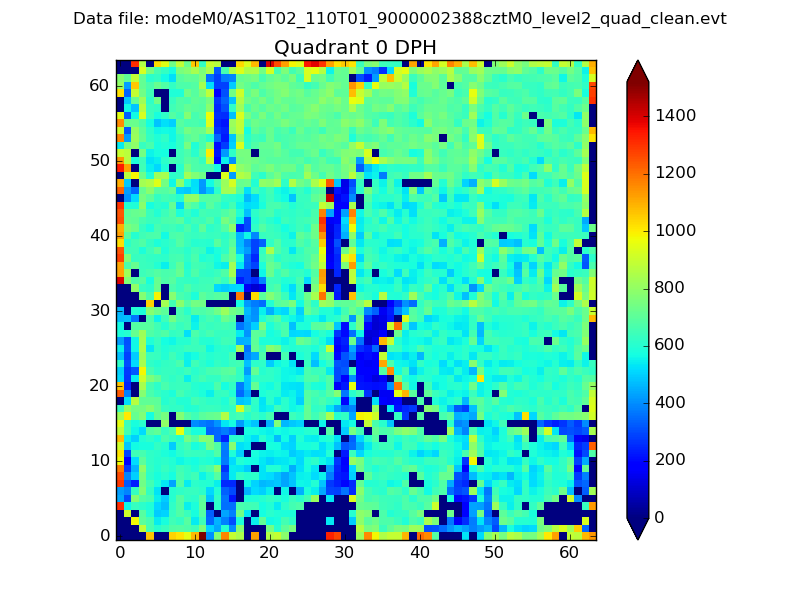 |
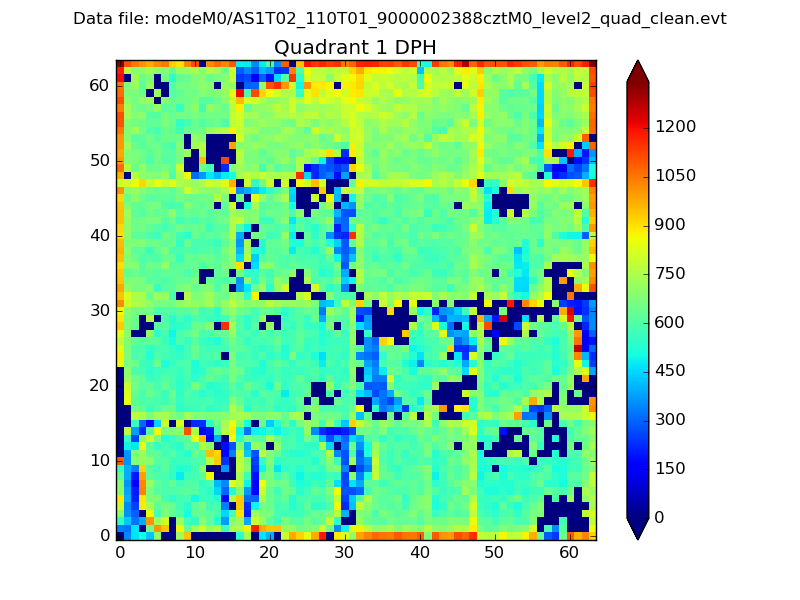 |
Quadrant B |
|---|---|---|---|
| Quadrant D | 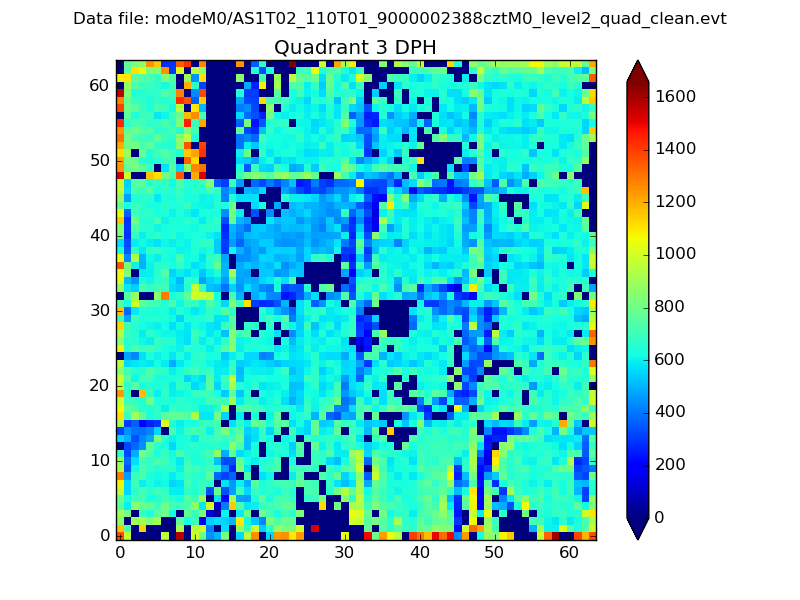 |
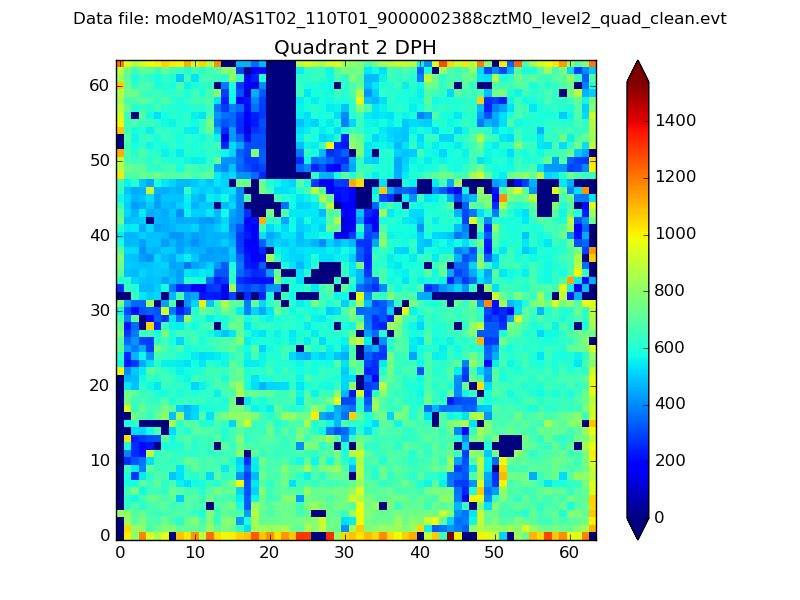 |
Quadrant C |
| Plot type | Count rate plots | Images |
|---|---|---|
| Comparison with Poisson distribution Blue bars denote a histogram of data divided into 1 sec bins. Red curve is a Poisson curve with rate = median count rate of data. |
 |
 |
| Quadrant-wise count rates Data is divided into 100 sec bins |
 |
|
| Module-wise count rates for Quadrant A Data is divided into 100 sec bins |
 |
 |
| Module-wise count rates for Quadrant B Data is divided into 100 sec bins |
 |
 |
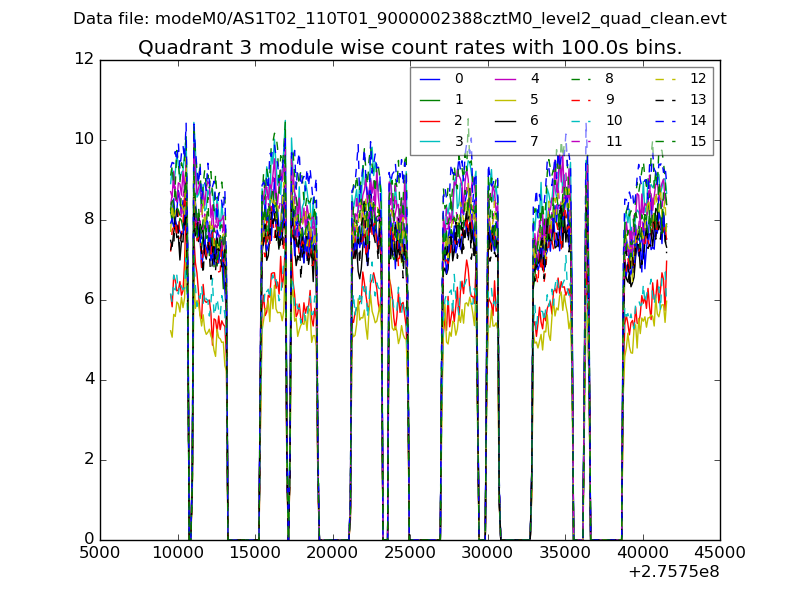
| Module-wise count rates for Quadrant C Data is divided into 100 sec bins |
 |
 |
| Module-wise count rates for Quadrant D Data is divided into 100 sec bins |
 |
 |
| Parameter | Plot |
|---|---|
| CZT HV Monitor |  |
| D_VDD | 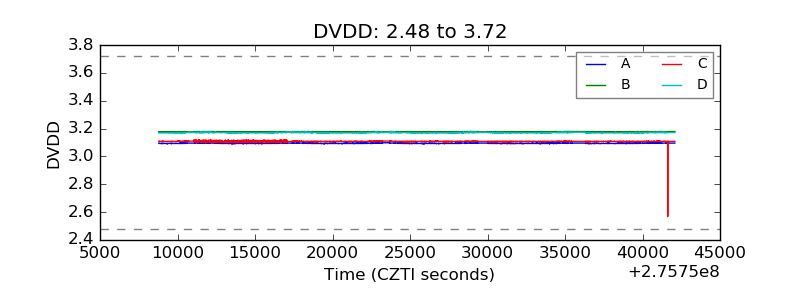 |
| Temperature 1 |  |
| Veto HV Monitor | 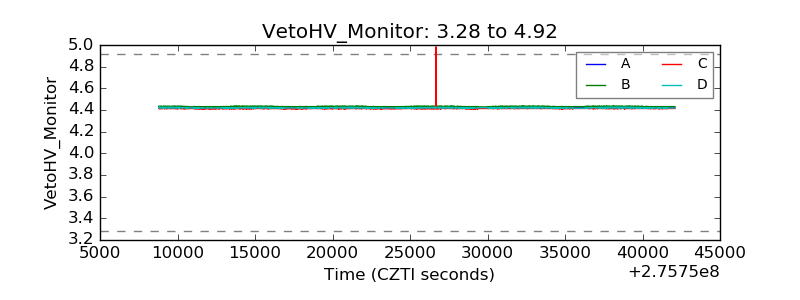 |
| Veto LLD | 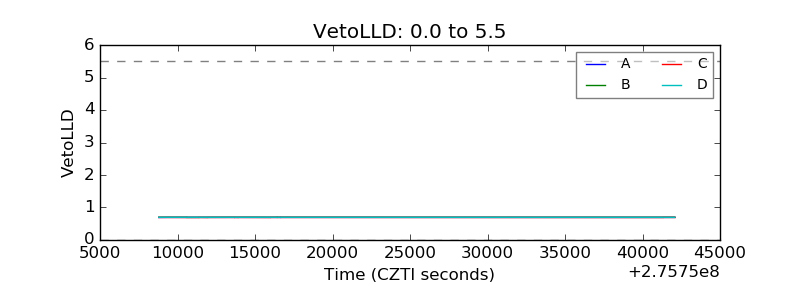 |
| Alpha Counter |  |
| _CPM_Rate |  |
| CZT Counter | 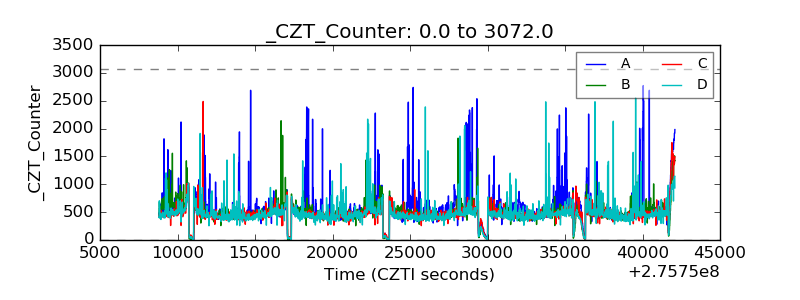 |
| +2.5 Volts monitor |  |
| +5 Volts monitor |  |
| _ROLL_ROT |  |
| _Roll_DEC |  |
| _Roll_RA |  |
| Veto Counter | 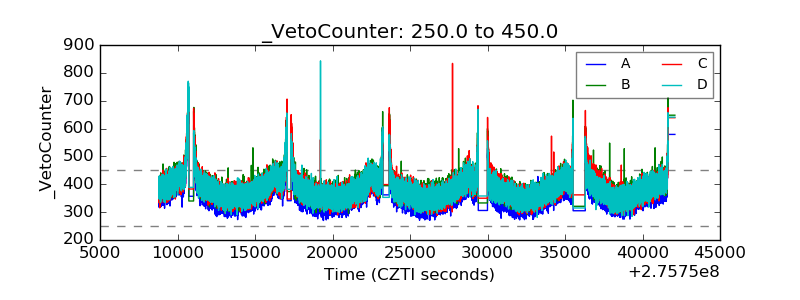 |