| Param | Original file | Final file |
|---|---|---|
| Filename | modeM0/AS1T02_110T01_9000002388_16216cztM0_level2.evt | modeM0/AS1T02_110T01_9000002388_16216cztM0_level2_quad_clean.evt |
| Size (bytes) | 500,509,440 | 100,365,120 |
| Size | 477.3 MB | 95.7 MB |
| Events in quadrant A | 4,125,882 | 649,307 |
| Events in quadrant B | 3,654,347 | 646,166 |
| Events in quadrant C | 3,430,828 | 618,457 |
| Events in quadrant D | 3,455,900 | 622,268 |
| Mode M0 | |||
|---|---|---|---|
| Quadrant | BADHDUFLAG | Total packets | Discarded packets |
| A | 0 | 16877 | 2 |
| B | 0 | 15509 | 1 |
| C | 0 | 14902 | 1 |
| D | 0 | 15297 | 1 |
| Mode M9 | |||
|---|---|---|---|
| Quadrant | BADHDUFLAG | Total packets | Discarded packets |
| A | 0 | 3 | 0 |
| B | 0 | 3 | 0 |
| C | 0 | 3 | 0 |
| D | 0 | 3 | 0 |
| Mode SS | |||
|---|---|---|---|
| Quadrant | BADHDUFLAG | Total packets | Discarded packets |
| A | 0 | 144 | 0 |
| B | 0 | 144 | 0 |
| C | 0 | 144 | 0 |
| D | 0 | 144 | 0 |
| Quadrant | Total seconds | Saturated seconds | Saturation percentage |
|---|---|---|---|
| A | 7240 | 141 | 1.947514% |
| B | 7240 | 96 | 1.325967% |
| C | 7240 | 77 | 1.063536% |
| D | 7240 | 28 | 0.386740% |
Noise dominated data is calculated using 1-second bins in cleaned event files. If a bin has >2000 counts, and if more than 50% of those come from <1% of pixels, then it is considered to be noise-dominated and hence unusable.
| Quadrant | # 1 sec bins | Bins with >0 counts | Bins with >2000 counts | High rate bins dominated by noise | Noise dominated (total time) | Noise dominated (detector-on time) | Marked lightcurve |
|---|---|---|---|---|---|---|---|
| A | 7496 | 7242 | 89 | 89 | 1.19% | 1.23% | 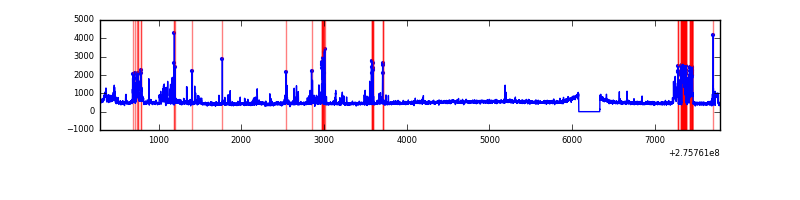 |
| B | 7496 | 7242 | 23 | 23 | 0.31% | 0.32% | 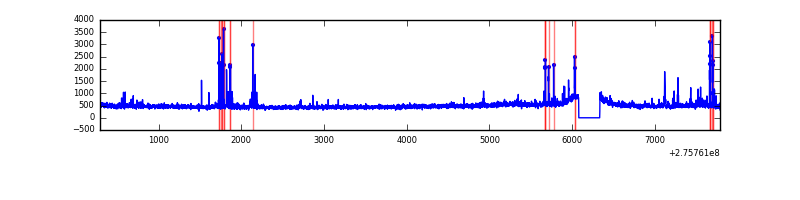 |
| C | 7496 | 7242 | 1 | 1 | 0.01% | 0.01% | 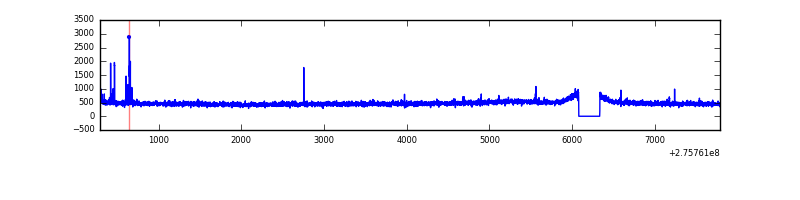 |
| D | 7496 | 7242 | 14 | 14 | 0.19% | 0.19% | 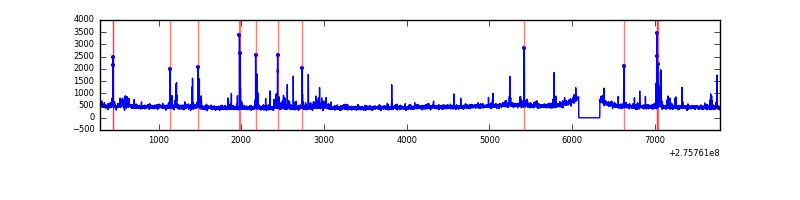 |
Top three noisy pixels from each quadrant. If the there are fewer than three noisy pixels in the level2.evt file, extra rows are filled as -1
| Pixel properties | Quadrant properties | ||||||
|---|---|---|---|---|---|---|---|
| Quadrant | DetID | PixID | Counts | Sigma | Mean | Median | Sigma |
| A | 15 | 174 | 419742 | 2376.05 | 859 | 838 | 176.3 |
| A | 4 | 2 | 274812 | 1554.0 | 859 | 838 | 176.3 |
| A | 0 | 253 | 80667 | 452.8 | 859 | 838 | 176.3 |
| B | 0 | 189 | 104509 | 631.7 | 857 | 833 | 164.1 |
| B | 0 | 198 | 85546 | 516.16 | 857 | 833 | 164.1 |
| B | 0 | 219 | 30716 | 182.08 | 857 | 833 | 164.1 |
| C | 14 | 238 | 127369 | 652.52 | 825 | 831 | 193.9 |
| C | 0 | 207 | 37988 | 191.61 | 825 | 831 | 193.9 |
| C | 3 | 233 | 18568 | 91.47 | 825 | 831 | 193.9 |
| D | 2 | 233 | 180628 | 868.88 | 843 | 817 | 206.9 |
| D | 2 | 234 | 34729 | 163.87 | 843 | 817 | 206.9 |
| D | 1 | 52 | 34690 | 163.68 | 843 | 817 | 206.9 |
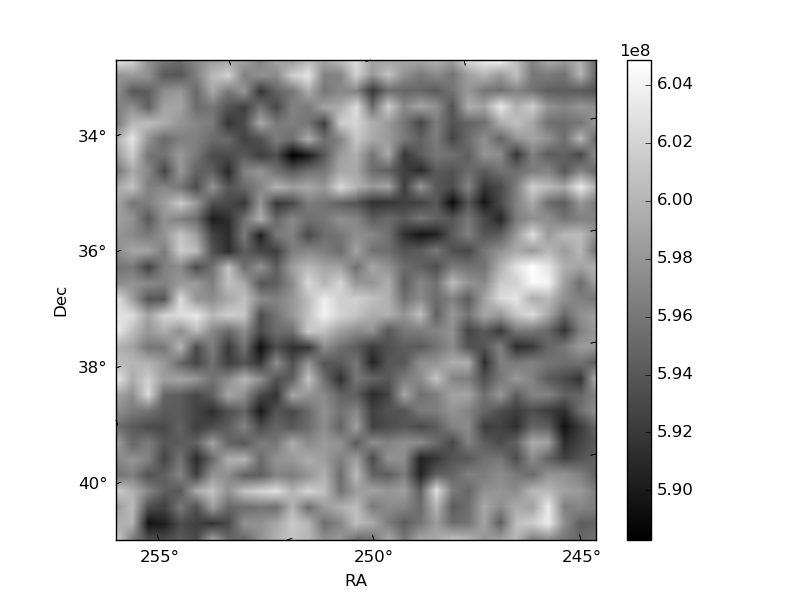
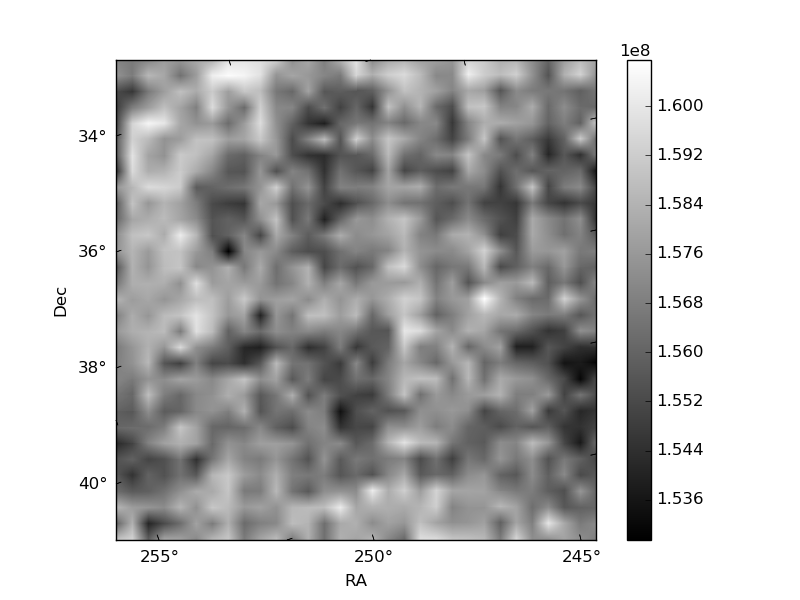
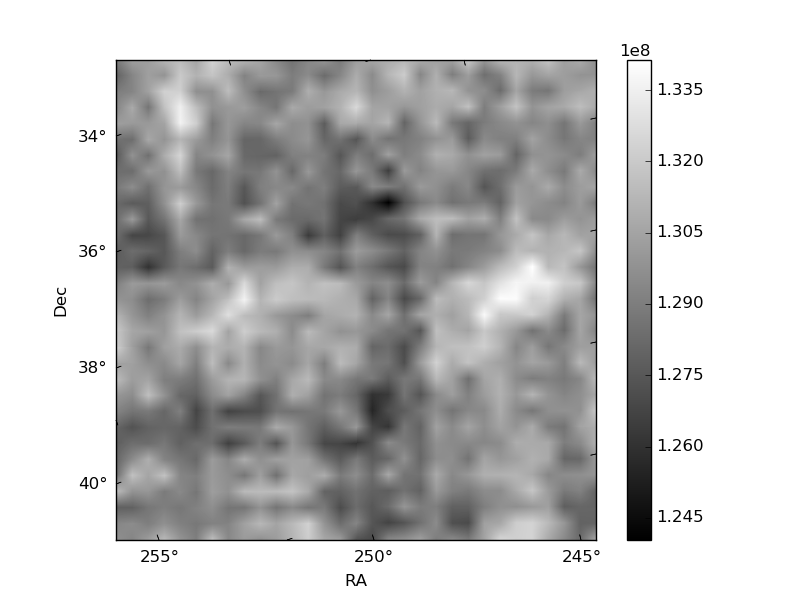
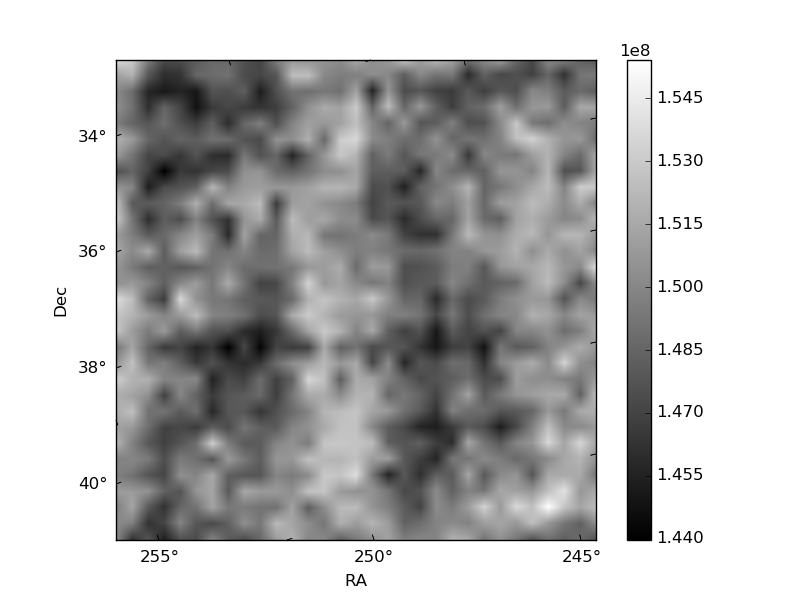
Histogram calculated using DETX and DETY for each event in the final _common_clean file
| Quadrant A | 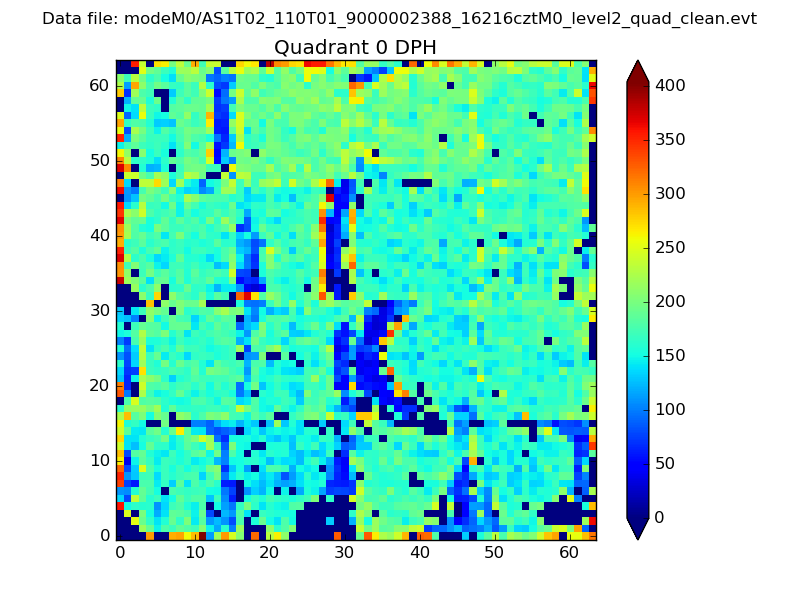 |
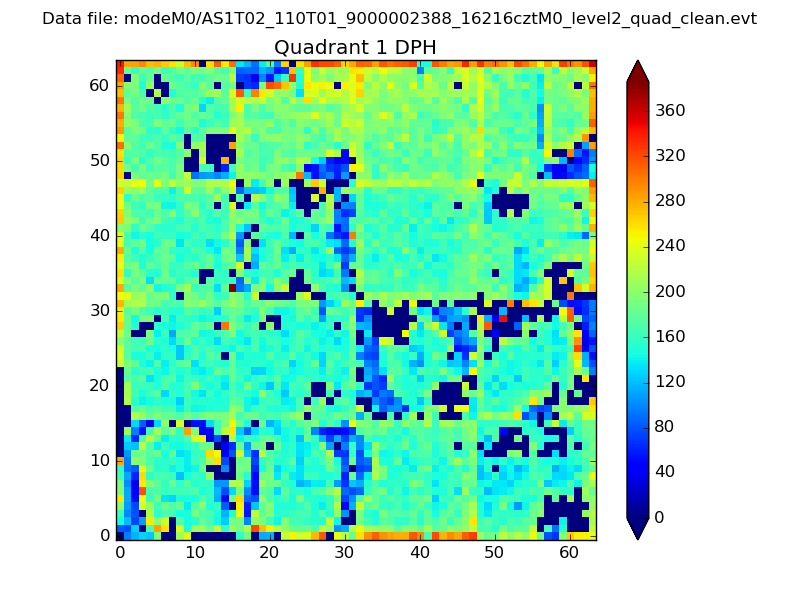 |
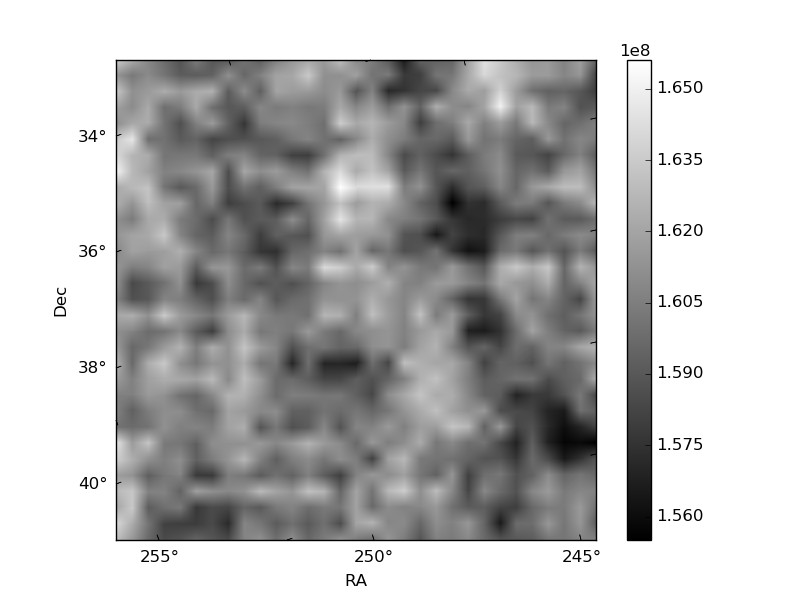
Quadrant B |
|---|---|---|---|
| Quadrant D | 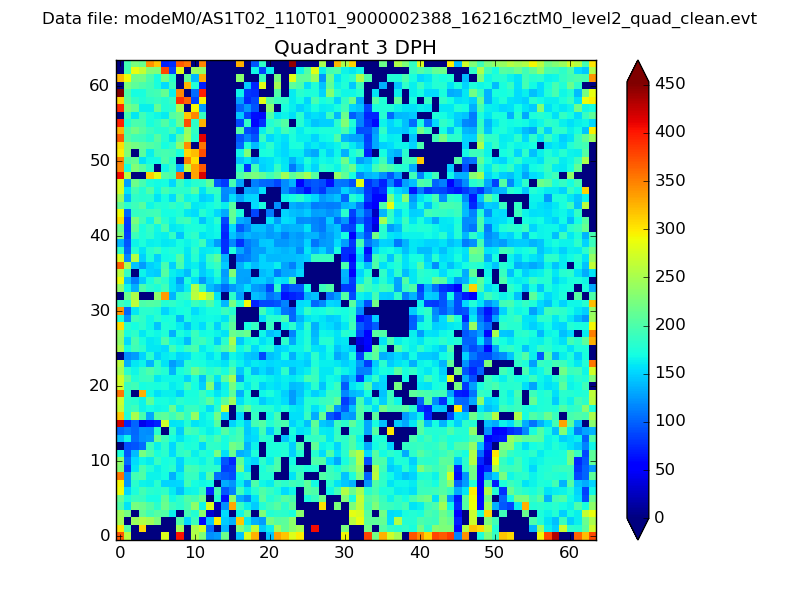 |
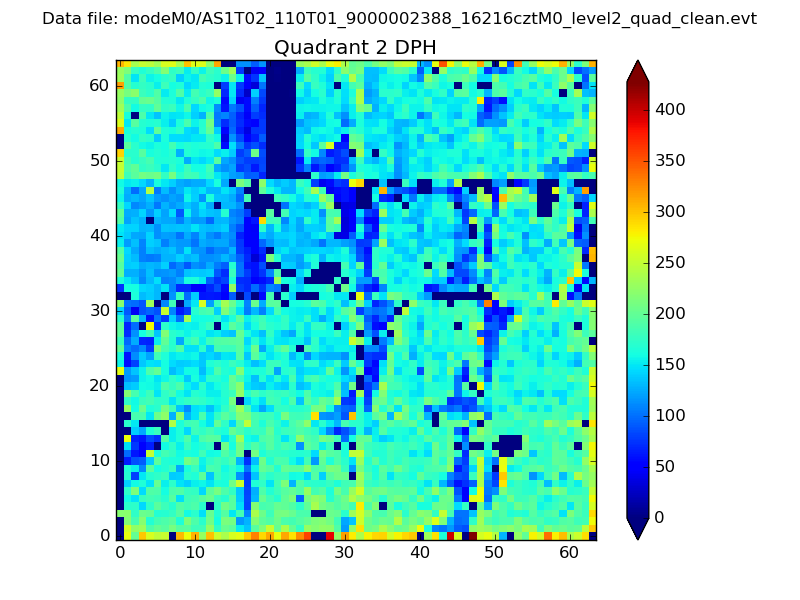 |
Quadrant C |
| Plot type | Count rate plots | Images |
|---|---|---|
| Comparison with Poisson distribution Blue bars denote a histogram of data divided into 1 sec bins. Red curve is a Poisson curve with rate = median count rate of data. |
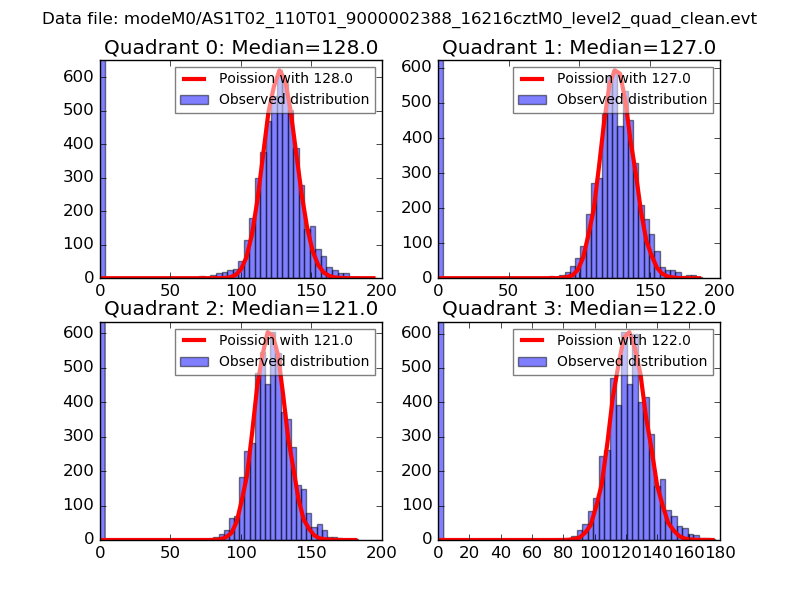 |
 |
| Quadrant-wise count rates Data is divided into 100 sec bins |
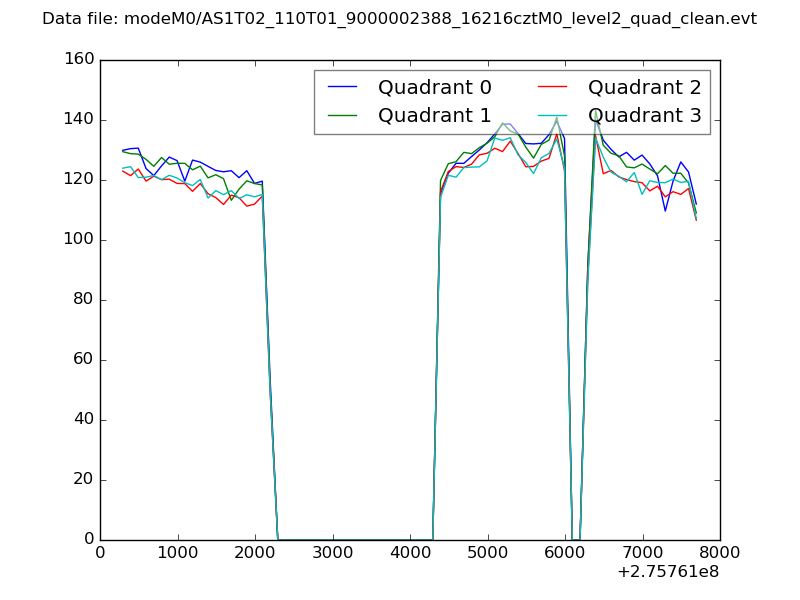 |
|
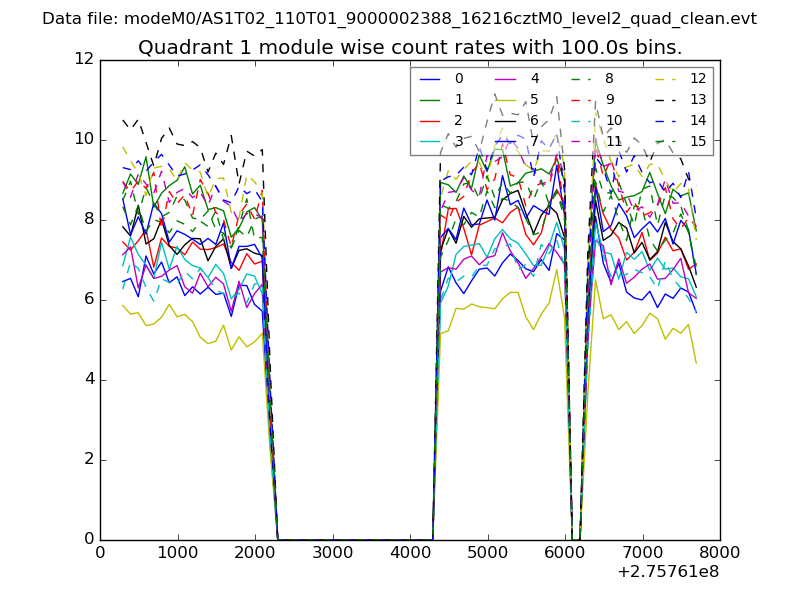
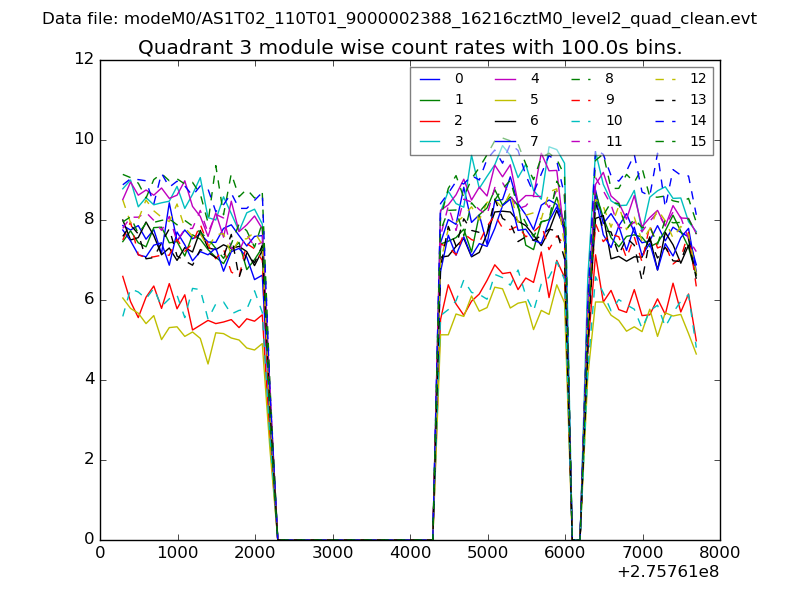
| Module-wise count rates for Quadrant A Data is divided into 100 sec bins |
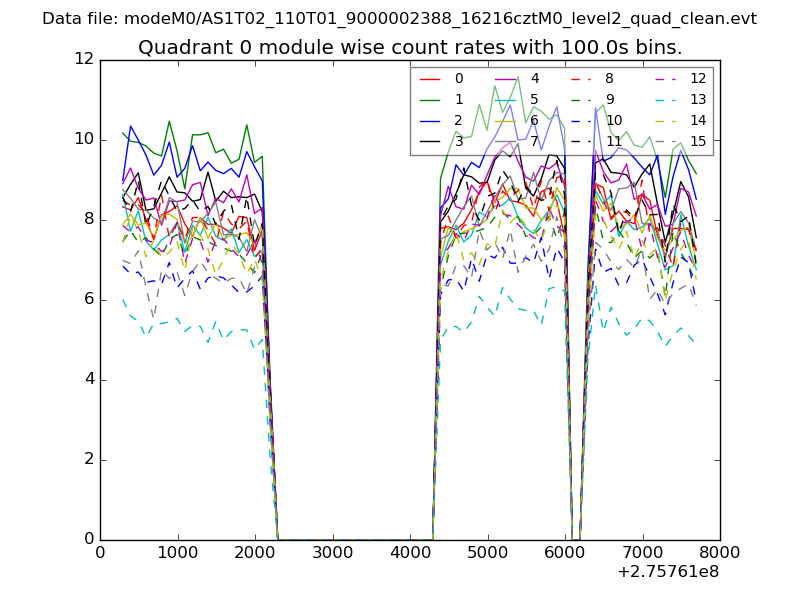 |
 |
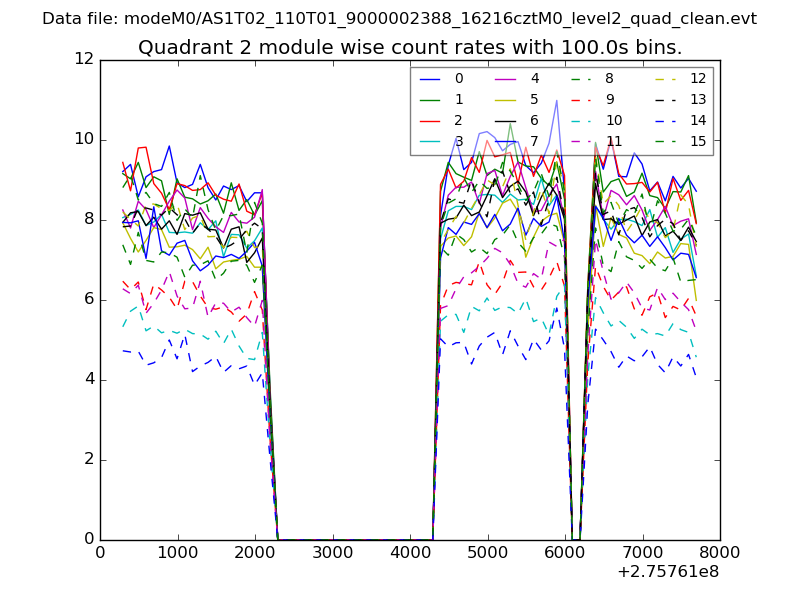
| Module-wise count rates for Quadrant B Data is divided into 100 sec bins |
 |
 |
| Module-wise count rates for Quadrant C Data is divided into 100 sec bins |
 |
 |
| Module-wise count rates for Quadrant D Data is divided into 100 sec bins |
 |
 |
| Parameter | Plot |
|---|---|
| CZT HV Monitor | 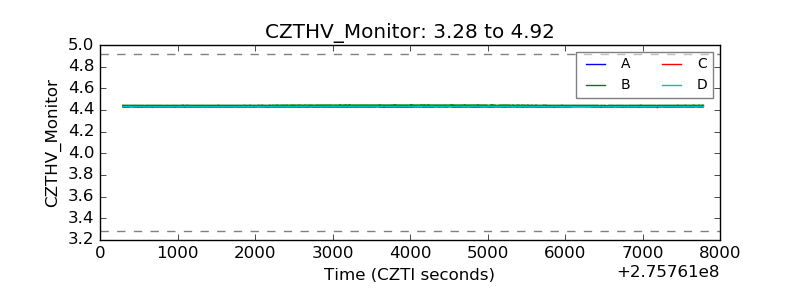 |
| D_VDD | 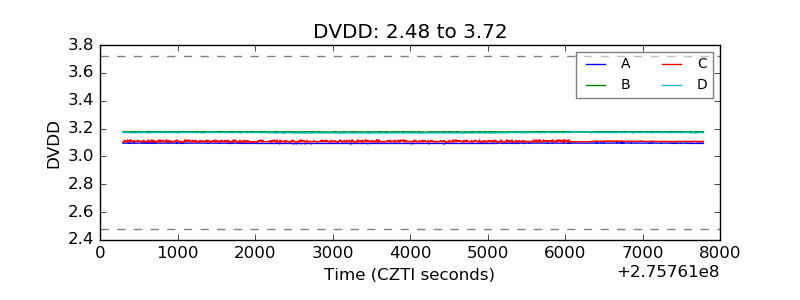 |
| Temperature 1 | 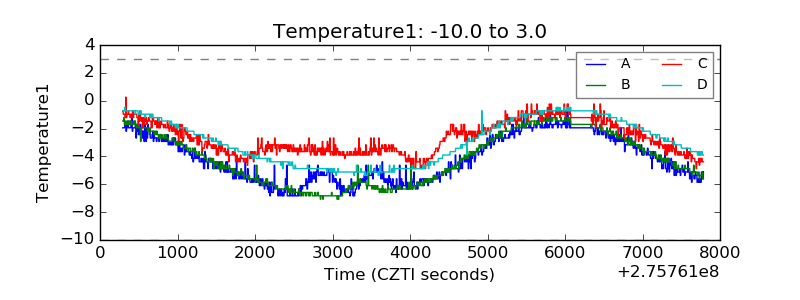 |
| Veto HV Monitor |  |
| Veto LLD | 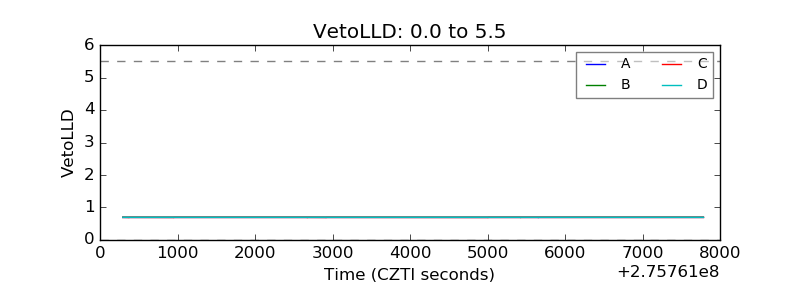 |
| Alpha Counter |  |
| _CPM_Rate |  |
| CZT Counter | 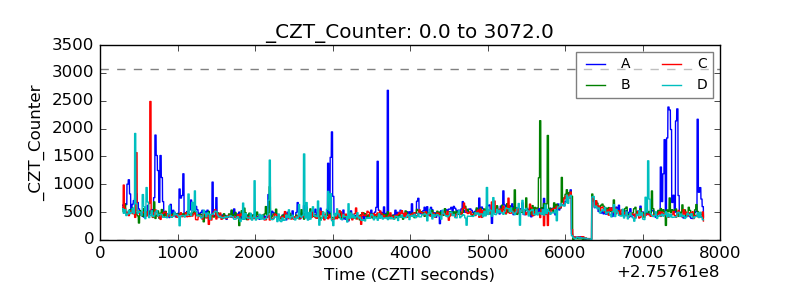 |
| +2.5 Volts monitor |  |
| +5 Volts monitor |  |
| _ROLL_ROT | 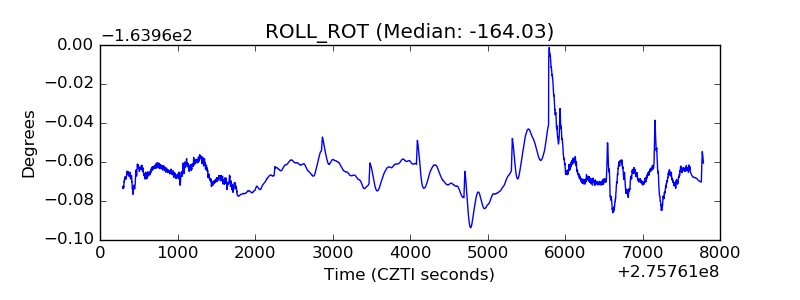 |
| _Roll_DEC | 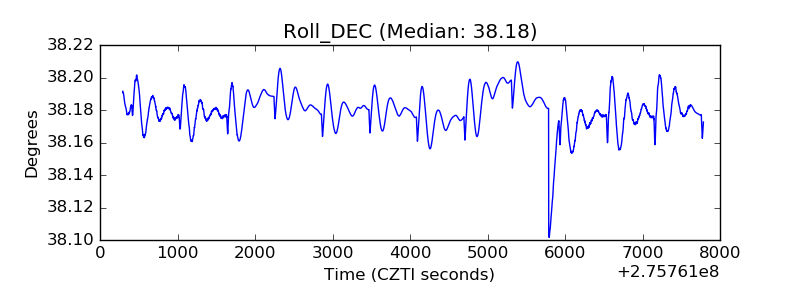 |
| _Roll_RA | 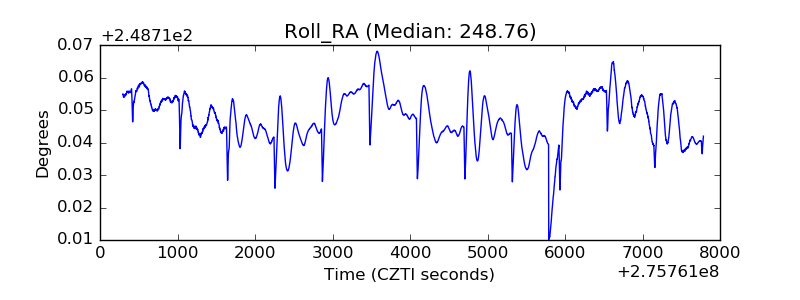 |
| Veto Counter | 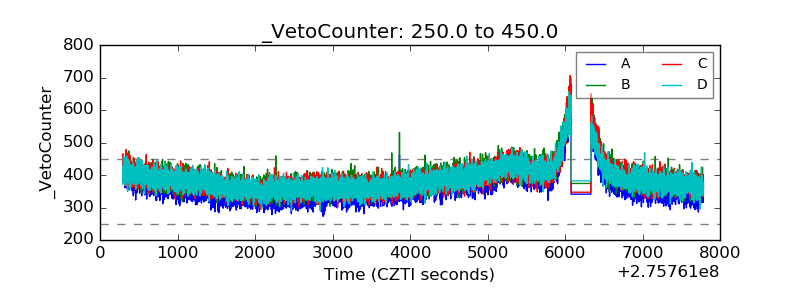 |