| Param | Original file | Final file |
|---|---|---|
| Filename | modeM0/AS1T02_110T01_9000002388_16217cztM0_level2.evt | modeM0/AS1T02_110T01_9000002388_16217cztM0_level2_quad_clean.evt |
| Size (bytes) | 529,764,480 | 99,665,280 |
| Size | 505.2 MB | 95.0 MB |
| Events in quadrant A | 4,360,118 | 637,255 |
| Events in quadrant B | 3,820,873 | 638,035 |
| Events in quadrant C | 3,499,817 | 611,226 |
| Events in quadrant D | 3,855,122 | 610,982 |
| Mode M0 | |||
|---|---|---|---|
| Quadrant | BADHDUFLAG | Total packets | Discarded packets |
| A | 0 | 17975 | 3 |
| B | 0 | 16314 | 2 |
| C | 0 | 15292 | 2 |
| D | 0 | 16679 | 2 |
| Mode M9 | |||
|---|---|---|---|
| Quadrant | BADHDUFLAG | Total packets | Discarded packets |
| A | 0 | 7 | 0 |
| B | 0 | 7 | 0 |
| C | 0 | 7 | 0 |
| D | 0 | 7 | 0 |
| Mode SS | |||
|---|---|---|---|
| Quadrant | BADHDUFLAG | Total packets | Discarded packets |
| A | 0 | 154 | 0 |
| B | 0 | 154 | 0 |
| C | 0 | 154 | 0 |
| D | 0 | 154 | 0 |
| Quadrant | Total seconds | Saturated seconds | Saturation percentage |
|---|---|---|---|
| A | 7484 | 228 | 3.046499% |
| B | 7484 | 87 | 1.162480% |
| C | 7484 | 71 | 0.948691% |
| D | 7484 | 96 | 1.282737% |
Noise dominated data is calculated using 1-second bins in cleaned event files. If a bin has >2000 counts, and if more than 50% of those come from <1% of pixels, then it is considered to be noise-dominated and hence unusable.
| Quadrant | # 1 sec bins | Bins with >0 counts | Bins with >2000 counts | High rate bins dominated by noise | Noise dominated (total time) | Noise dominated (detector-on time) | Marked lightcurve |
|---|---|---|---|---|---|---|---|
| A | 8165 | 7487 | 159 | 159 | 1.95% | 2.12% |  |
| B | 8165 | 7487 | 11 | 11 | 0.13% | 0.15% | 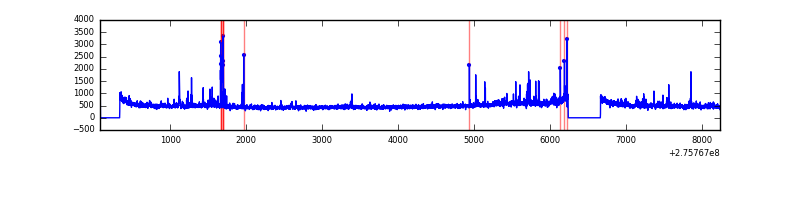 |
| C | 8165 | 7487 | 0 | 0 | 0.00% | 0.00% | 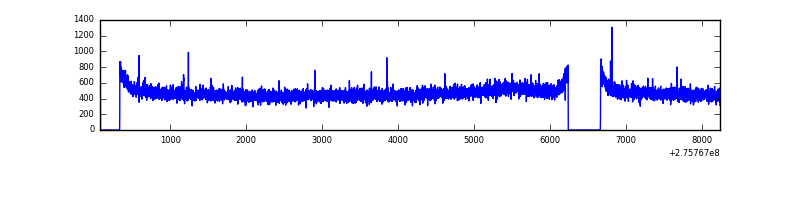 |
| D | 8165 | 7487 | 42 | 42 | 0.51% | 0.56% | 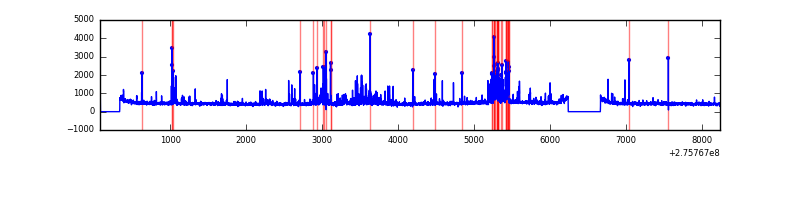 |
Top three noisy pixels from each quadrant. If the there are fewer than three noisy pixels in the level2.evt file, extra rows are filled as -1
| Pixel properties | Quadrant properties | ||||||
|---|---|---|---|---|---|---|---|
| Quadrant | DetID | PixID | Counts | Sigma | Mean | Median | Sigma |
| A | 15 | 174 | 751762 | 4220.26 | 880 | 859 | 177.9 |
| A | 8 | 247 | 80816 | 449.38 | 880 | 859 | 177.9 |
| A | 4 | 2 | 71939 | 399.49 | 880 | 859 | 177.9 |
| B | 0 | 219 | 108071 | 637.95 | 884 | 860 | 168.1 |
| B | 0 | 198 | 92045 | 542.59 | 884 | 860 | 168.1 |
| B | 0 | 189 | 69348 | 407.53 | 884 | 860 | 168.1 |
| C | 14 | 238 | 132459 | 656.29 | 851 | 855 | 200.5 |
| C | 3 | 233 | 26231 | 126.55 | 851 | 855 | 200.5 |
| C | 7 | 247 | 22263 | 106.76 | 851 | 855 | 200.5 |
| D | 2 | 233 | 450201 | 2135.84 | 864 | 840 | 210.4 |
| D | 15 | 0 | 79985 | 376.18 | 864 | 840 | 210.4 |
| D | 2 | 234 | 37415 | 173.84 | 864 | 840 | 210.4 |
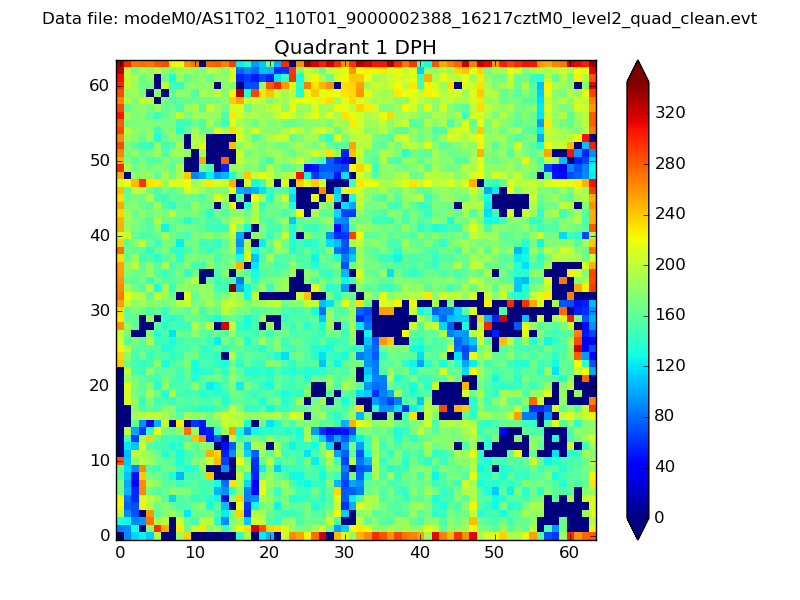
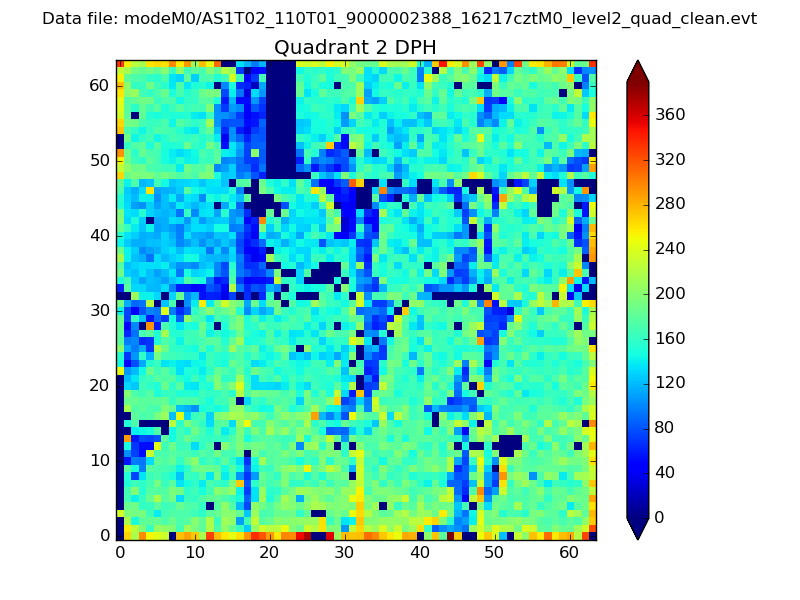
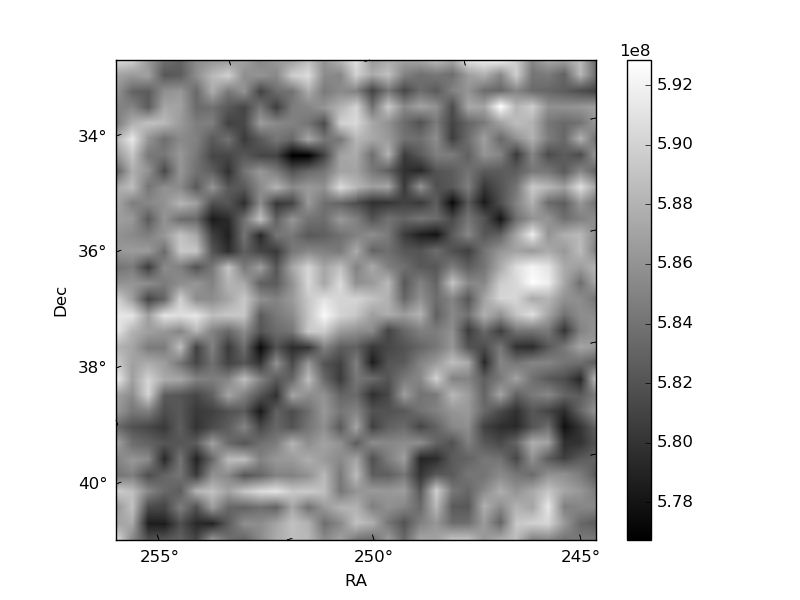
Histogram calculated using DETX and DETY for each event in the final _common_clean file
| Quadrant A | 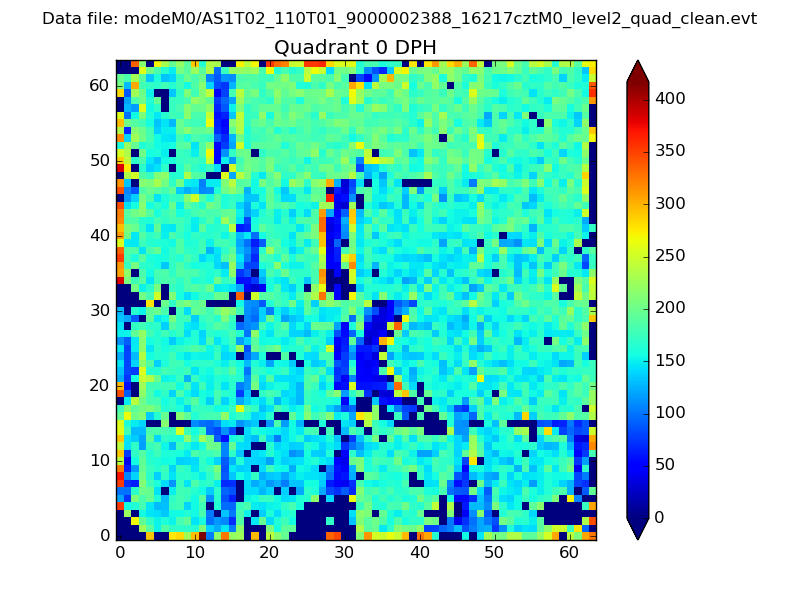 |
 |
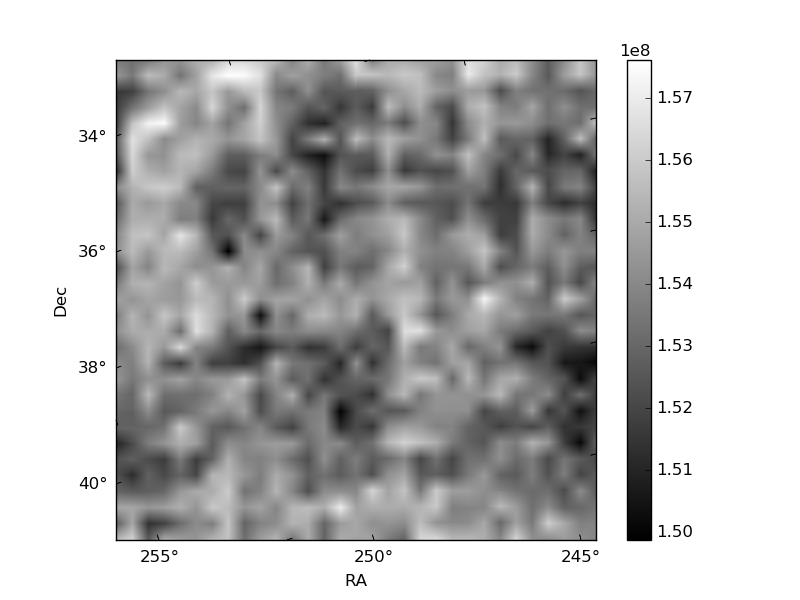
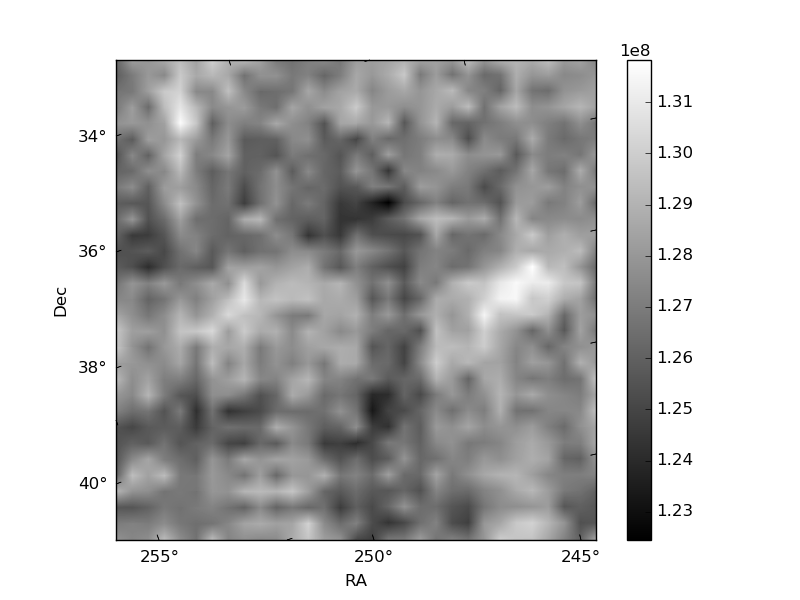
Quadrant B |
|---|---|---|---|
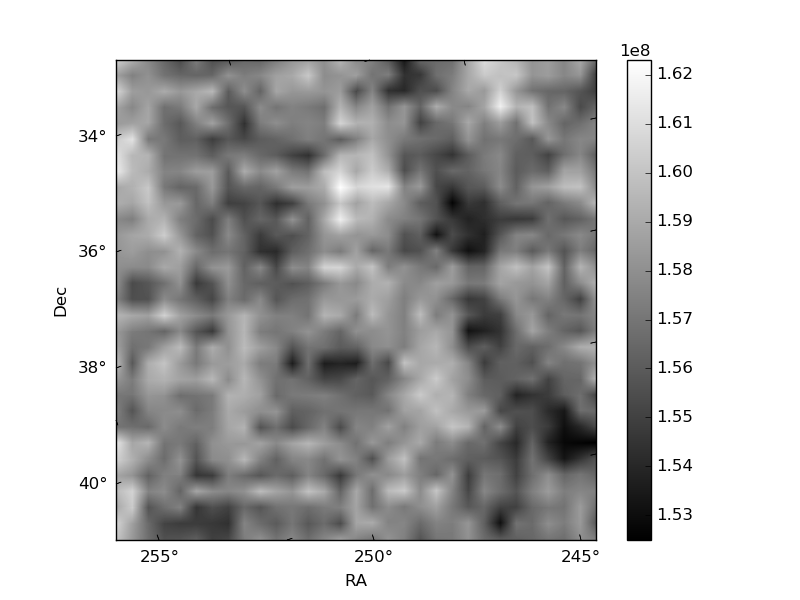
| Quadrant D | 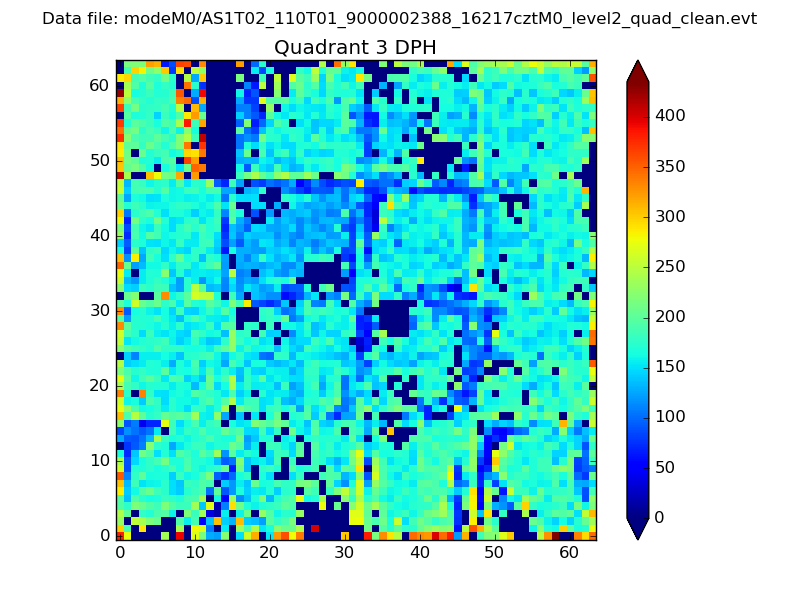 |
 |
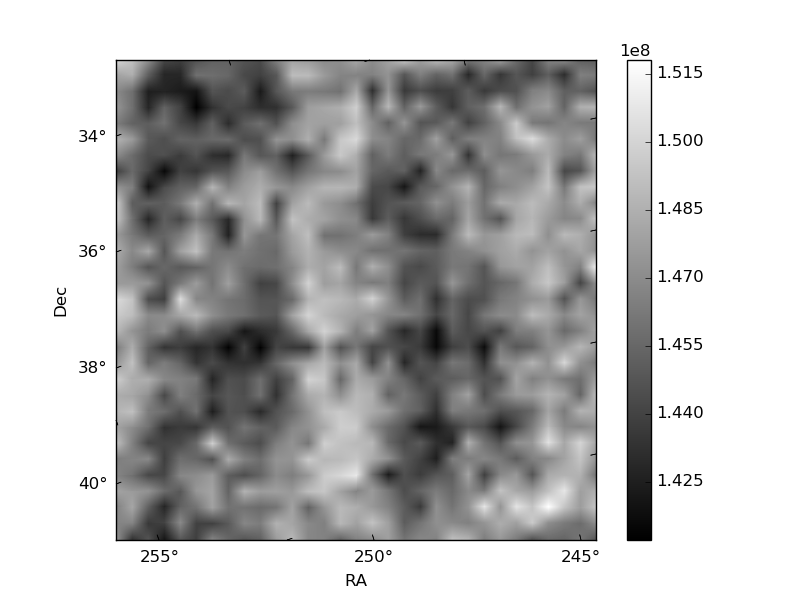
Quadrant C |
| Plot type | Count rate plots | Images |
|---|---|---|
| Comparison with Poisson distribution Blue bars denote a histogram of data divided into 1 sec bins. Red curve is a Poisson curve with rate = median count rate of data. |
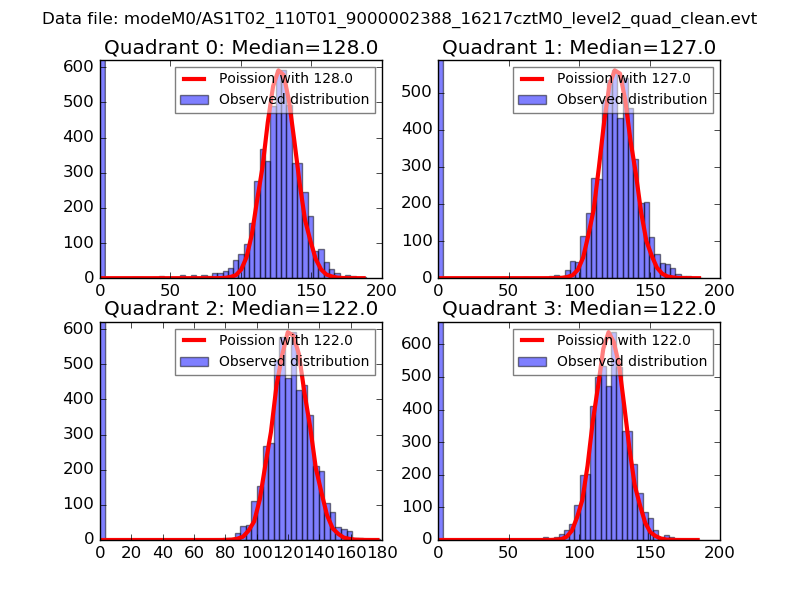 |
 |
| Quadrant-wise count rates Data is divided into 100 sec bins |
 |
|
| Module-wise count rates for Quadrant A Data is divided into 100 sec bins |
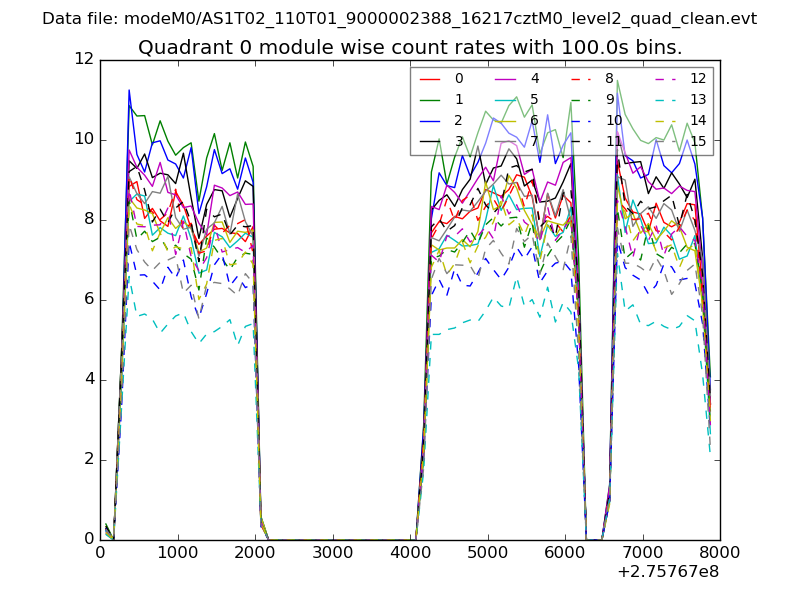 |
 |
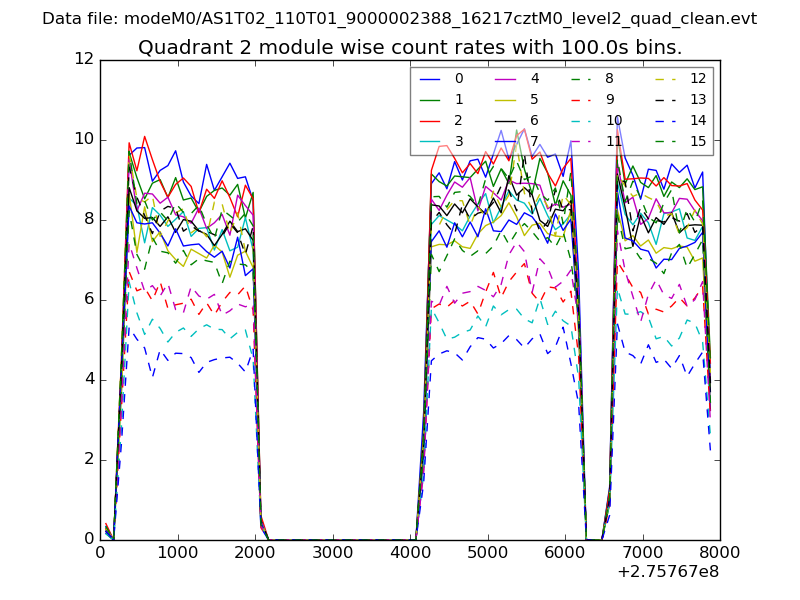
| Module-wise count rates for Quadrant B Data is divided into 100 sec bins |
 |
 |
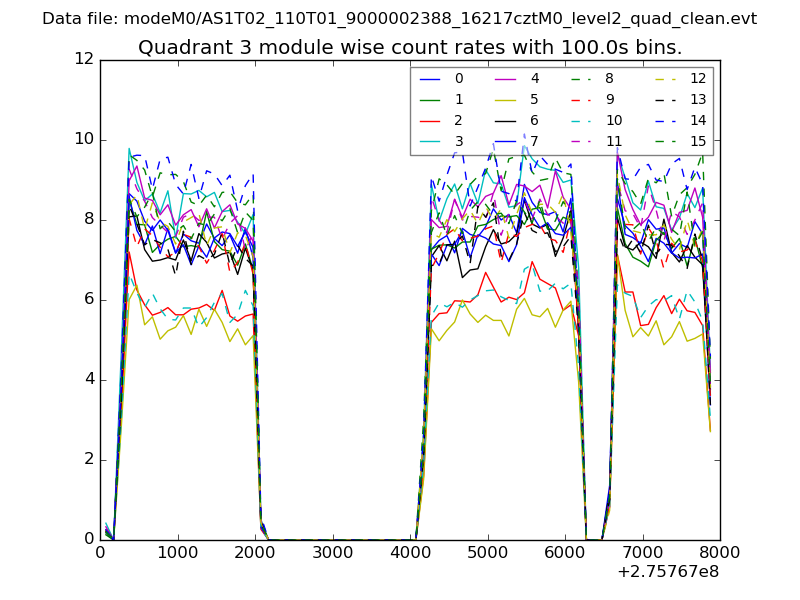
| Module-wise count rates for Quadrant C Data is divided into 100 sec bins |
 |
 |
| Module-wise count rates for Quadrant D Data is divided into 100 sec bins |
 |
 |
| Parameter | Plot |
|---|---|
| CZT HV Monitor | 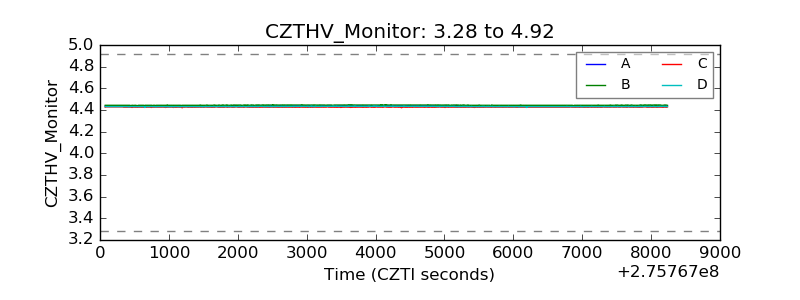 |
| D_VDD | 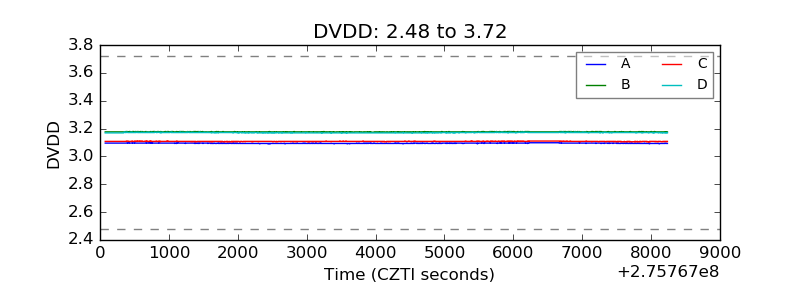 |
| Temperature 1 | 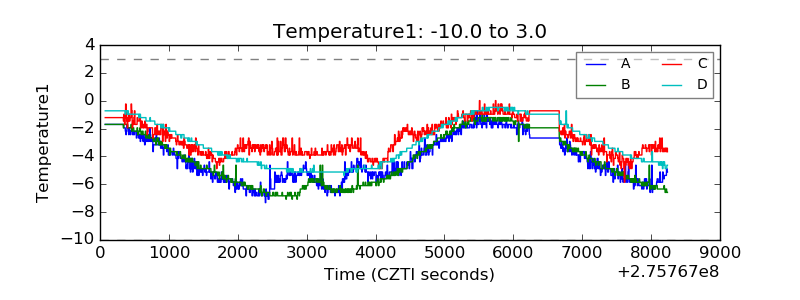 |
| Veto HV Monitor | 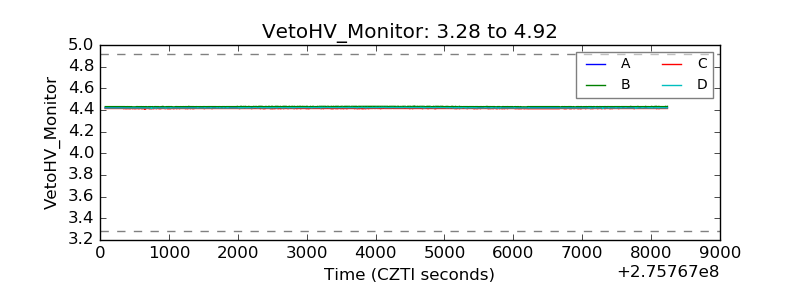 |
| Veto LLD | 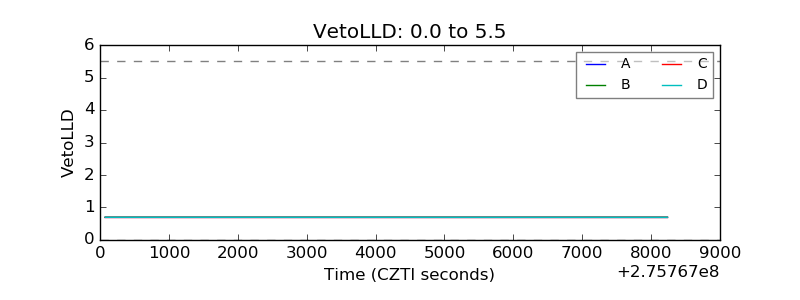 |
| Alpha Counter |  |
| _CPM_Rate | 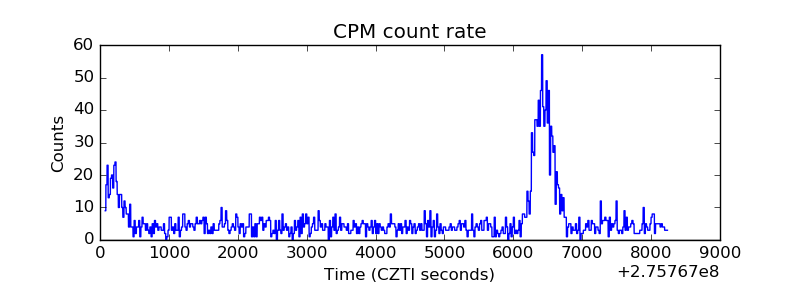 |
| CZT Counter | 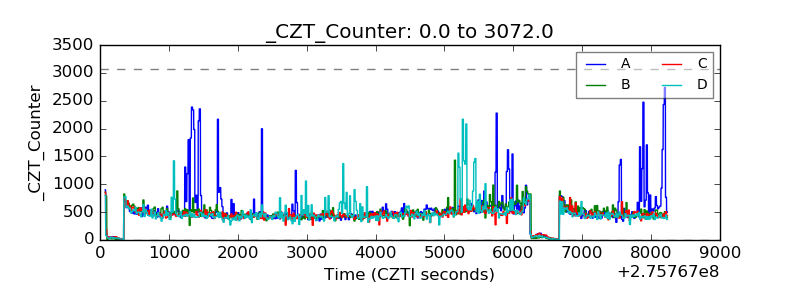 |
| +2.5 Volts monitor |  |
| +5 Volts monitor |  |
| _ROLL_ROT | 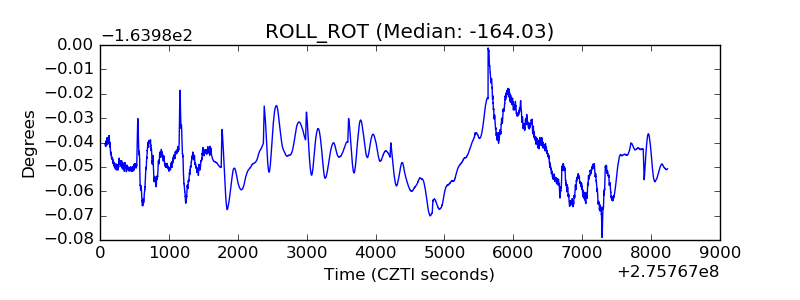 |
| _Roll_DEC | 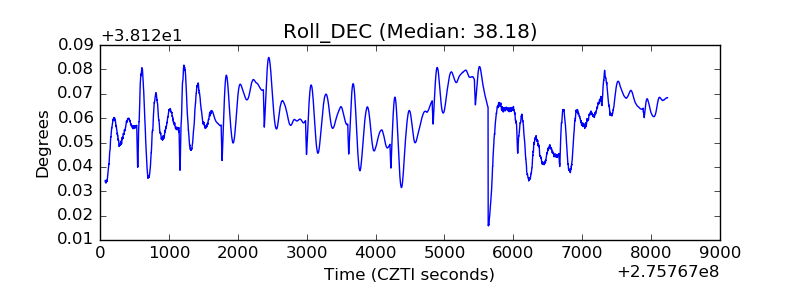 |
| _Roll_RA | 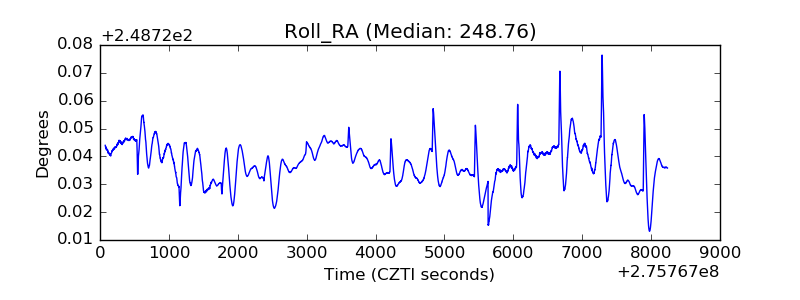 |
| Veto Counter | 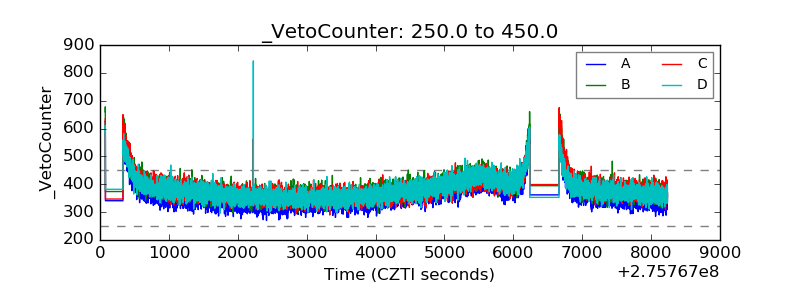 |