| Param | Original file | Final file |
|---|---|---|
| Filename | modeM0/AS1T02_110T01_9000002388_16219cztM0_level2.evt | modeM0/AS1T02_110T01_9000002388_16219cztM0_level2_quad_clean.evt |
| Size (bytes) | 880,781,760 | 144,432,000 |
| Size | 840.0 MB | 137.7 MB |
| Events in quadrant A | 7,524,444 | 887,673 |
| Events in quadrant B | 6,151,190 | 897,806 |
| Events in quadrant C | 5,902,271 | 861,192 |
| Events in quadrant D | 6,248,306 | 861,056 |
| Mode M0 | |||
|---|---|---|---|
| Quadrant | BADHDUFLAG | Total packets | Discarded packets |
| A | 0 | 30579 | 3 |
| B | 0 | 26315 | 2 |
| C | 0 | 25596 | 2 |
| D | 0 | 27238 | 2 |
| Mode M9 | |||
|---|---|---|---|
| Quadrant | BADHDUFLAG | Total packets | Discarded packets |
| A | 0 | 14 | 0 |
| B | 0 | 14 | 0 |
| C | 0 | 14 | 0 |
| D | 0 | 14 | 0 |
| Mode SS | |||
|---|---|---|---|
| Quadrant | BADHDUFLAG | Total packets | Discarded packets |
| A | 0 | 254 | 0 |
| B | 0 | 254 | 0 |
| C | 0 | 254 | 0 |
| D | 0 | 254 | 0 |
| Quadrant | Total seconds | Saturated seconds | Saturation percentage |
|---|---|---|---|
| A | 12533 | 370 | 2.952206% |
| B | 12533 | 97 | 0.773957% |
| C | 12533 | 103 | 0.821830% |
| D | 12533 | 122 | 0.973430% |
Noise dominated data is calculated using 1-second bins in cleaned event files. If a bin has >2000 counts, and if more than 50% of those come from <1% of pixels, then it is considered to be noise-dominated and hence unusable.
| Quadrant | # 1 sec bins | Bins with >0 counts | Bins with >2000 counts | High rate bins dominated by noise | Noise dominated (total time) | Noise dominated (detector-on time) | Marked lightcurve |
|---|---|---|---|---|---|---|---|
| A | 13924 | 12536 | 199 | 199 | 1.43% | 1.59% | 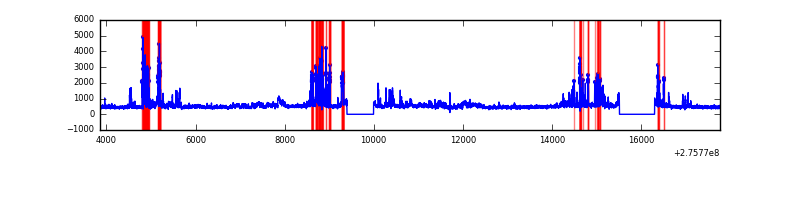 |
| B | 13924 | 12536 | 3 | 3 | 0.02% | 0.02% | 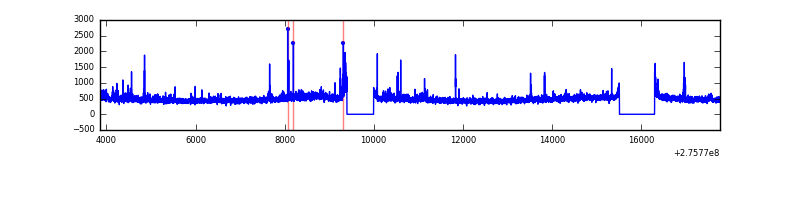 |
| C | 13924 | 12536 | 0 | 0 | 0.00% | 0.00% | 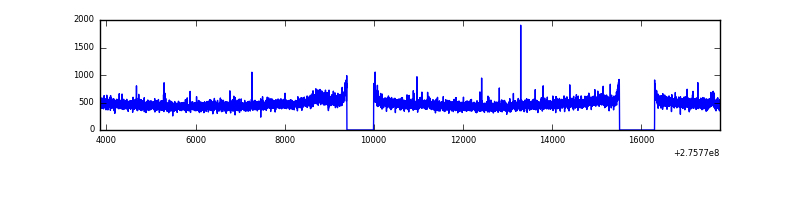 |
| D | 13924 | 12536 | 75 | 75 | 0.54% | 0.60% | 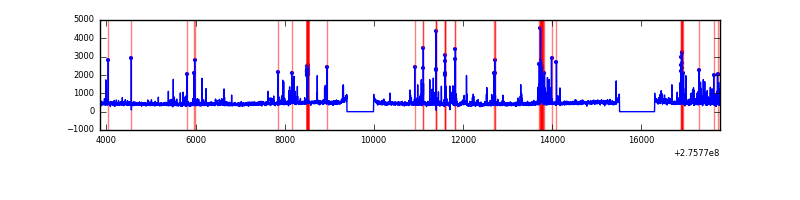 |
Top three noisy pixels from each quadrant. If the there are fewer than three noisy pixels in the level2.evt file, extra rows are filled as -1
| Pixel properties | Quadrant properties | ||||||
|---|---|---|---|---|---|---|---|
| Quadrant | DetID | PixID | Counts | Sigma | Mean | Median | Sigma |
| A | 15 | 174 | 1234787 | 4177.66 | 1466 | 1433 | 295.2 |
| A | 8 | 247 | 311356 | 1049.78 | 1466 | 1433 | 295.2 |
| A | 0 | 253 | 248813 | 837.93 | 1466 | 1433 | 295.2 |
| B | 0 | 198 | 77238 | 269.63 | 1476 | 1438 | 281.1 |
| B | 0 | 219 | 64529 | 224.42 | 1476 | 1438 | 281.1 |
| B | 3 | 64 | 43692 | 150.3 | 1476 | 1438 | 281.1 |
| C | 14 | 238 | 218279 | 653.68 | 1418 | 1425 | 331.7 |
| C | 7 | 247 | 110136 | 327.7 | 1418 | 1425 | 331.7 |
| C | 0 | 207 | 26402 | 75.29 | 1418 | 1425 | 331.7 |
| D | 2 | 233 | 458861 | 1307.65 | 1441 | 1396 | 349.8 |
| D | 1 | 52 | 99464 | 280.32 | 1441 | 1396 | 349.8 |
| D | 15 | 0 | 83950 | 235.98 | 1441 | 1396 | 349.8 |
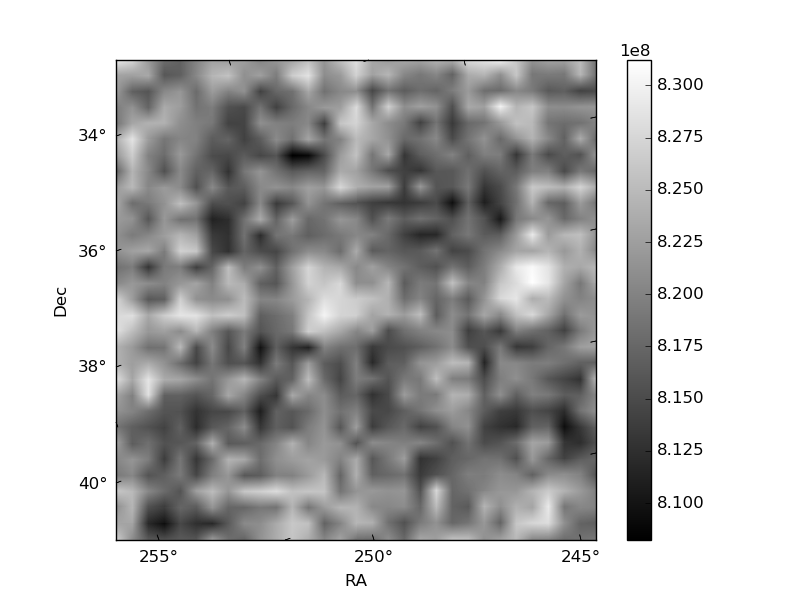
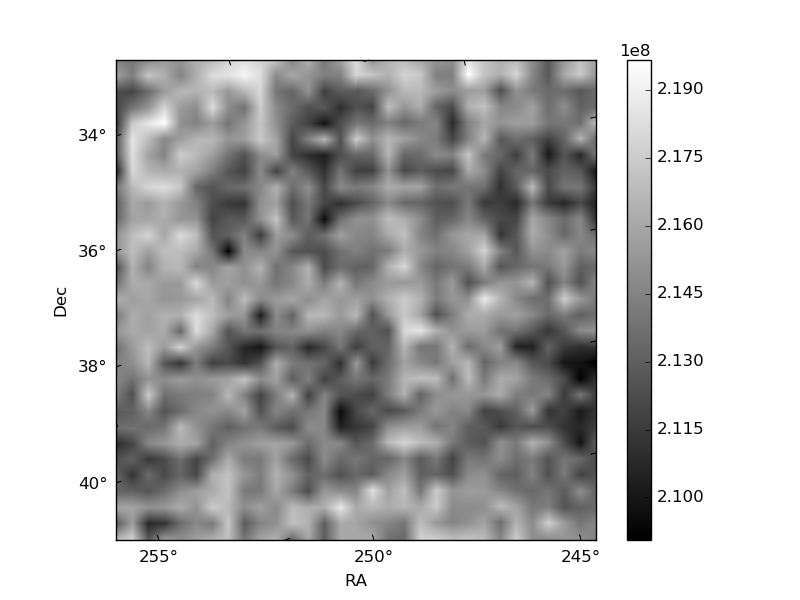
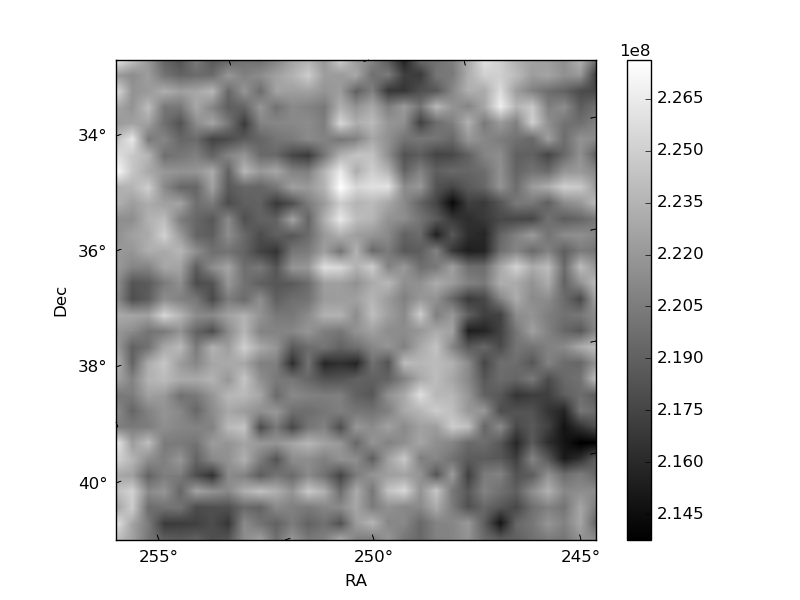
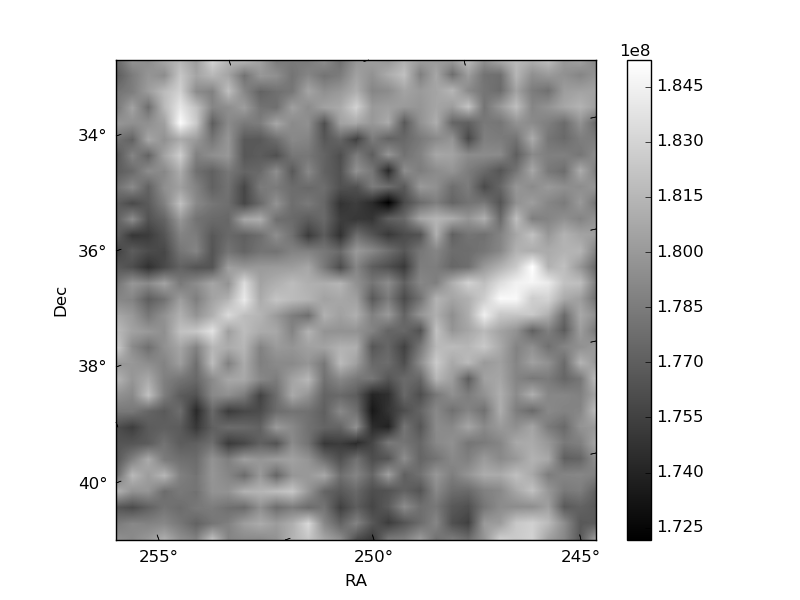
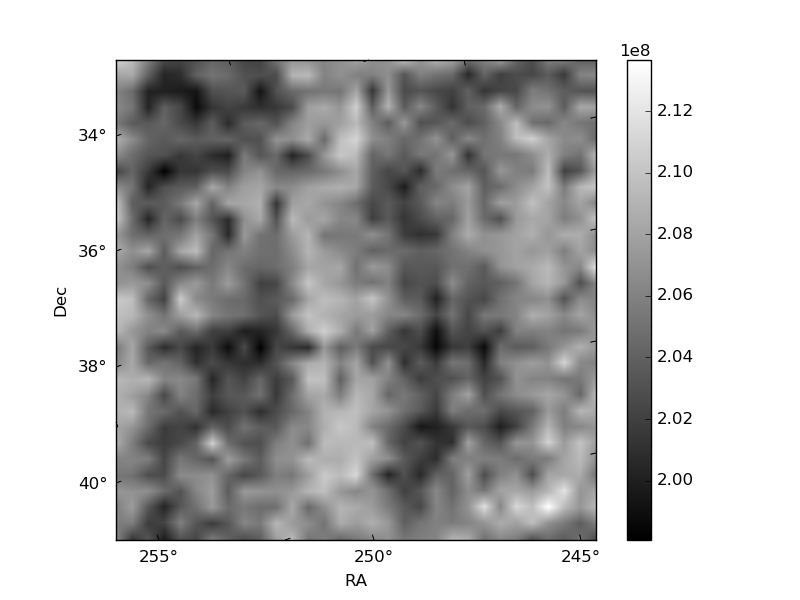
Histogram calculated using DETX and DETY for each event in the final _common_clean file
| Quadrant A | 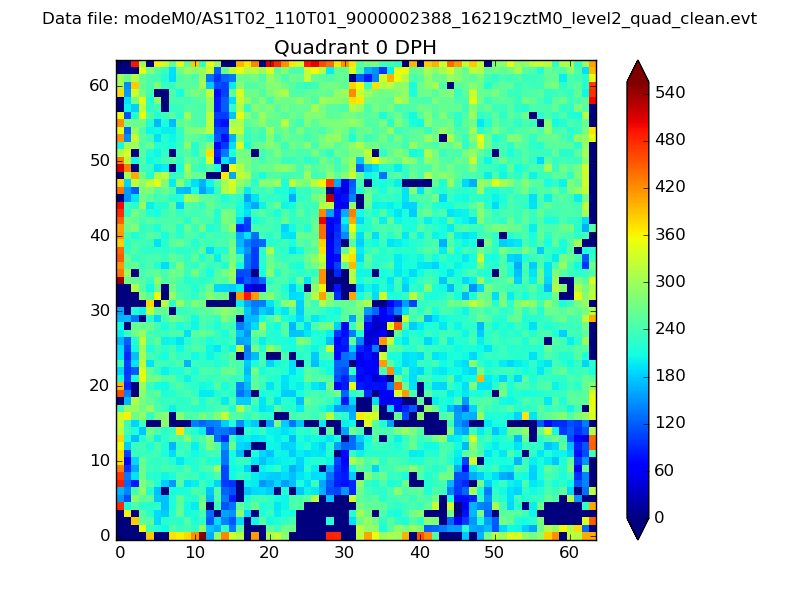 |
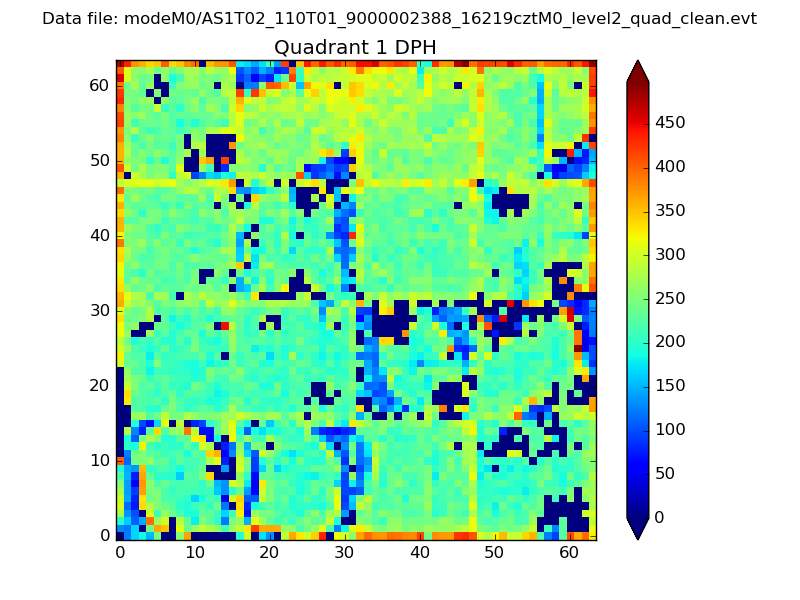 |
Quadrant B |
|---|---|---|---|
| Quadrant D | 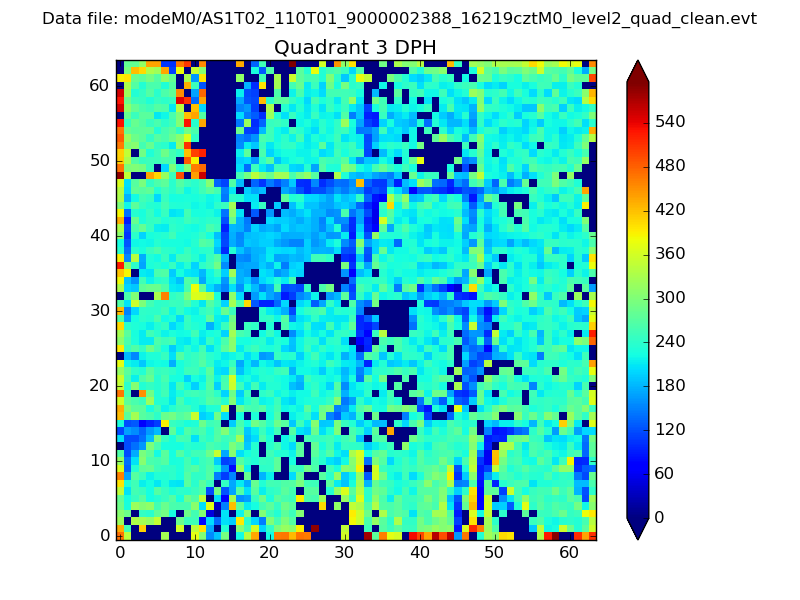 |
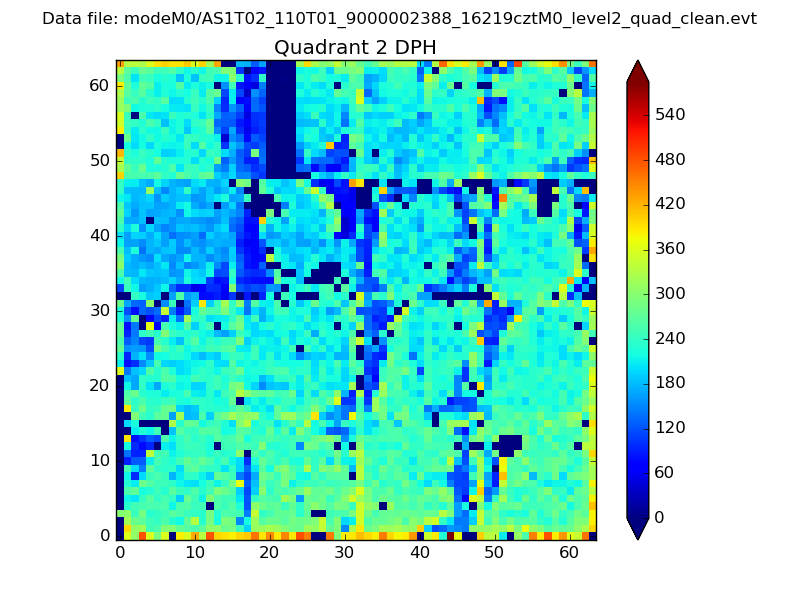 |
Quadrant C |
| Plot type | Count rate plots | Images |
|---|---|---|
| Comparison with Poisson distribution Blue bars denote a histogram of data divided into 1 sec bins. Red curve is a Poisson curve with rate = median count rate of data. |
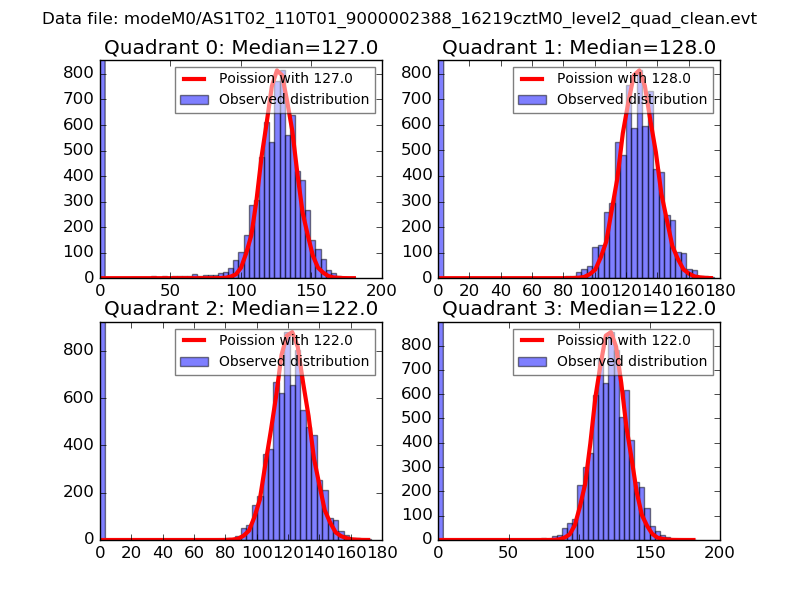 |
 |
| Quadrant-wise count rates Data is divided into 100 sec bins |
 |
|
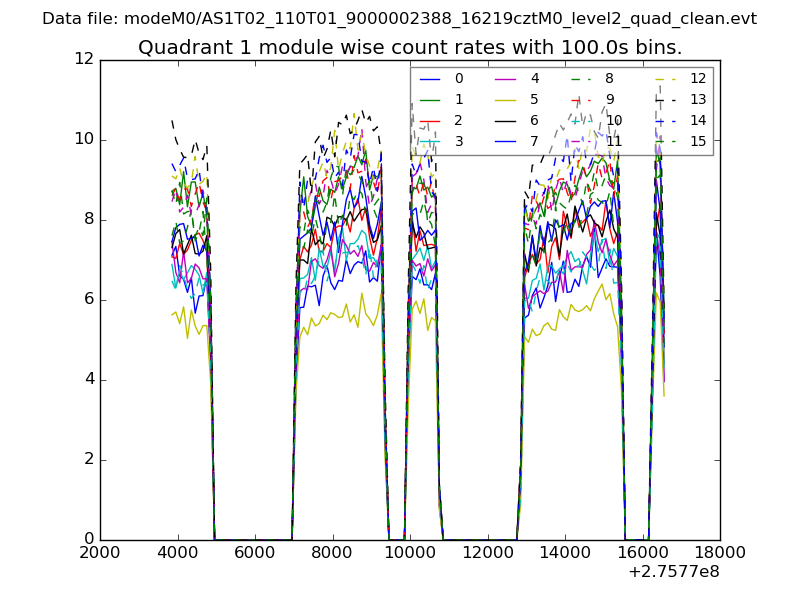
| Module-wise count rates for Quadrant A Data is divided into 100 sec bins |
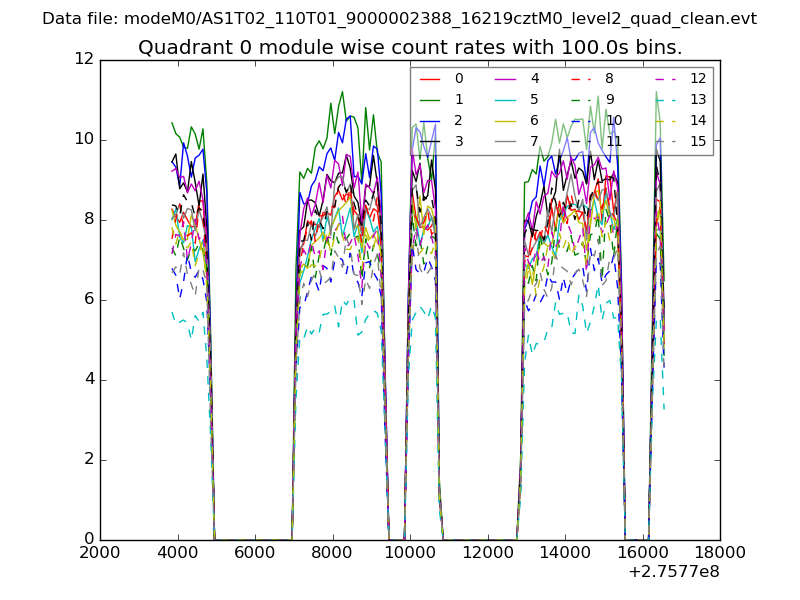 |
 |
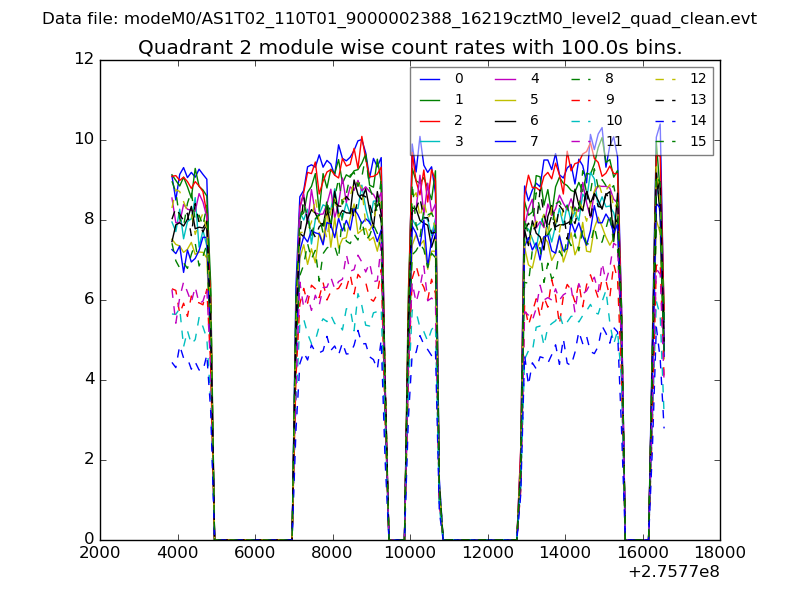
| Module-wise count rates for Quadrant B Data is divided into 100 sec bins |
 |
 |
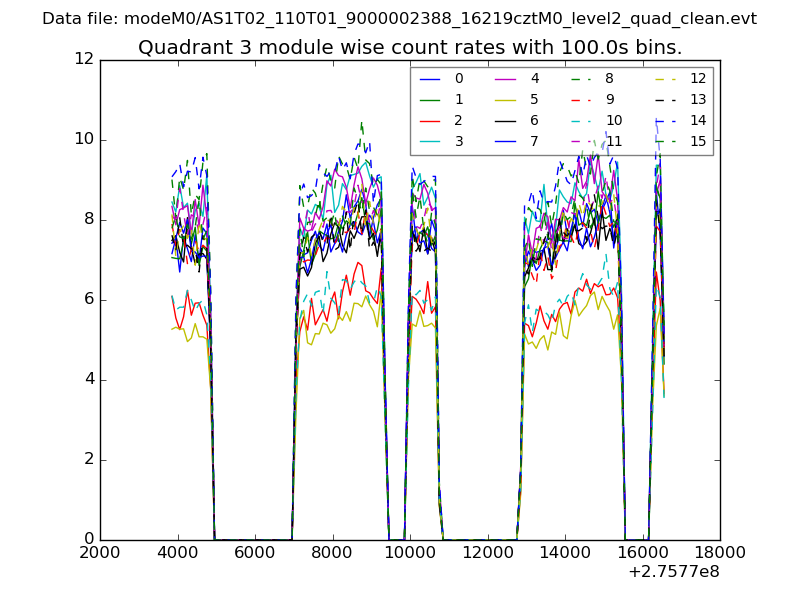
| Module-wise count rates for Quadrant C Data is divided into 100 sec bins |
 |
 |
| Module-wise count rates for Quadrant D Data is divided into 100 sec bins |
 |
 |
| Parameter | Plot |
|---|---|
| CZT HV Monitor | 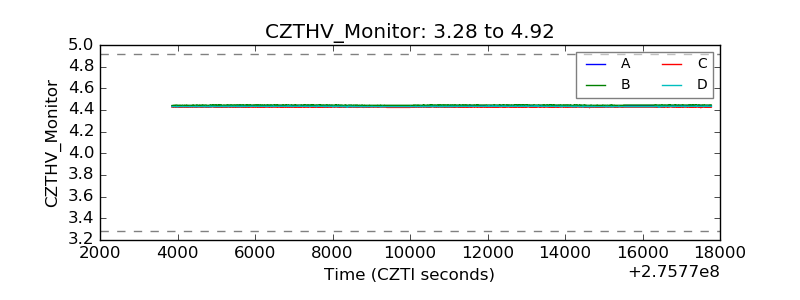 |
| D_VDD | 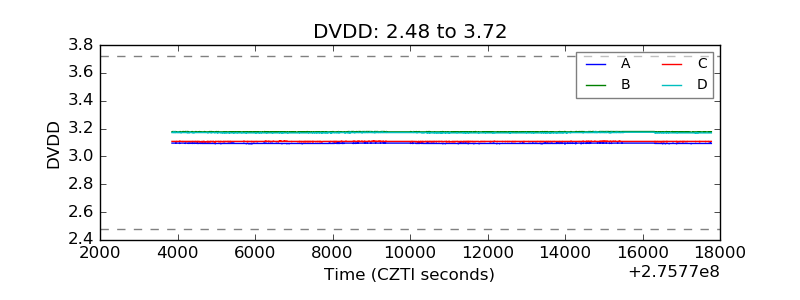 |
| Temperature 1 | 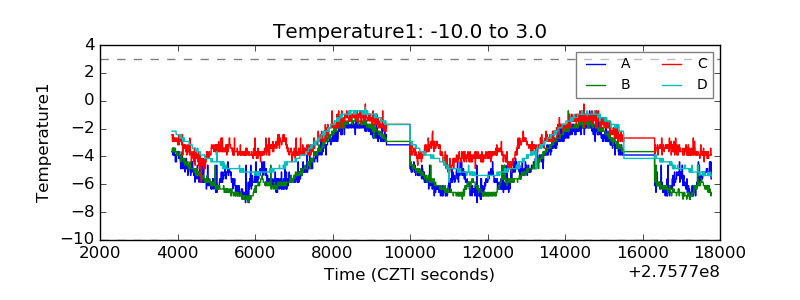 |
| Veto HV Monitor | 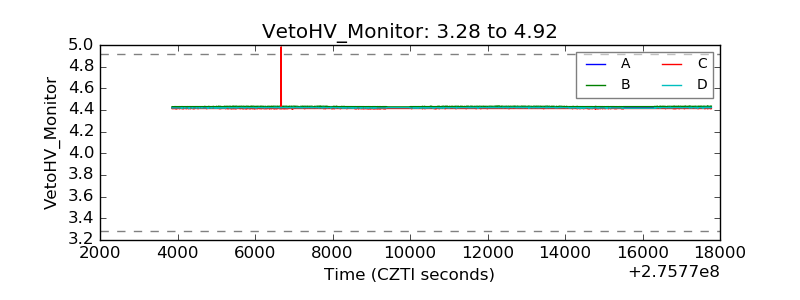 |
| Veto LLD | 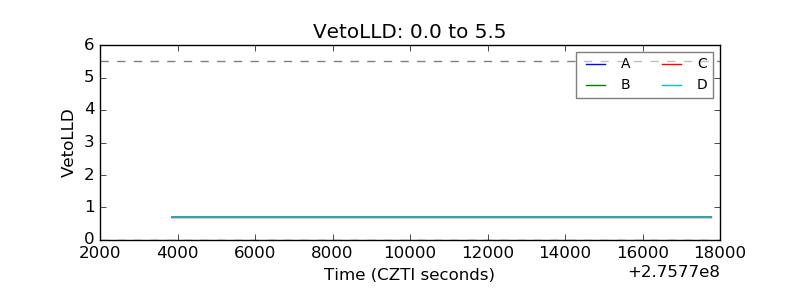 |
| Alpha Counter |  |
| _CPM_Rate | 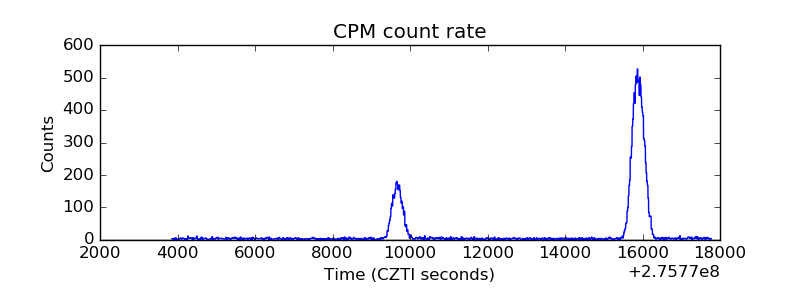 |
| CZT Counter | 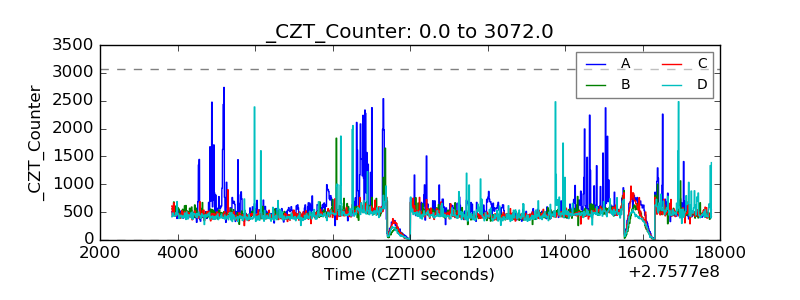 |
| +2.5 Volts monitor |  |
| +5 Volts monitor |  |
| _ROLL_ROT |  |
| _Roll_DEC | 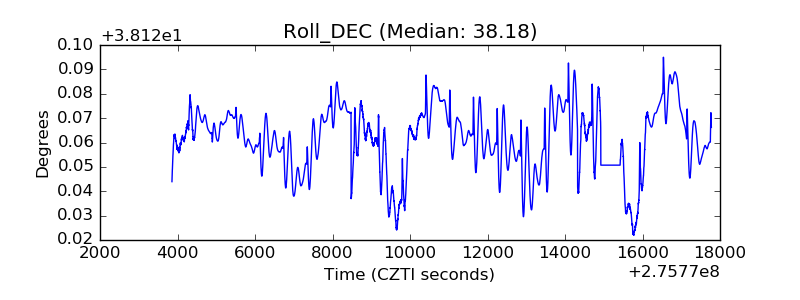 |
| _Roll_RA | 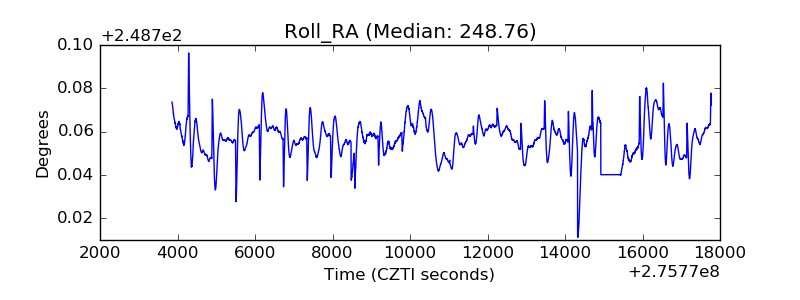 |
| Veto Counter | 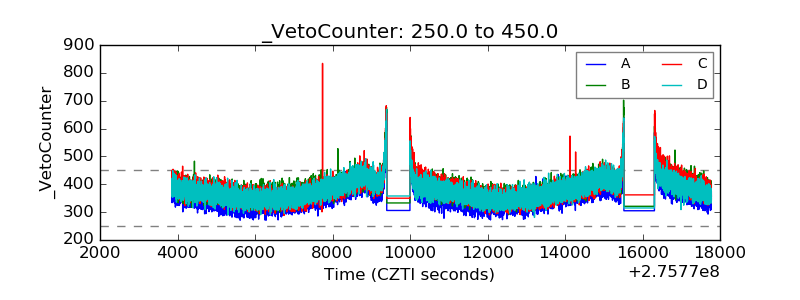 |