| Param | Original file | Final file |
|---|---|---|
| Filename | modeM0/AS1T02_112T01_9000002390cztM0_level2.fits | modeM0/AS1T02_112T01_9000002390cztM0_level2_quad_clean.evt |
| Size (bytes) | 2,268,457,920 | 2,168,665,920 |
| Size | 2.1 GB | 2.0 GB |
| Events in quadrant A | 13,864,890 | 12,740,292 |
| Events in quadrant B | 13,263,760 | 12,762,677 |
| Events in quadrant C | 13,726,778 | 12,747,522 |
| Events in quadrant D | 12,099,496 | 11,687,358 |
| Mode SS | |||
|---|---|---|---|
| Quadrant | BADHDUFLAG | Total packets | Discarded packets |
| A | 0 | 4686 | 0 |
| B | 0 | 4686 | 0 |
| C | 0 | 4686 | 0 |
| D | 0 | 4686 | 0 |
| Mode M9 | |||
|---|---|---|---|
| Quadrant | BADHDUFLAG | Total packets | Discarded packets |
| A | 0 | 356 | 0 |
| B | 0 | 356 | 0 |
| C | 0 | 356 | 0 |
| D | 0 | 357 | 0 |
| Mode M0 | |||
|---|---|---|---|
| Quadrant | BADHDUFLAG | Total packets | Discarded packets |
| A | 0 | 549461 | 0 |
| B | 0 | 558411 | 0 |
| C | 0 | 501282 | 0 |
| D | 0 | 529571 | 0 |
| Quadrant | Total seconds | Saturated seconds | Saturation percentage |
|---|---|---|---|
| A | 229802 | 8104 | 3.526514% |
| B | 229807 | 6980 | 3.037331% |
| C | 229809 | 3787 | 1.647890% |
| D | 229807 | 4547 | 1.978617% |
Noise dominated data is calculated using 1-second bins in cleaned event files. If a bin has >2000 counts, and if more than 50% of those come from <1% of pixels, then it is considered to be noise-dominated and hence unusable.
| Quadrant | # 1 sec bins | Bins with >0 counts | Bins with >2000 counts | High rate bins dominated by noise | Noise dominated (total time) | Noise dominated (detector-on time) | Marked lightcurve |
|---|---|---|---|---|---|---|---|
| A | 267551 | 229641 | 0 | 0 | 0.00% | 0.00% | 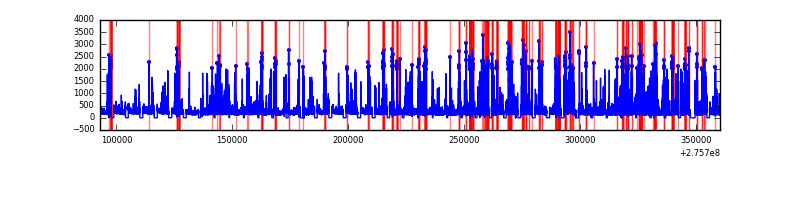 |
| B | 267551 | 229743 | 0 | 0 | 0.00% | 0.00% | 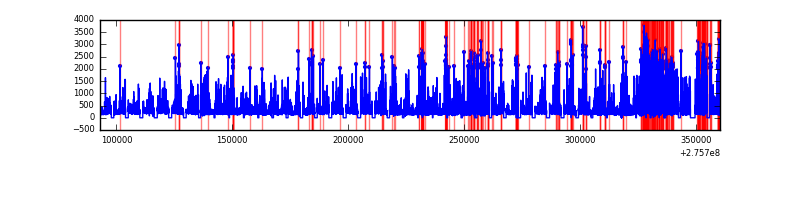 |
| C | 267551 | 229812 | 0 | 0 | 0.00% | 0.00% | 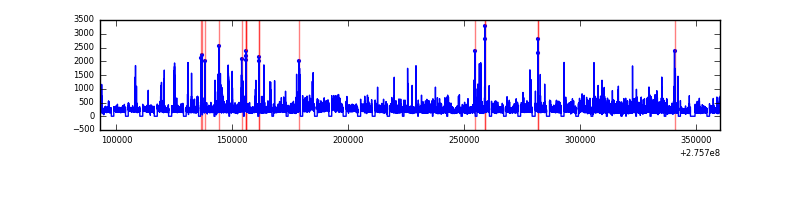 |
| D | 267551 | 229757 | 0 | 0 | 0.00% | 0.00% | 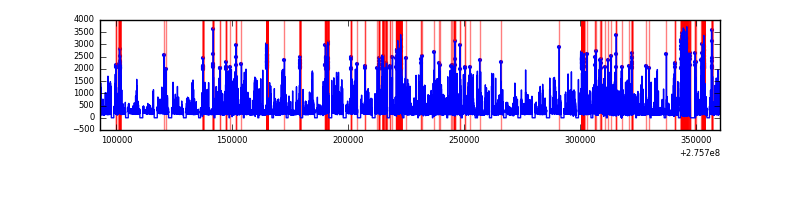 |
Top three noisy pixels from each quadrant. If the there are fewer than three noisy pixels in the level2.evt file, extra rows are filled as -1
| Pixel properties | Quadrant properties | ||||||
|---|---|---|---|---|---|---|---|
| Quadrant | DetID | PixID | Counts | Sigma | Mean | Median | Sigma |
| A | 0 | 29 | 13377 | 11.34 | 3620 | 3396 | 880.3 |
| A | 7 | 110 | 11018 | 8.66 | 3620 | 3396 | 880.3 |
| A | 0 | 30 | 10742 | 8.34 | 3620 | 3396 | 880.3 |
| B | 2 | 9 | 10842 | 11.14 | 3517 | 3368 | 671.0 |
| B | 2 | 8 | 9135 | 8.59 | 3517 | 3368 | 671.0 |
| B | 5 | 128 | 8711 | 7.96 | 3517 | 3368 | 671.0 |
| C | 12 | 241 | 9340 | 6.43 | 3630 | 3394 | 925.1 |
| C | 3 | 126 | 9297 | 6.38 | 3630 | 3394 | 925.1 |
| C | 2 | 191 | 8987 | 6.05 | 3630 | 3394 | 925.1 |
| D | 6 | 231 | 8997 | 6.43 | 3453 | 3148 | 909.9 |
| D | 3 | 14 | 8710 | 6.11 | 3453 | 3148 | 909.9 |
| D | 10 | 189 | 8708 | 6.11 | 3453 | 3148 | 909.9 |
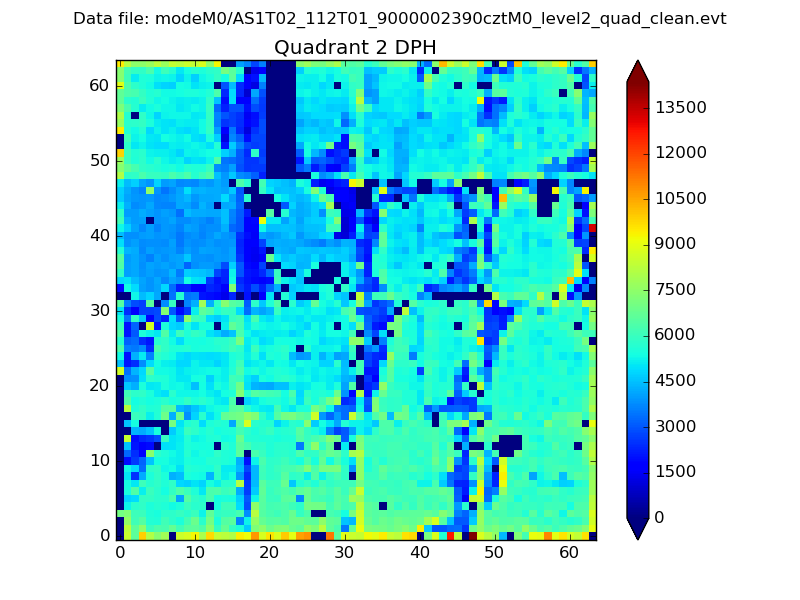
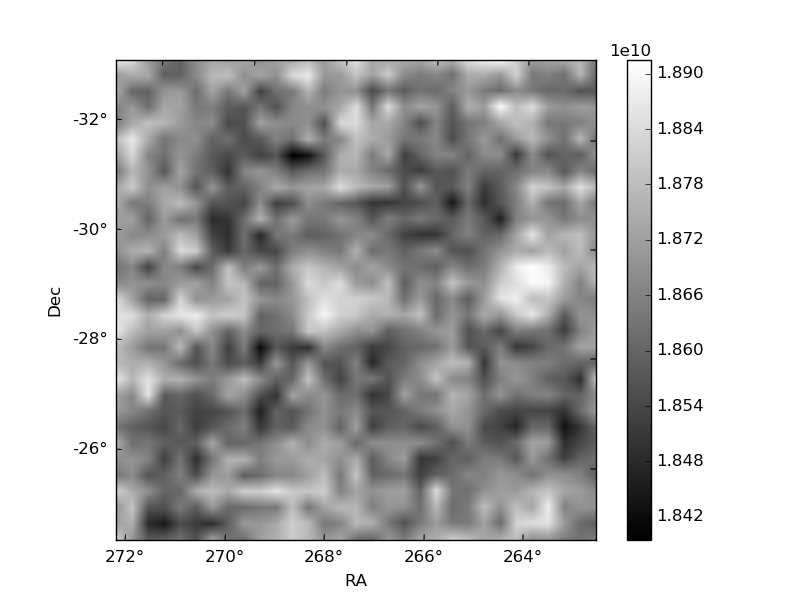
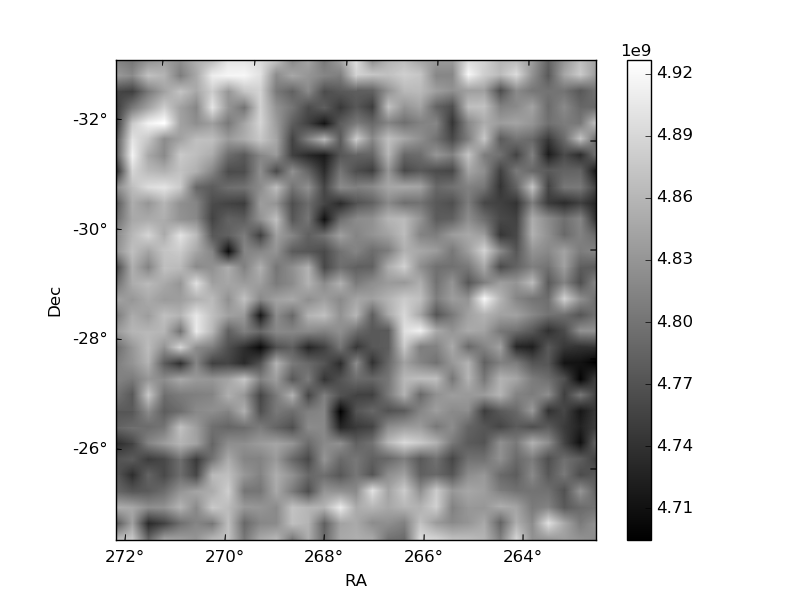
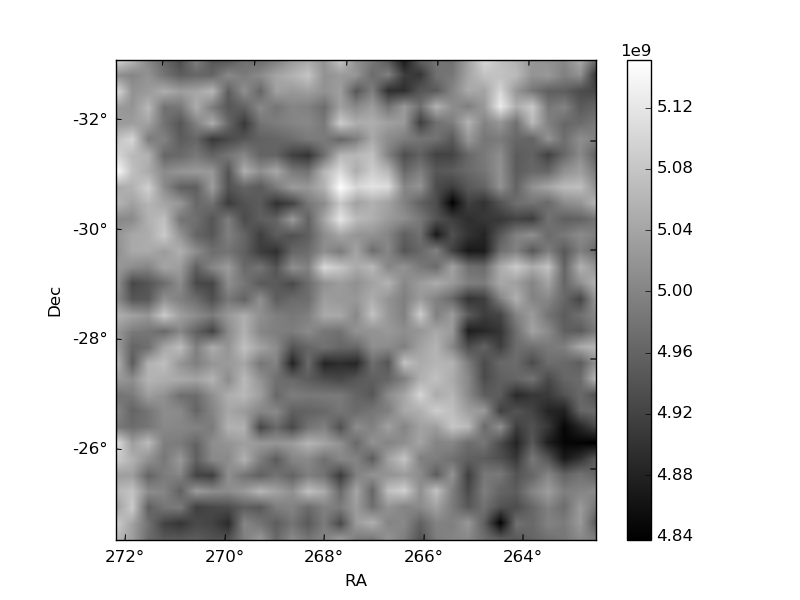
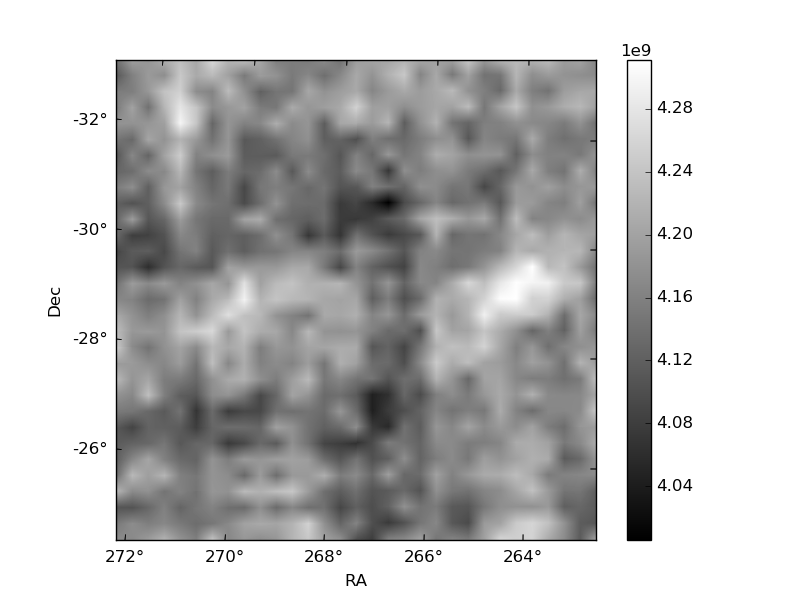
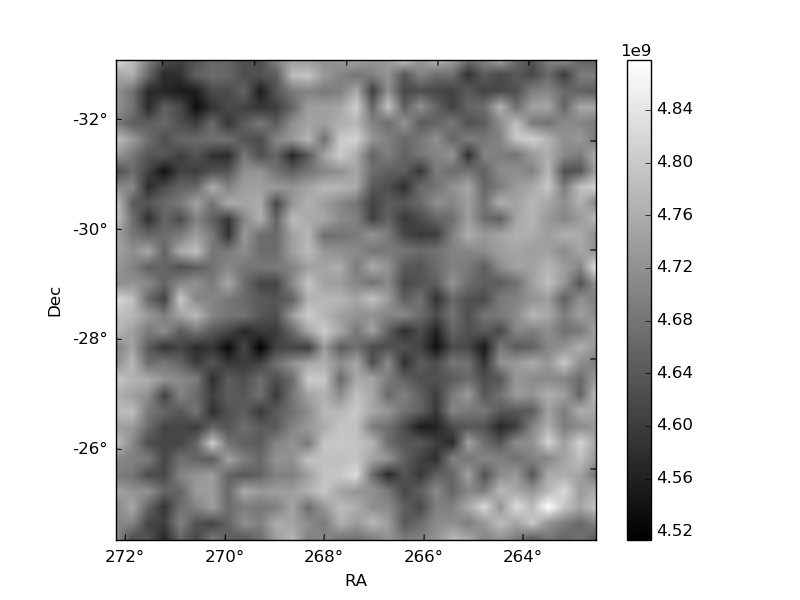
Histogram calculated using DETX and DETY for each event in the final _common_clean file
| Quadrant A | 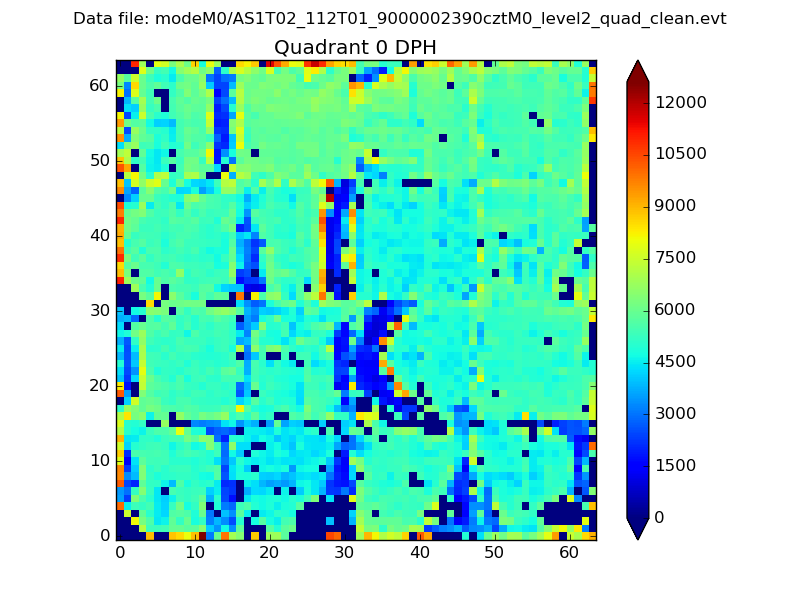 |
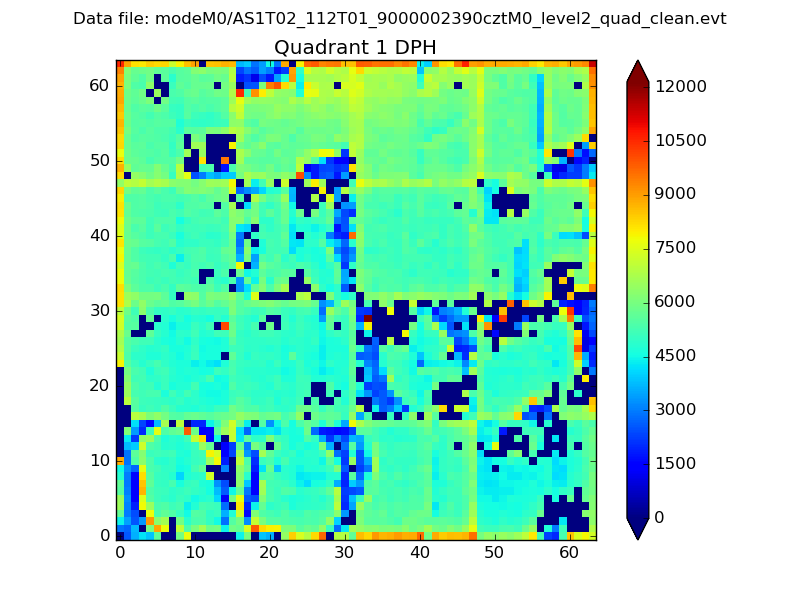 |
Quadrant B |
|---|---|---|---|
| Quadrant D | 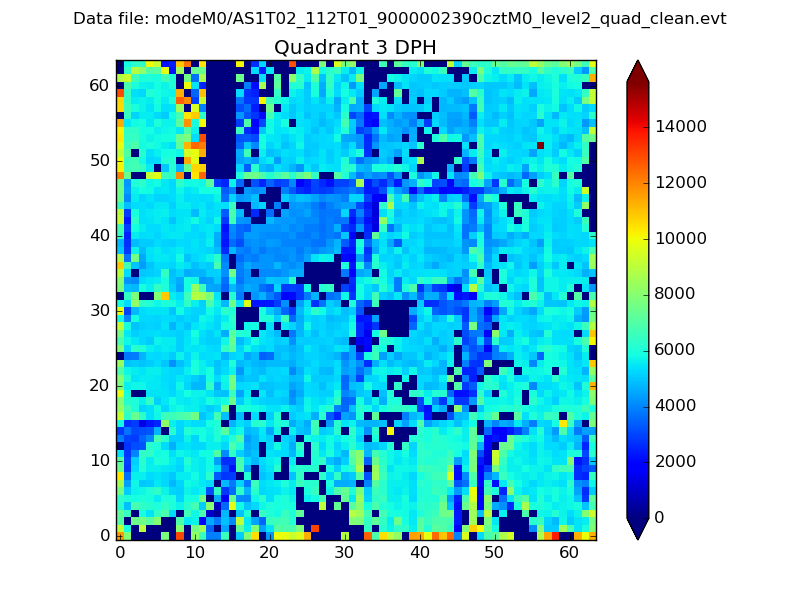 |
 |
Quadrant C |
| Plot type | Count rate plots | Images |
|---|---|---|
| Comparison with Poisson distribution Blue bars denote a histogram of data divided into 1 sec bins. Red curve is a Poisson curve with rate = median count rate of data. |
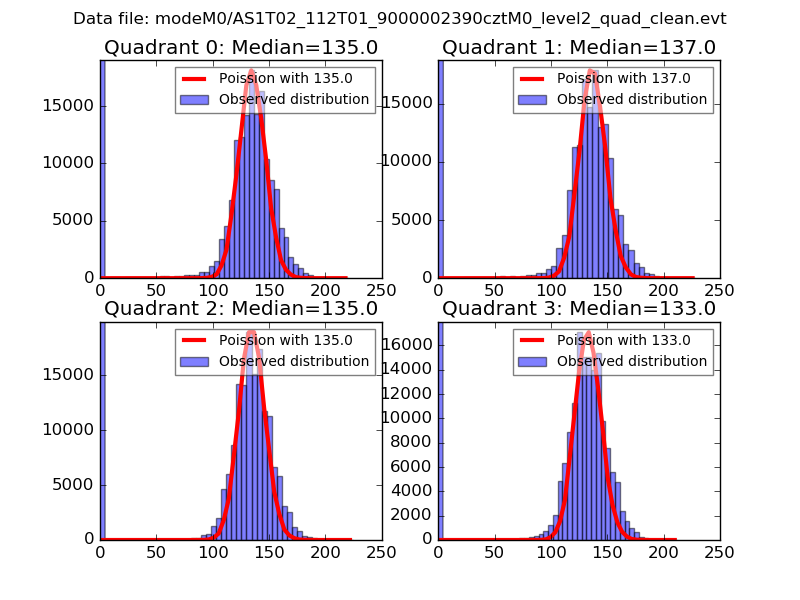 |
 |
| Quadrant-wise count rates Data is divided into 100 sec bins |
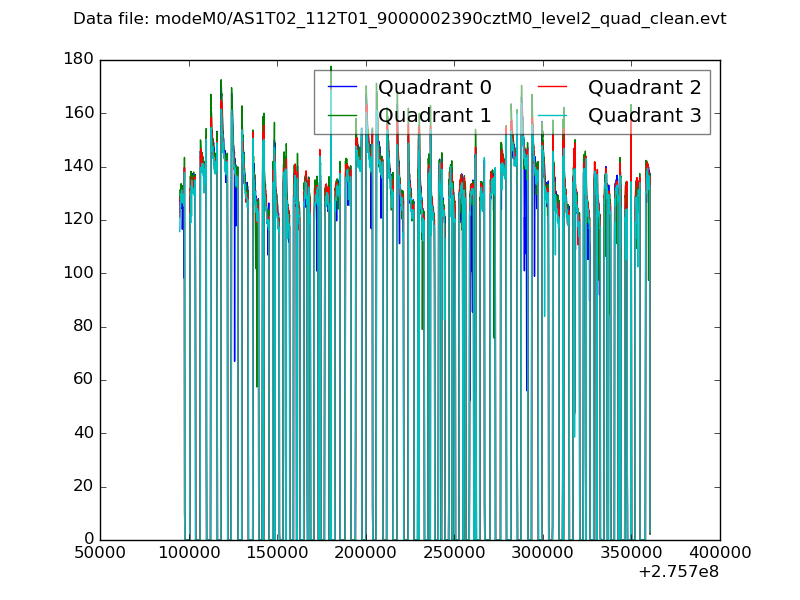 |
|
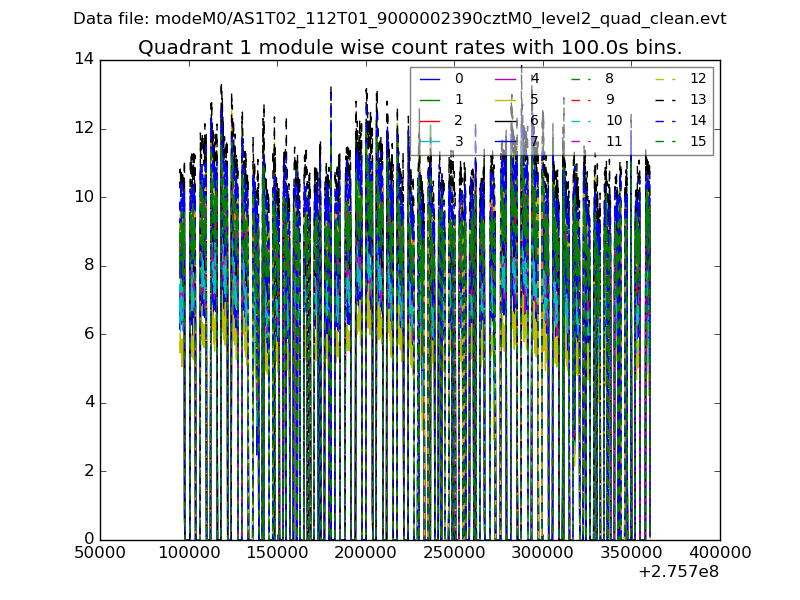
| Module-wise count rates for Quadrant A Data is divided into 100 sec bins |
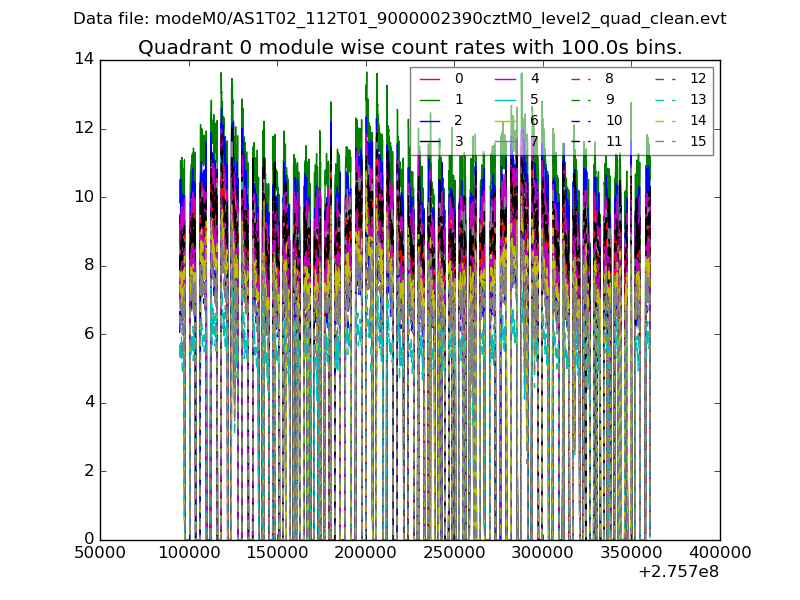 |
 |
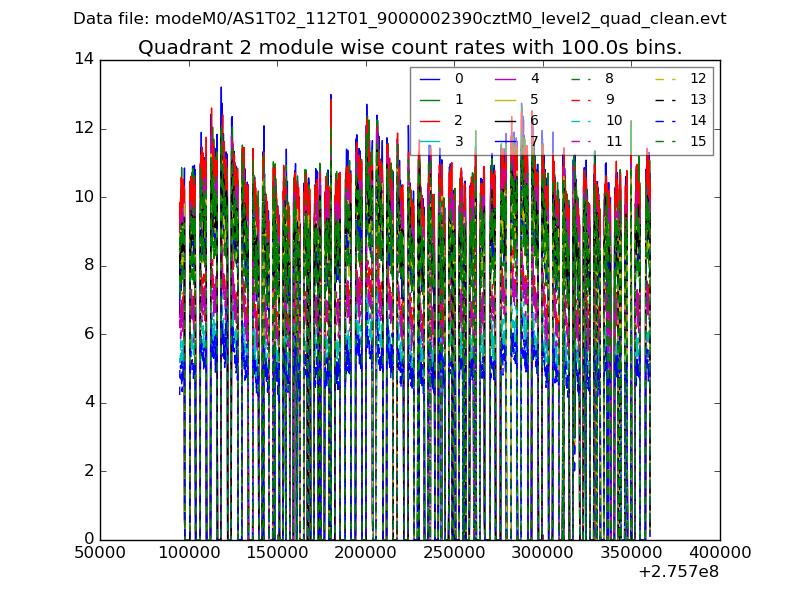
| Module-wise count rates for Quadrant B Data is divided into 100 sec bins |
 |
 |
| Module-wise count rates for Quadrant C Data is divided into 100 sec bins |
 |
 |
| Module-wise count rates for Quadrant D Data is divided into 100 sec bins |
 |
 |
| Parameter | Plot |
|---|---|
| CZT HV Monitor | 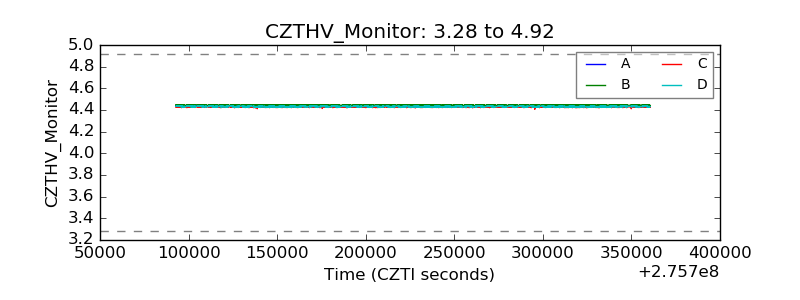 |
| D_VDD | 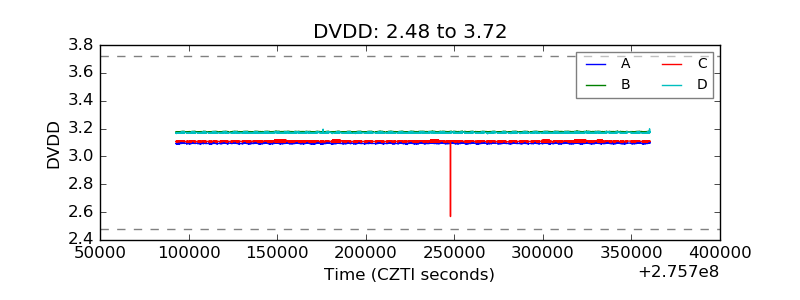 |
| Temperature 1 | 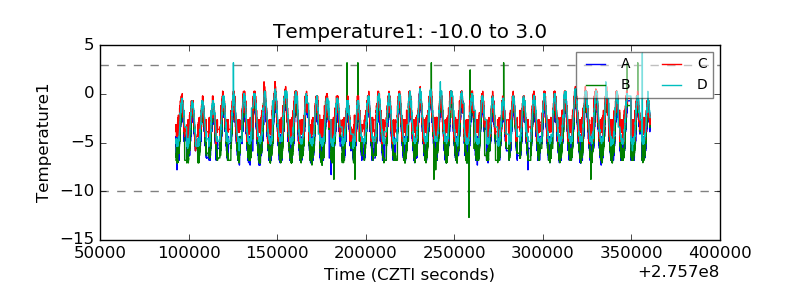 |
| Veto HV Monitor | 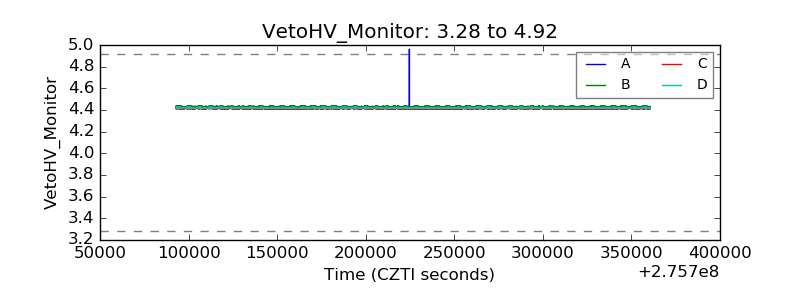 |
| Veto LLD | 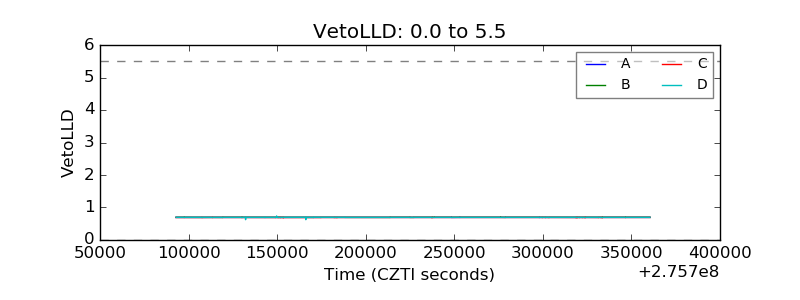 |
| Alpha Counter | 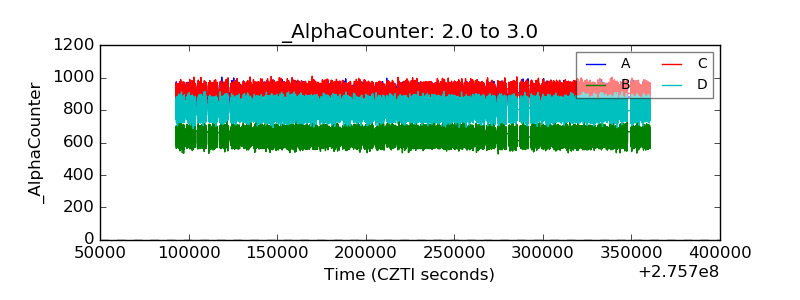 |
| _CPM_Rate | 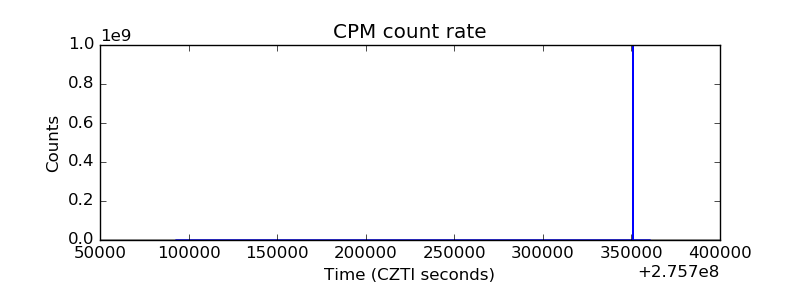 |
| CZT Counter | 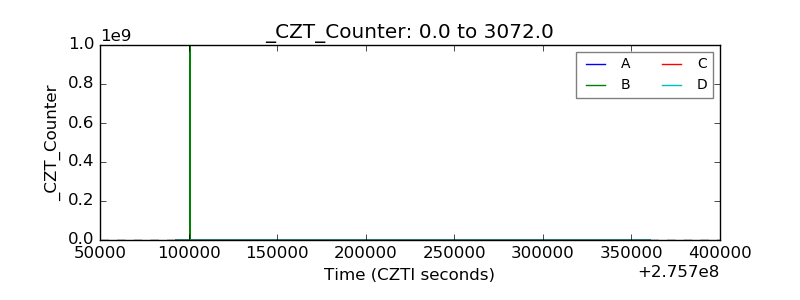 |
| +2.5 Volts monitor | 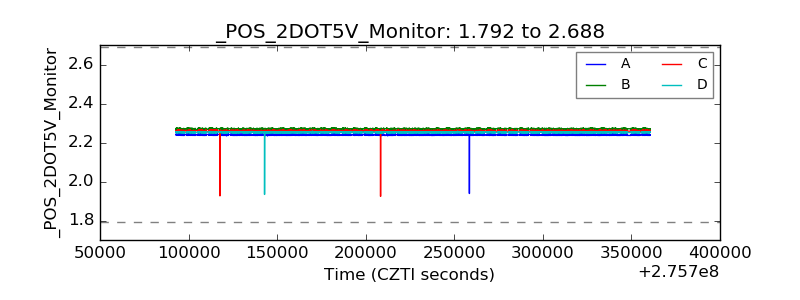 |
| +5 Volts monitor | 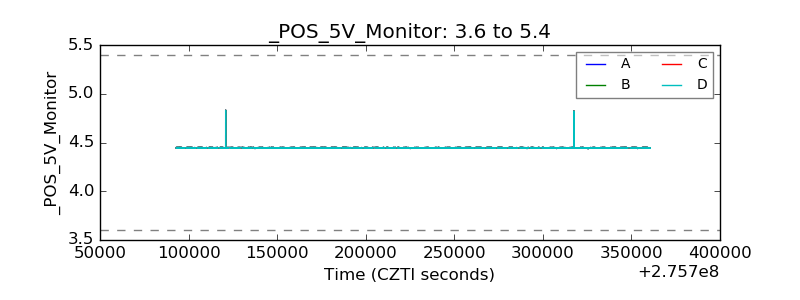 |
| _ROLL_ROT | 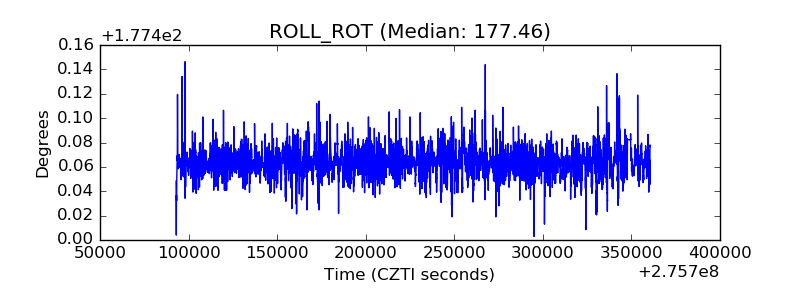 |
| _Roll_DEC | 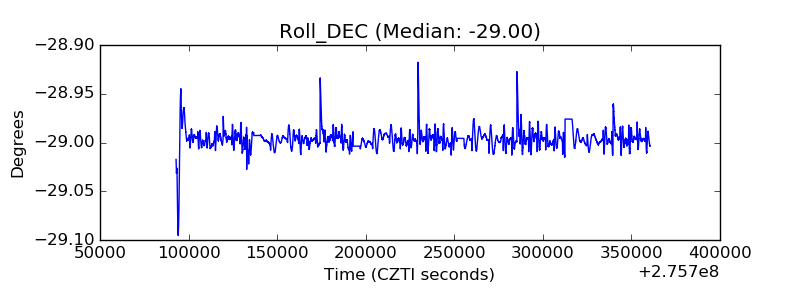 |
| _Roll_RA | 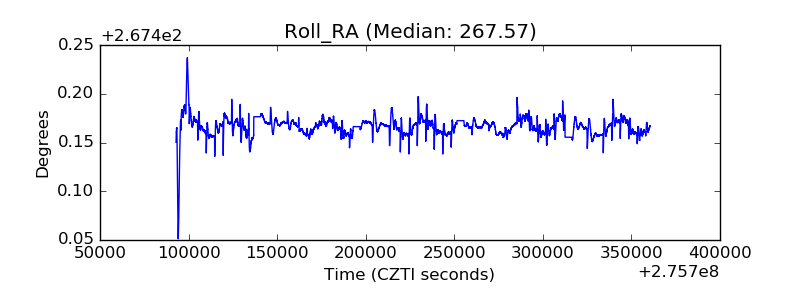 |
| Veto Counter | 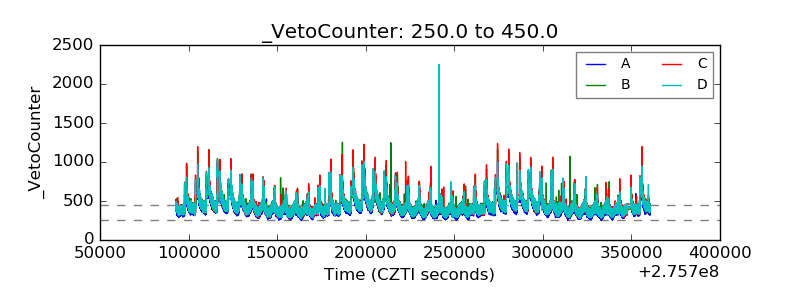 |