| Param | Original file | Final file |
|---|---|---|
| Filename | modeM0/AS1T02_112T01_9000002390_16221cztM0_level2.evt | modeM0/AS1T02_112T01_9000002390_16221cztM0_level2_quad_clean.evt |
| Size (bytes) | 452,900,160 | 61,992,000 |
| Size | 431.9 MB | 59.1 MB |
| Events in quadrant A | 3,839,485 | 354,134 |
| Events in quadrant B | 3,235,690 | 371,131 |
| Events in quadrant C | 3,076,292 | 362,484 |
| Events in quadrant D | 3,143,556 | 356,374 |
| Mode SS | |||
|---|---|---|---|
| Quadrant | BADHDUFLAG | Total packets | Discarded packets |
| A | 0 | 126 | 0 |
| B | 0 | 126 | 0 |
| C | 0 | 126 | 0 |
| D | 0 | 126 | 0 |
| Mode M9 | |||
|---|---|---|---|
| Quadrant | BADHDUFLAG | Total packets | Discarded packets |
| A | 0 | 10 | 0 |
| B | 0 | 10 | 0 |
| C | 0 | 10 | 0 |
| D | 0 | 10 | 0 |
| Mode M0 | |||
|---|---|---|---|
| Quadrant | BADHDUFLAG | Total packets | Discarded packets |
| A | 0 | 15210 | 2 |
| B | 0 | 13499 | 1 |
| C | 0 | 12858 | 1 |
| D | 0 | 13573 | 1 |
| Quadrant | Total seconds | Saturated seconds | Saturation percentage |
|---|---|---|---|
| A | 6190 | 253 | 4.087237% |
| B | 6190 | 36 | 0.581583% |
| C | 6190 | 48 | 0.775444% |
| D | 6190 | 39 | 0.630048% |
Noise dominated data is calculated using 1-second bins in cleaned event files. If a bin has >2000 counts, and if more than 50% of those come from <1% of pixels, then it is considered to be noise-dominated and hence unusable.
| Quadrant | # 1 sec bins | Bins with >0 counts | Bins with >2000 counts | High rate bins dominated by noise | Noise dominated (total time) | Noise dominated (detector-on time) | Marked lightcurve |
|---|---|---|---|---|---|---|---|
| A | 7276 | 6191 | 159 | 159 | 2.19% | 2.57% | 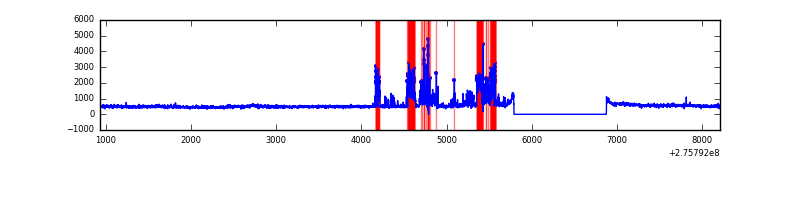 |
| B | 7276 | 6192 | 2 | 2 | 0.03% | 0.03% | 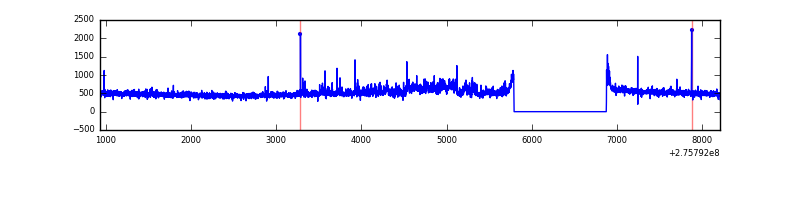 |
| C | 7276 | 6192 | 0 | 0 | 0.00% | 0.00% |  |
| D | 7276 | 6192 | 18 | 18 | 0.25% | 0.29% | 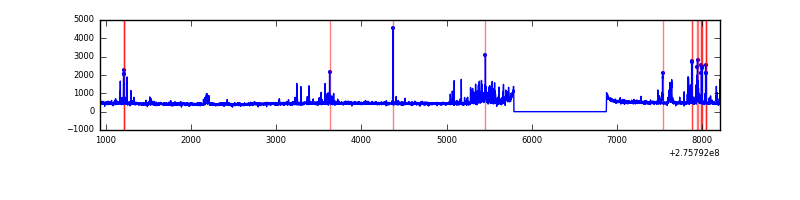 |
Top three noisy pixels from each quadrant. If the there are fewer than three noisy pixels in the level2.evt file, extra rows are filled as -1
| Pixel properties | Quadrant properties | ||||||
|---|---|---|---|---|---|---|---|
| Quadrant | DetID | PixID | Counts | Sigma | Mean | Median | Sigma |
| A | 15 | 174 | 688831 | 4494.34 | 752 | 735 | 153.1 |
| A | 0 | 253 | 149991 | 974.87 | 752 | 735 | 153.1 |
| A | 8 | 247 | 90512 | 586.38 | 752 | 735 | 153.1 |
| B | 0 | 219 | 138882 | 944.0 | 765 | 747 | 146.3 |
| B | 0 | 198 | 34721 | 232.18 | 765 | 747 | 146.3 |
| B | 12 | 111 | 16864 | 110.14 | 765 | 747 | 146.3 |
| C | 14 | 238 | 112705 | 661.58 | 730 | 735 | 169.2 |
| C | 3 | 233 | 57804 | 337.19 | 730 | 735 | 169.2 |
| C | 7 | 247 | 49411 | 287.6 | 730 | 735 | 169.2 |
| D | 13 | 112 | 112976 | 627.54 | 736 | 715 | 178.9 |
| D | 1 | 52 | 108549 | 602.8 | 736 | 715 | 178.9 |
| D | 15 | 0 | 76155 | 421.71 | 736 | 715 | 178.9 |
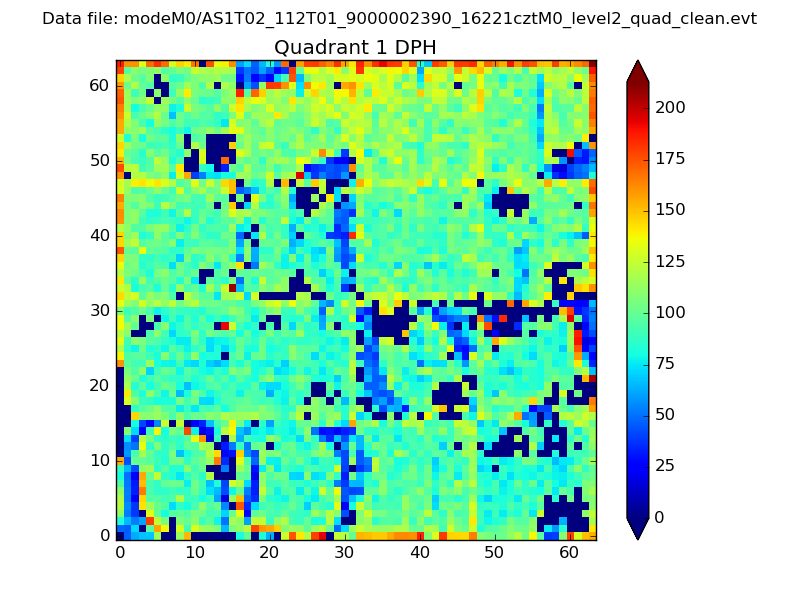
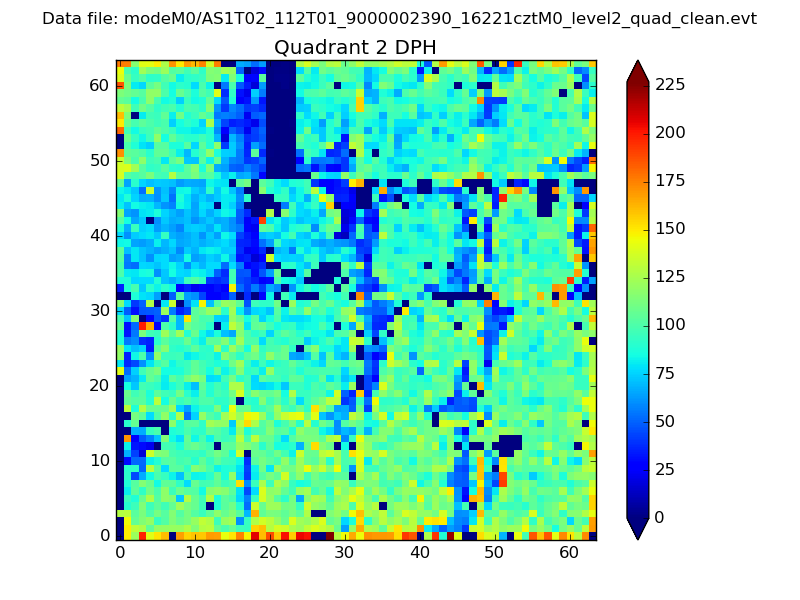
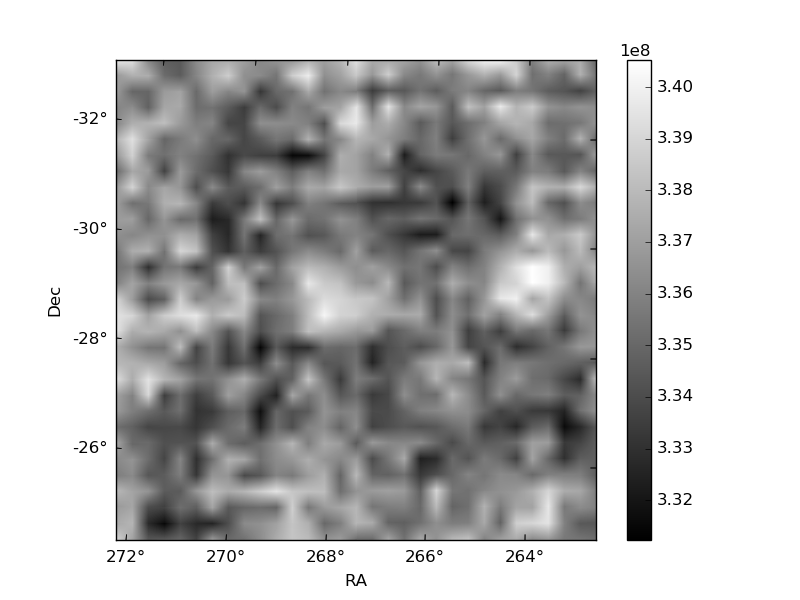
Histogram calculated using DETX and DETY for each event in the final _common_clean file
| Quadrant A | 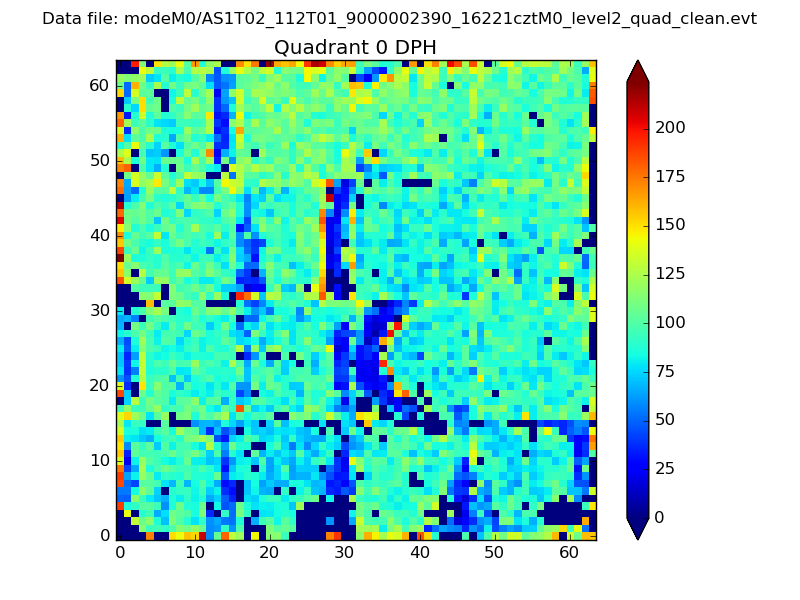 |
 |
Quadrant B |
|---|---|---|---|
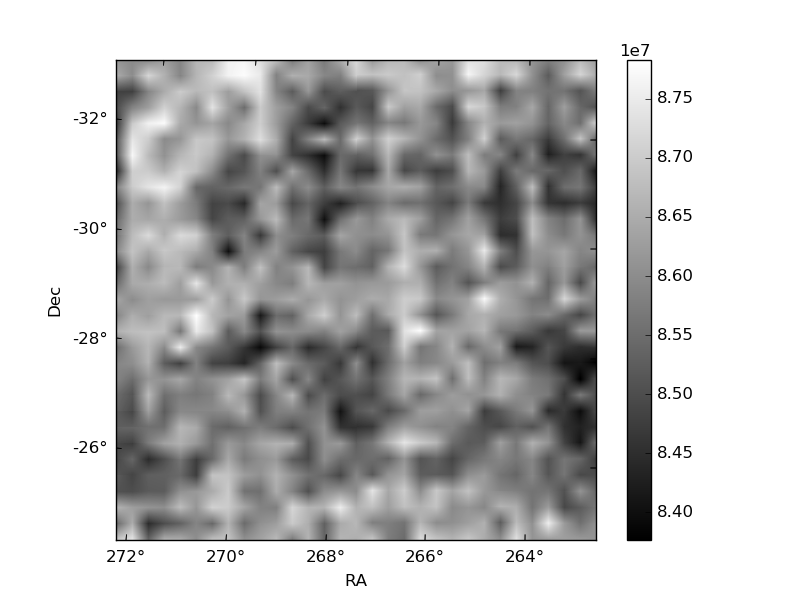
| Quadrant D | 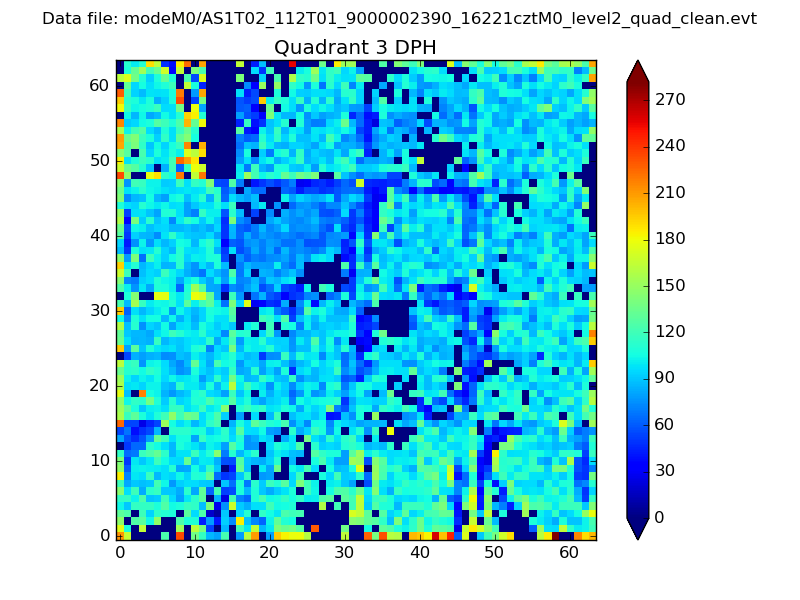 |
 |
Quadrant C |
| Plot type | Count rate plots | Images |
|---|---|---|
| Comparison with Poisson distribution Blue bars denote a histogram of data divided into 1 sec bins. Red curve is a Poisson curve with rate = median count rate of data. |
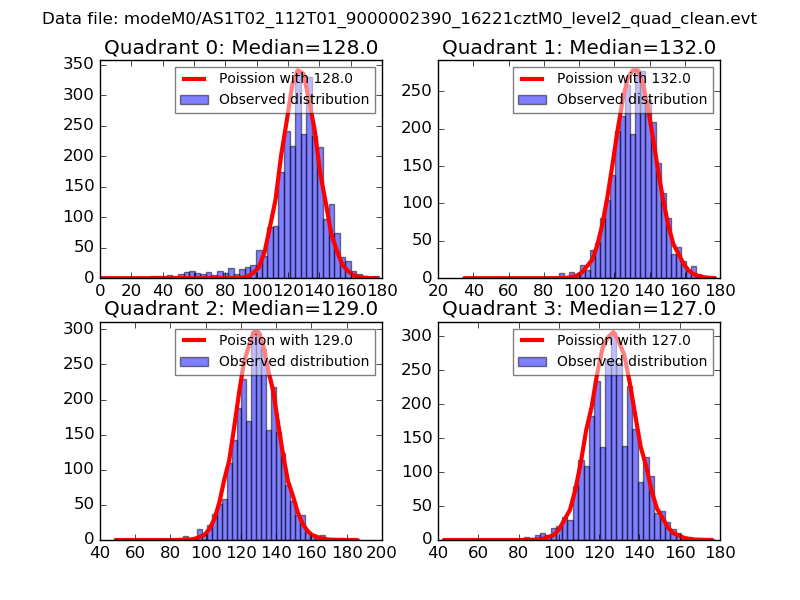 |
 |
| Quadrant-wise count rates Data is divided into 100 sec bins |
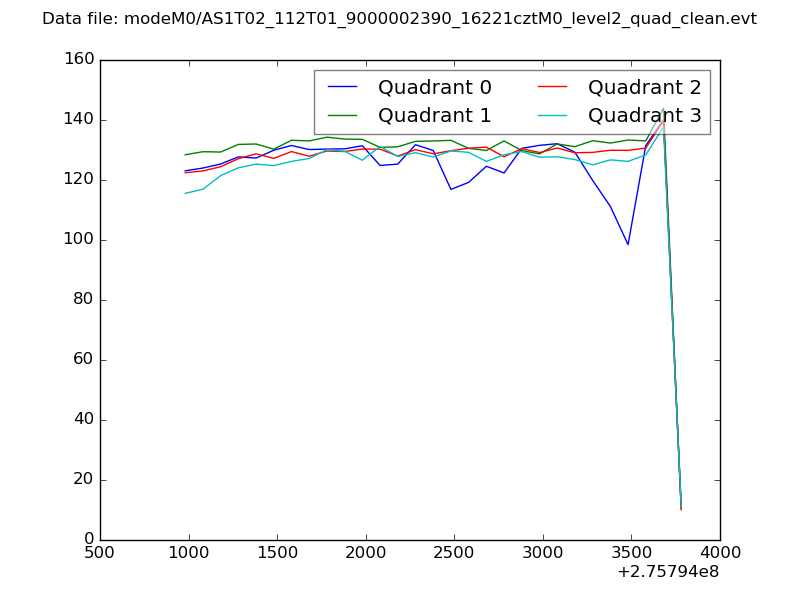 |
|
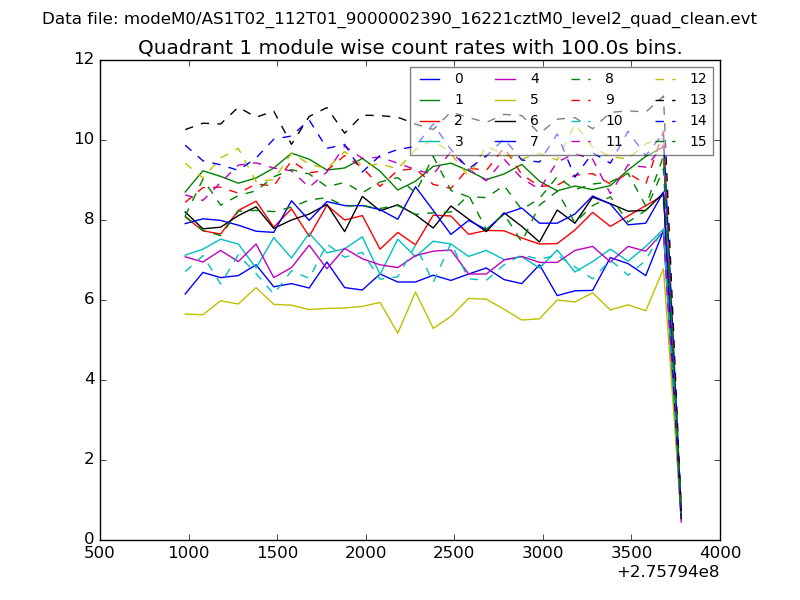
| Module-wise count rates for Quadrant A Data is divided into 100 sec bins |
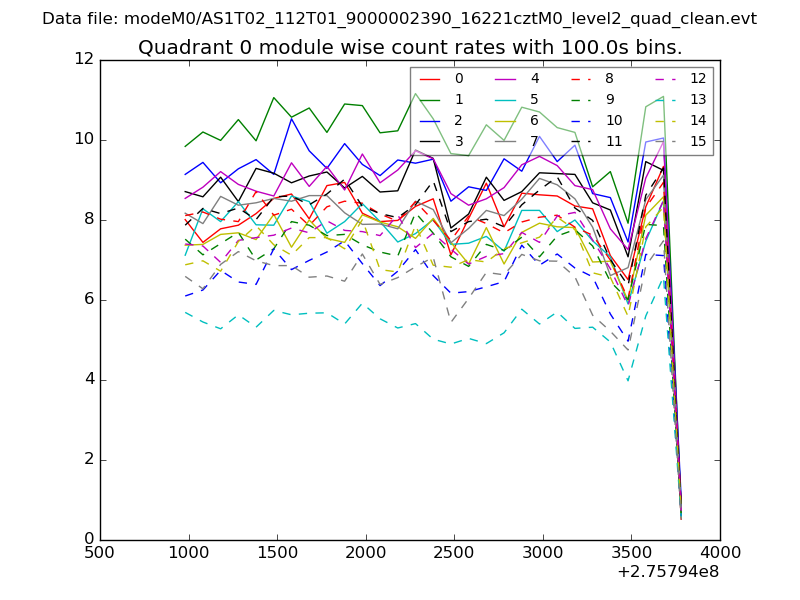 |
 |
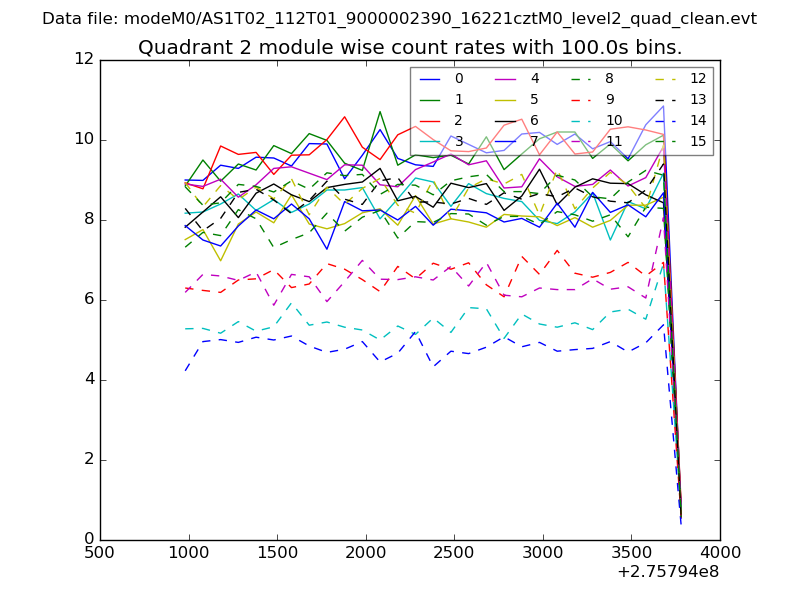
| Module-wise count rates for Quadrant B Data is divided into 100 sec bins |
 |
 |
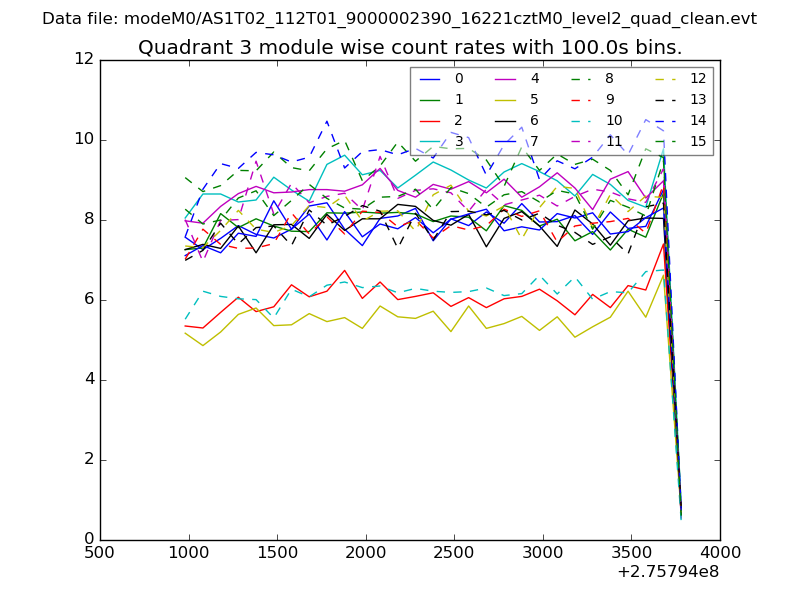
| Module-wise count rates for Quadrant C Data is divided into 100 sec bins |
 |
 |
| Module-wise count rates for Quadrant D Data is divided into 100 sec bins |
 |
 |
| Parameter | Plot |
|---|---|
| CZT HV Monitor | 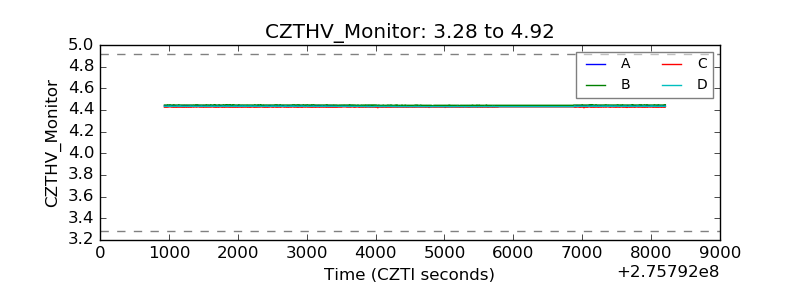 |
| D_VDD | 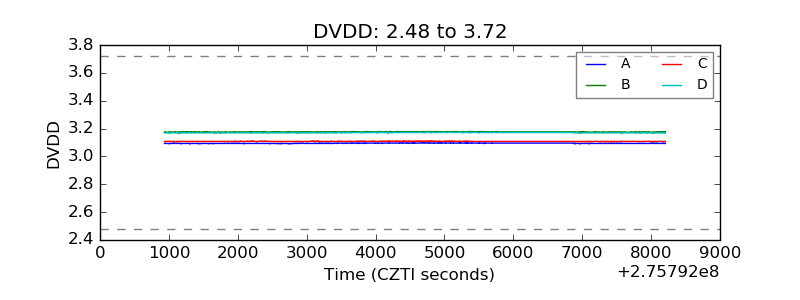 |
| Temperature 1 | 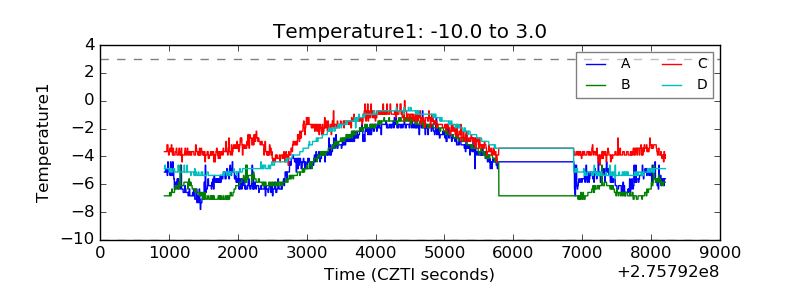 |
| Veto HV Monitor | 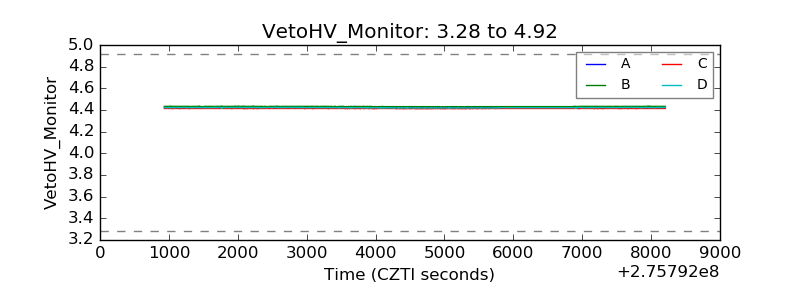 |
| Veto LLD | 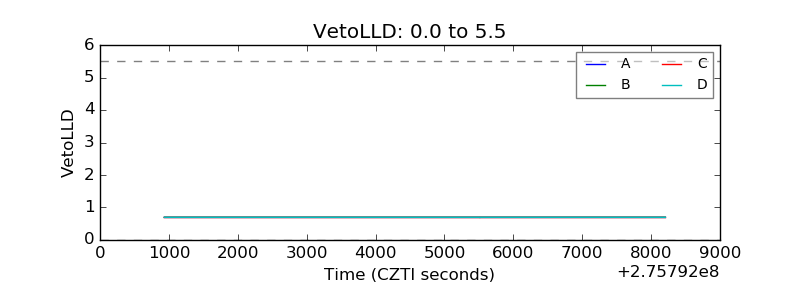 |
| Alpha Counter | 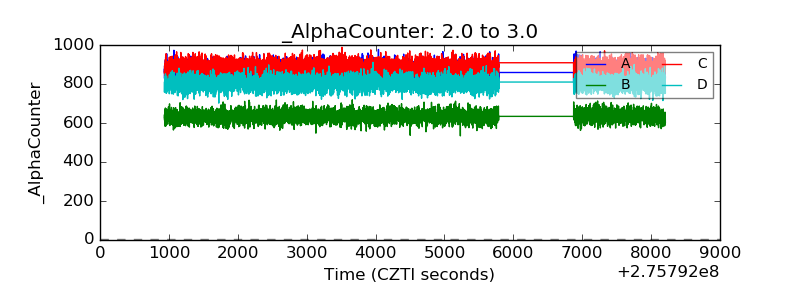 |
| _CPM_Rate | 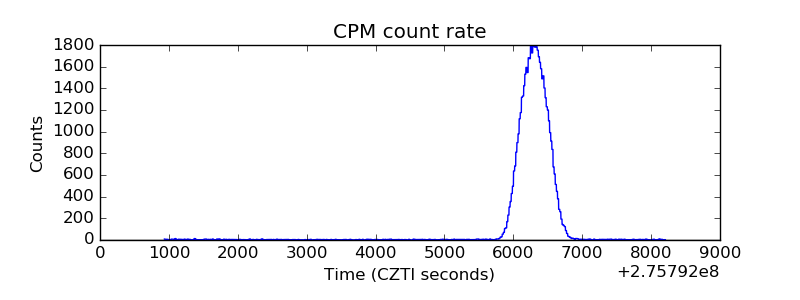 |
| CZT Counter | 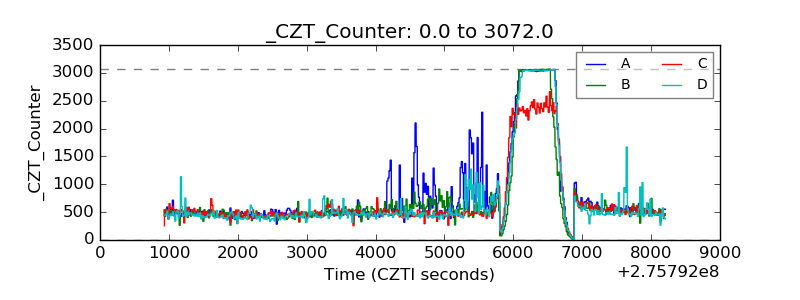 |
| +2.5 Volts monitor |  |
| +5 Volts monitor | 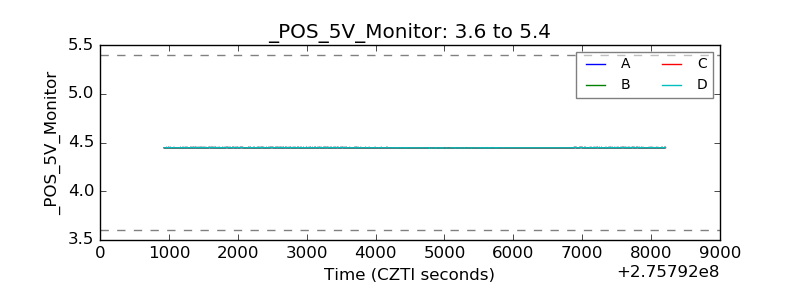 |
| _ROLL_ROT | 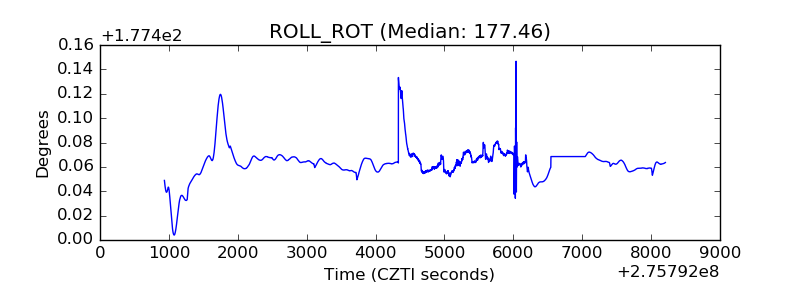 |
| _Roll_DEC | 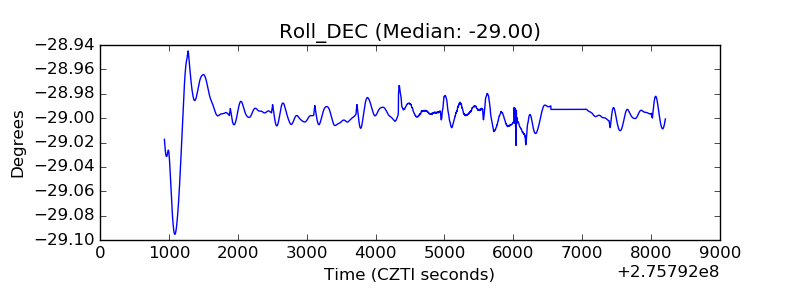 |
| _Roll_RA | 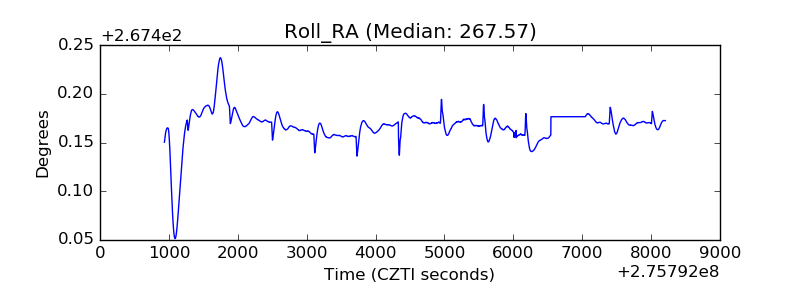 |
| Veto Counter | 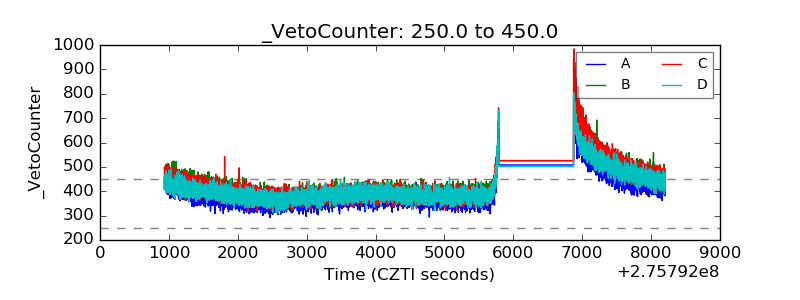 |