| Param | Original file | Final file |
|---|---|---|
| Filename | modeM0/AS1T02_112T01_9000002390_16223cztM0_level2.evt | modeM0/AS1T02_112T01_9000002390_16223cztM0_level2_quad_clean.evt |
| Size (bytes) | 451,344,960 | 69,016,320 |
| Size | 430.4 MB | 65.8 MB |
| Events in quadrant A | 3,335,823 | 418,161 |
| Events in quadrant B | 3,309,839 | 424,939 |
| Events in quadrant C | 3,122,881 | 417,026 |
| Events in quadrant D | 3,487,631 | 405,008 |
| Mode SS | |||
|---|---|---|---|
| Quadrant | BADHDUFLAG | Total packets | Discarded packets |
| A | 0 | 124 | 0 |
| B | 0 | 124 | 0 |
| C | 0 | 124 | 0 |
| D | 0 | 124 | 0 |
| Mode M9 | |||
|---|---|---|---|
| Quadrant | BADHDUFLAG | Total packets | Discarded packets |
| A | 0 | 12 | 0 |
| B | 0 | 12 | 0 |
| C | 0 | 12 | 0 |
| D | 0 | 12 | 0 |
| Mode M0 | |||
|---|---|---|---|
| Quadrant | BADHDUFLAG | Total packets | Discarded packets |
| A | 0 | 13651 | 2 |
| B | 0 | 13517 | 1 |
| C | 0 | 12943 | 1 |
| D | 0 | 14321 | 1 |
| Quadrant | Total seconds | Saturated seconds | Saturation percentage |
|---|---|---|---|
| A | 6078 | 45 | 0.740375% |
| B | 6078 | 73 | 1.201053% |
| C | 6078 | 79 | 1.299770% |
| D | 6078 | 100 | 1.645278% |
Noise dominated data is calculated using 1-second bins in cleaned event files. If a bin has >2000 counts, and if more than 50% of those come from <1% of pixels, then it is considered to be noise-dominated and hence unusable.
| Quadrant | # 1 sec bins | Bins with >0 counts | Bins with >2000 counts | High rate bins dominated by noise | Noise dominated (total time) | Noise dominated (detector-on time) | Marked lightcurve |
|---|---|---|---|---|---|---|---|
| A | 7264 | 6080 | 0 | 0 | 0.00% | 0.00% | 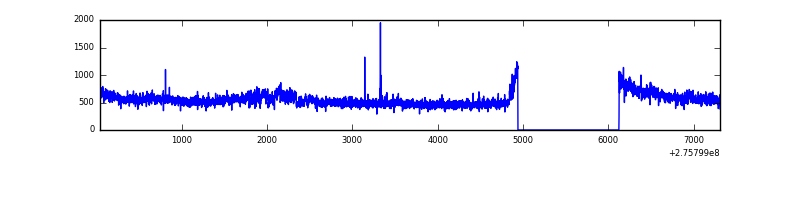 |
| B | 7264 | 6080 | 14 | 14 | 0.19% | 0.23% | 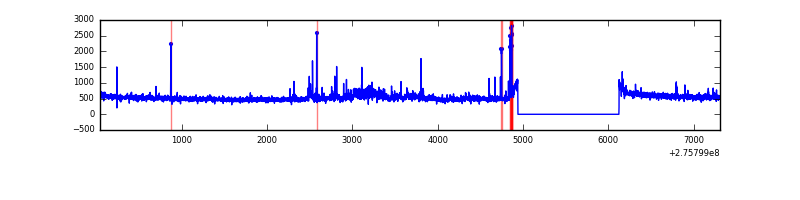 |
| C | 7264 | 6080 | 0 | 0 | 0.00% | 0.00% | 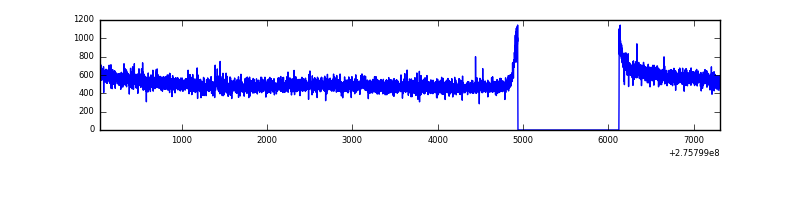 |
| D | 7264 | 6080 | 73 | 73 | 1.00% | 1.20% | 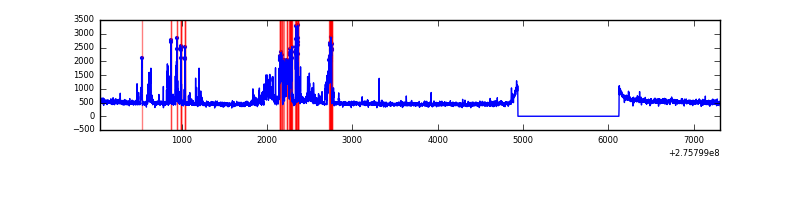 |
Top three noisy pixels from each quadrant. If the there are fewer than three noisy pixels in the level2.evt file, extra rows are filled as -1
| Pixel properties | Quadrant properties | ||||||
|---|---|---|---|---|---|---|---|
| Quadrant | DetID | PixID | Counts | Sigma | Mean | Median | Sigma |
| A | 0 | 253 | 202752 | 1284.59 | 787 | 774 | 157.2 |
| A | 8 | 247 | 83924 | 528.84 | 787 | 774 | 157.2 |
| A | 15 | 239 | 9583 | 56.03 | 787 | 774 | 157.2 |
| B | 0 | 219 | 74566 | 497.78 | 788 | 769 | 148.3 |
| B | 0 | 198 | 51334 | 341.08 | 788 | 769 | 148.3 |
| B | 0 | 189 | 51089 | 339.42 | 788 | 769 | 148.3 |
| C | 14 | 238 | 118281 | 673.23 | 757 | 764 | 174.6 |
| C | 7 | 247 | 28226 | 157.32 | 757 | 764 | 174.6 |
| C | 3 | 233 | 26868 | 149.54 | 757 | 764 | 174.6 |
| D | 15 | 0 | 470896 | 2561.77 | 763 | 744 | 183.5 |
| D | 13 | 112 | 118173 | 639.85 | 763 | 744 | 183.5 |
| D | 2 | 234 | 21666 | 114.0 | 763 | 744 | 183.5 |
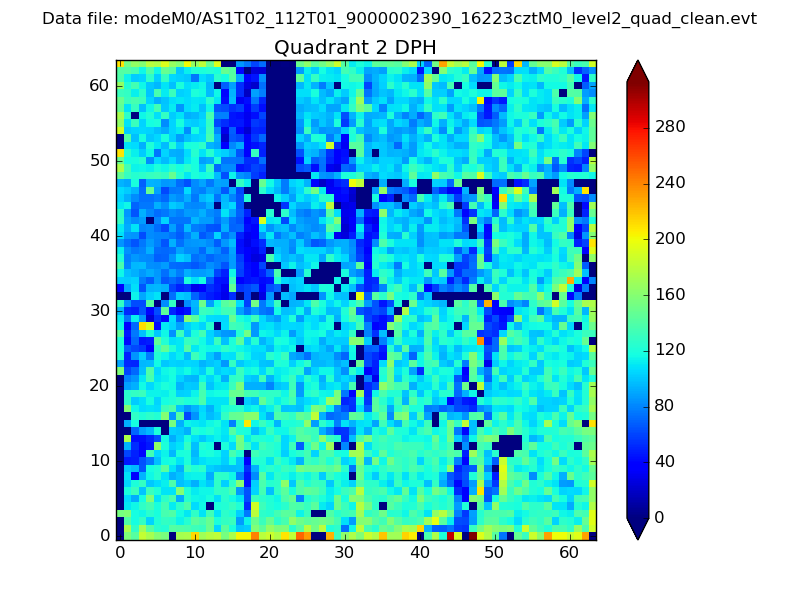
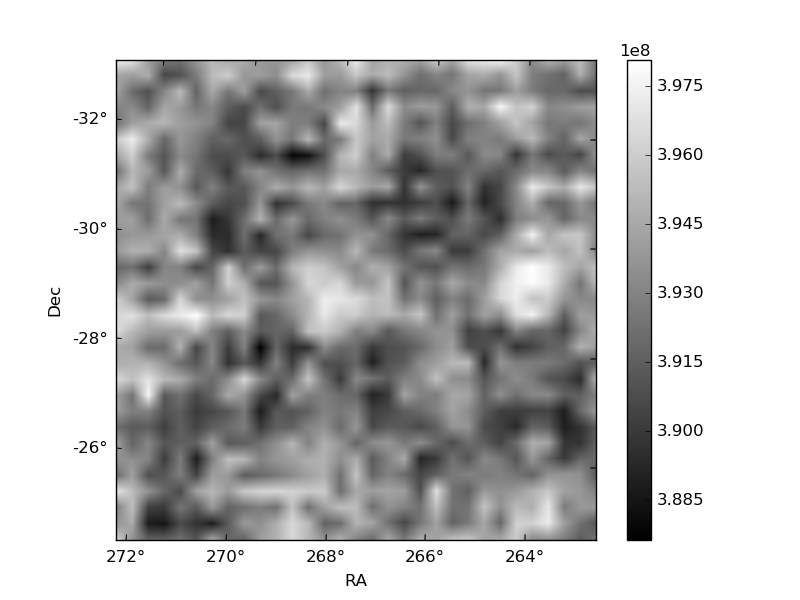
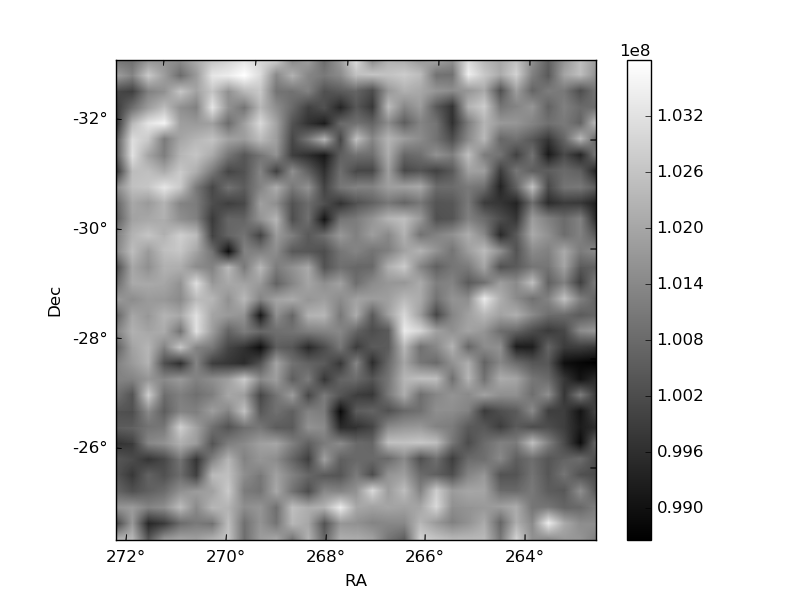
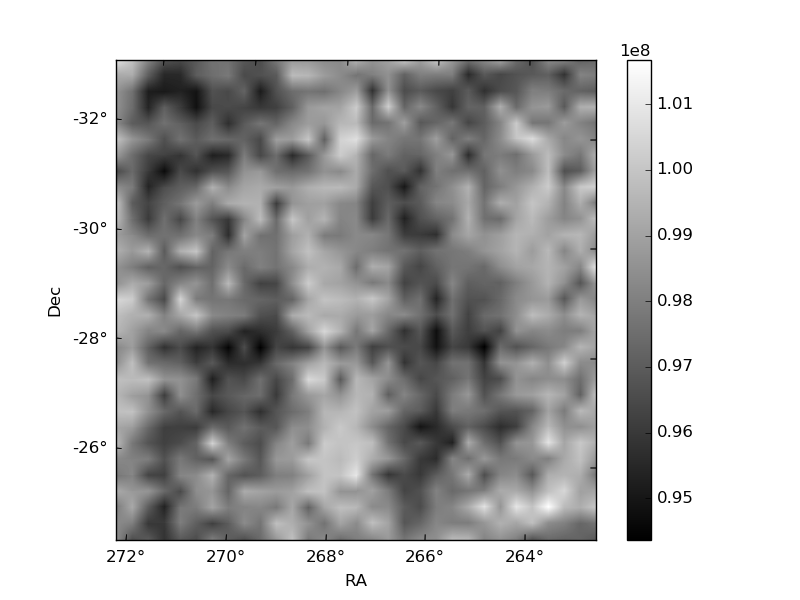
Histogram calculated using DETX and DETY for each event in the final _common_clean file
| Quadrant A | 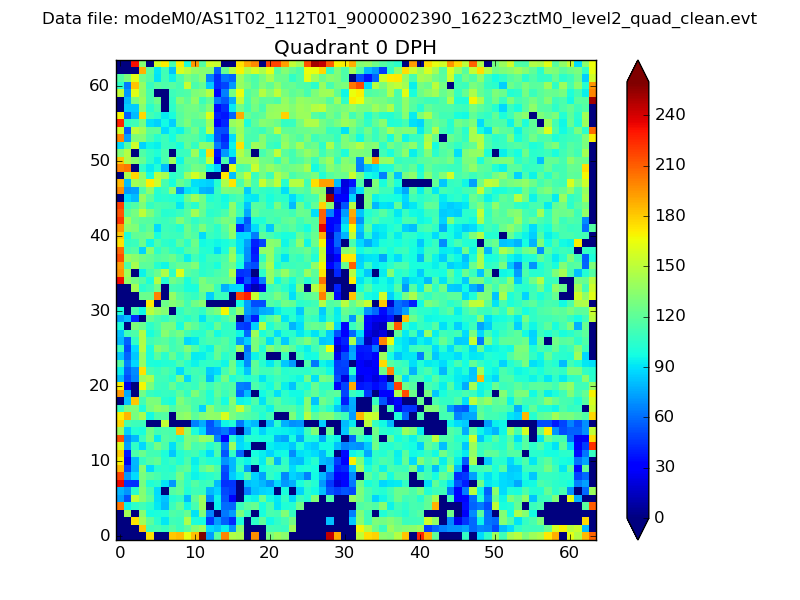 |
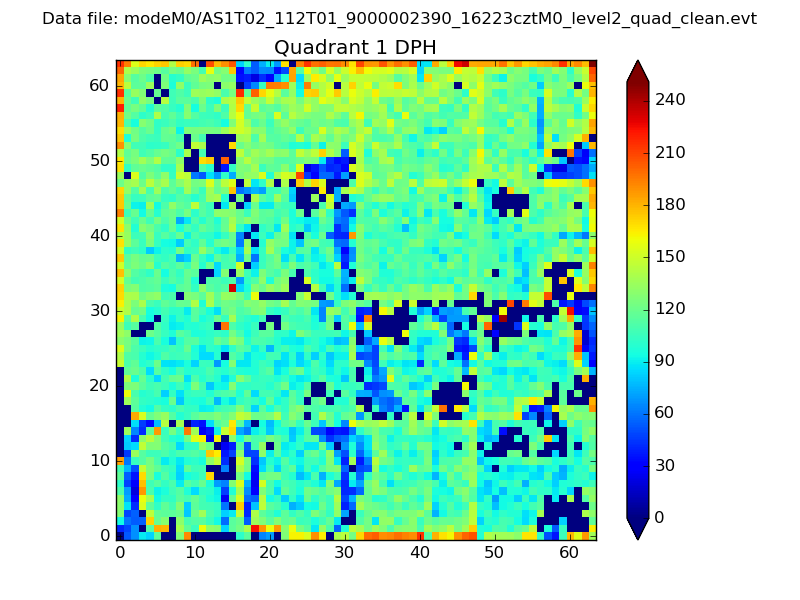 |
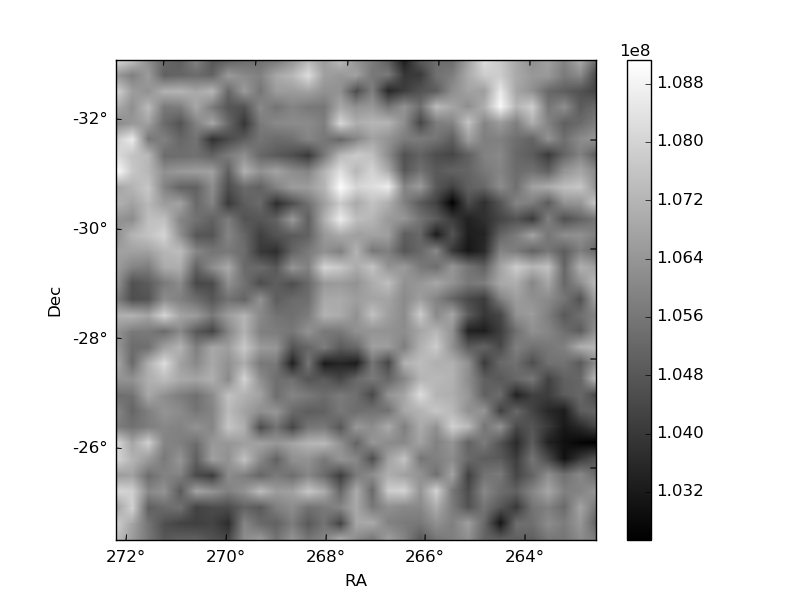
Quadrant B |
|---|---|---|---|
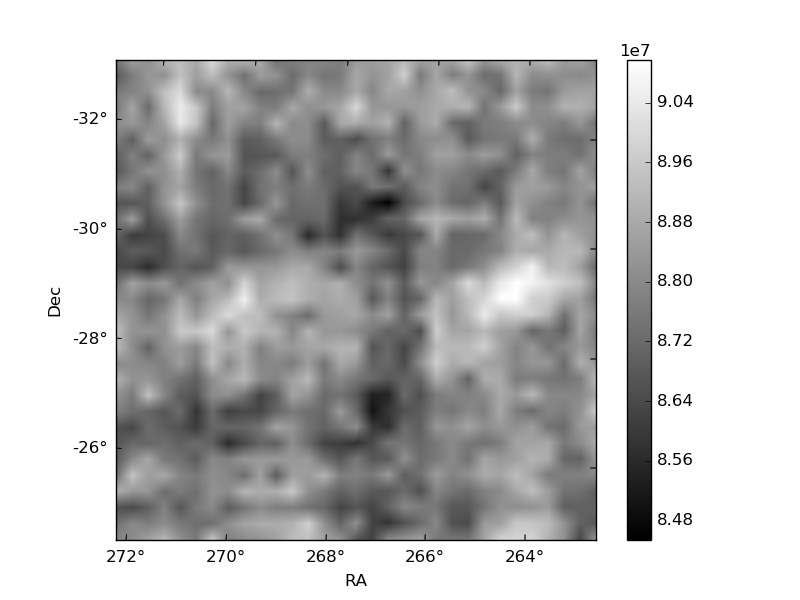
| Quadrant D | 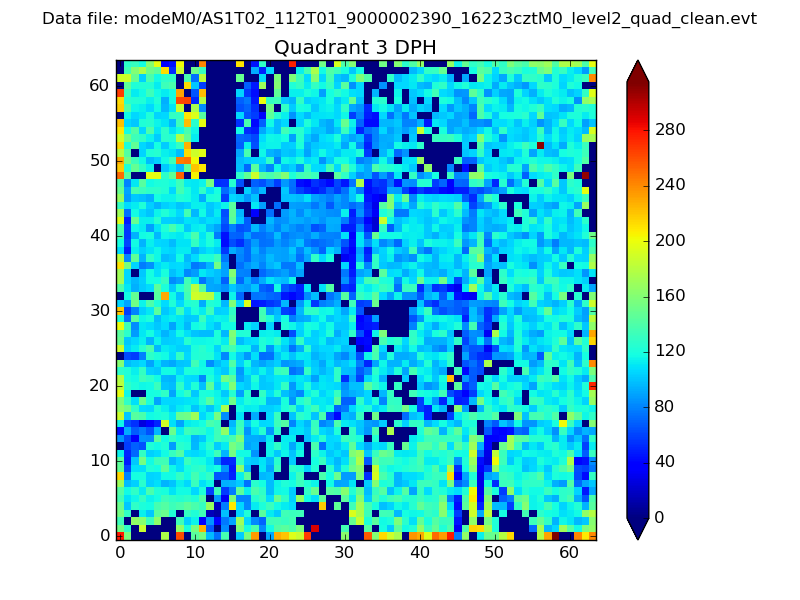 |
 |
Quadrant C |
| Plot type | Count rate plots | Images |
|---|---|---|
| Comparison with Poisson distribution Blue bars denote a histogram of data divided into 1 sec bins. Red curve is a Poisson curve with rate = median count rate of data. |
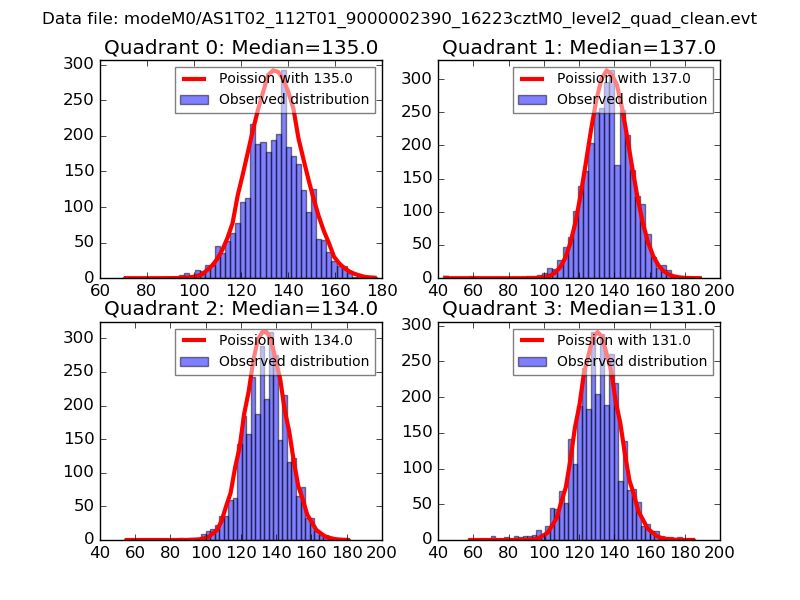 |
 |
| Quadrant-wise count rates Data is divided into 100 sec bins |
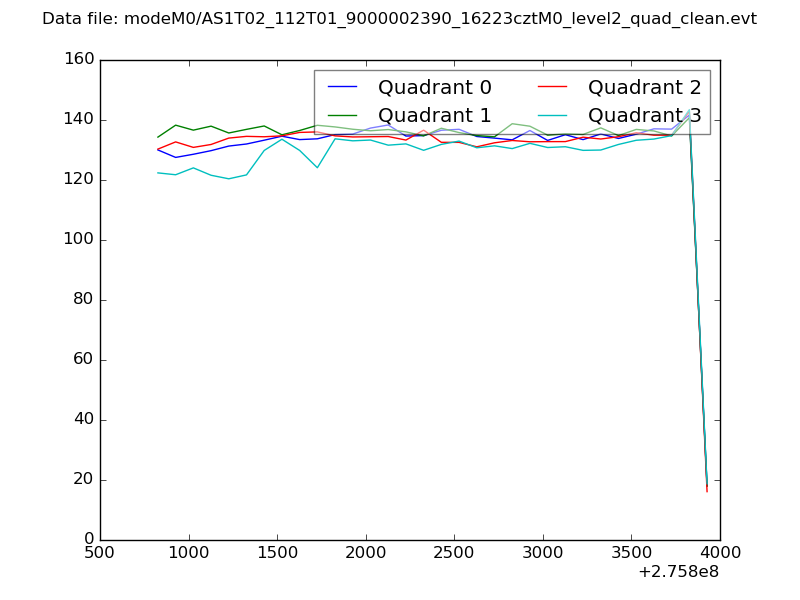 |
|
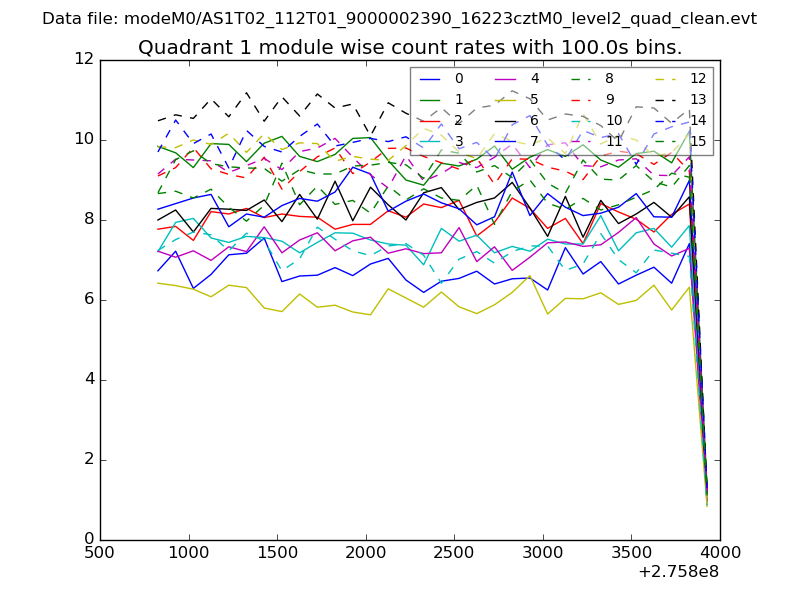
| Module-wise count rates for Quadrant A Data is divided into 100 sec bins |
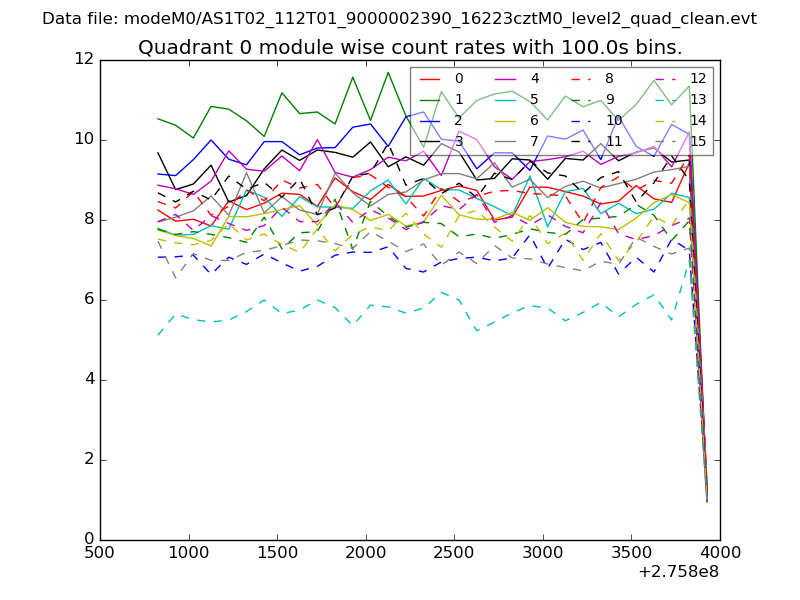 |
 |
| Module-wise count rates for Quadrant B Data is divided into 100 sec bins |
 |
 |
| Module-wise count rates for Quadrant C Data is divided into 100 sec bins |
 |
 |
| Module-wise count rates for Quadrant D Data is divided into 100 sec bins |
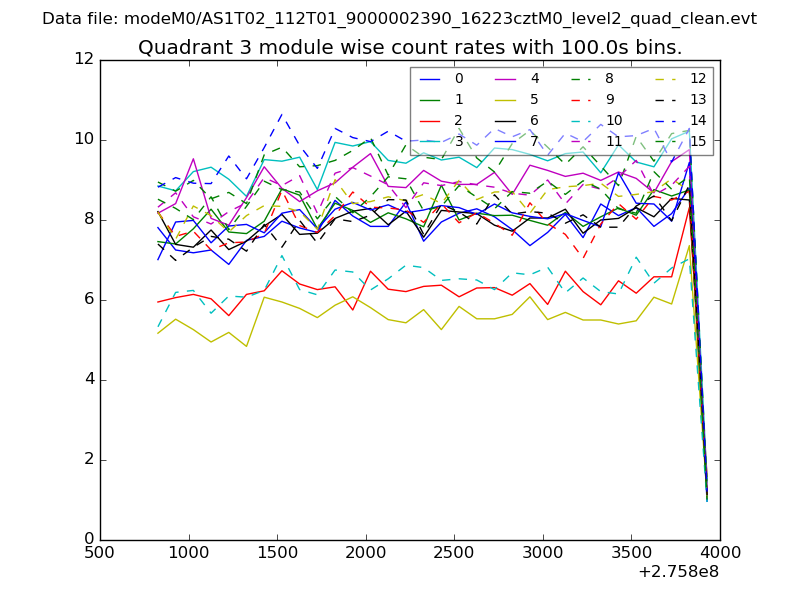 |
 |
| Parameter | Plot |
|---|---|
| CZT HV Monitor |  |
| D_VDD | 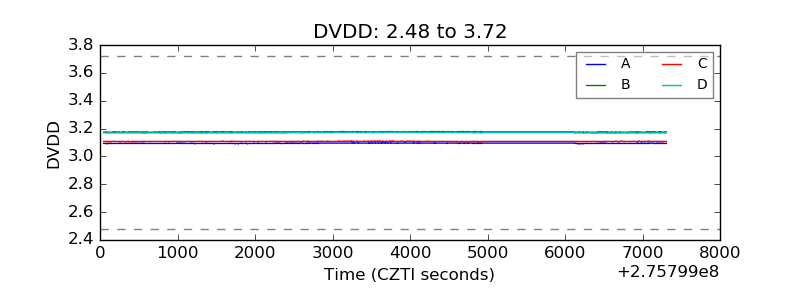 |
| Temperature 1 | 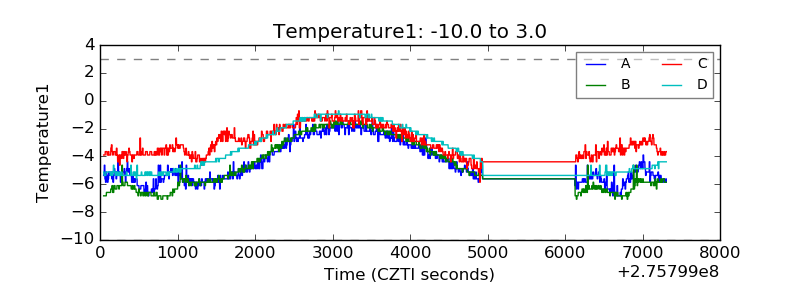 |
| Veto HV Monitor | 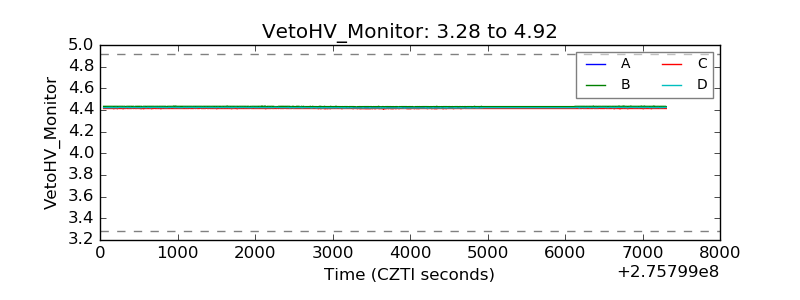 |
| Veto LLD | 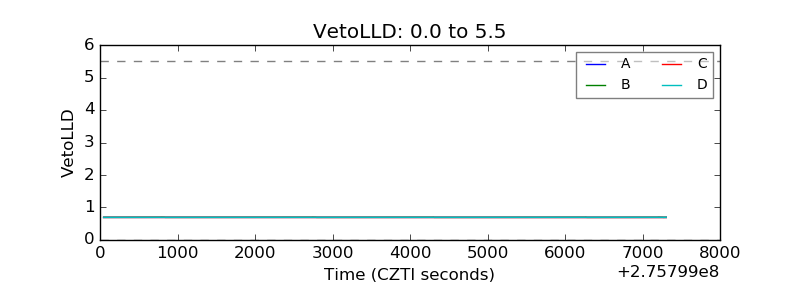 |
| Alpha Counter | 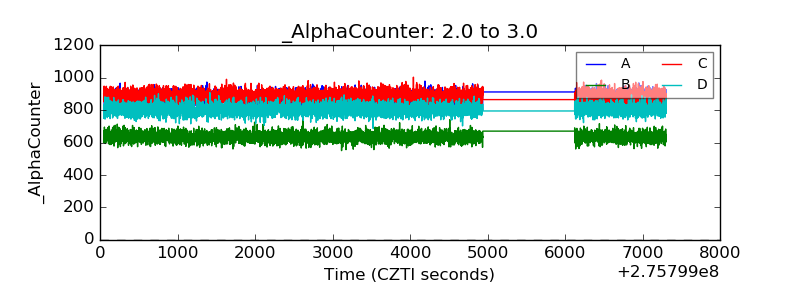 |
| _CPM_Rate | 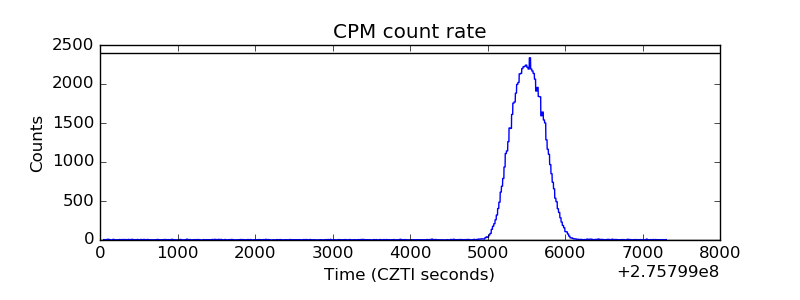 |
| CZT Counter | 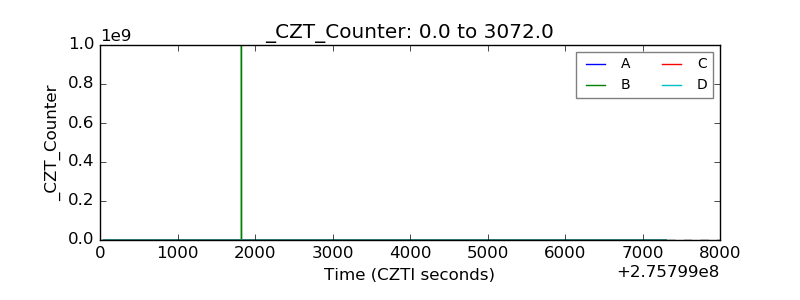 |
| +2.5 Volts monitor |  |
| +5 Volts monitor |  |
| _ROLL_ROT | 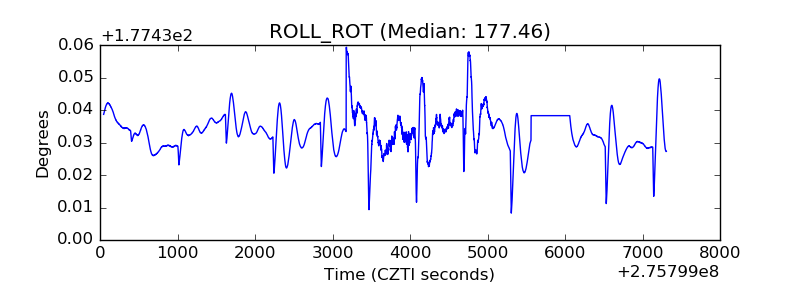 |
| _Roll_DEC | 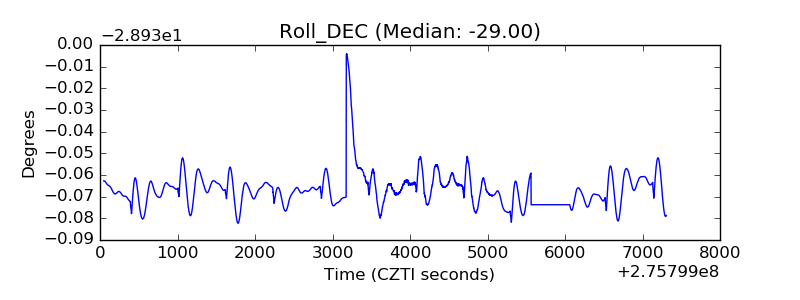 |
| _Roll_RA | 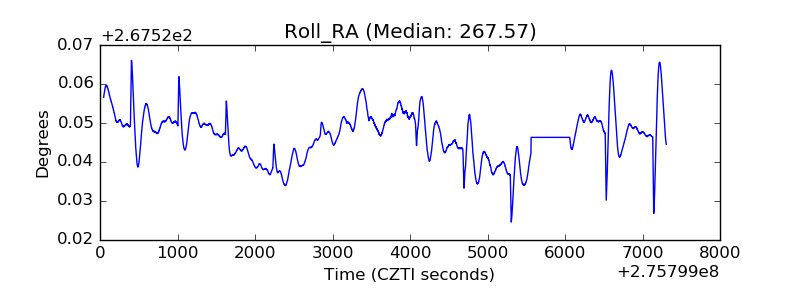 |
| Veto Counter | 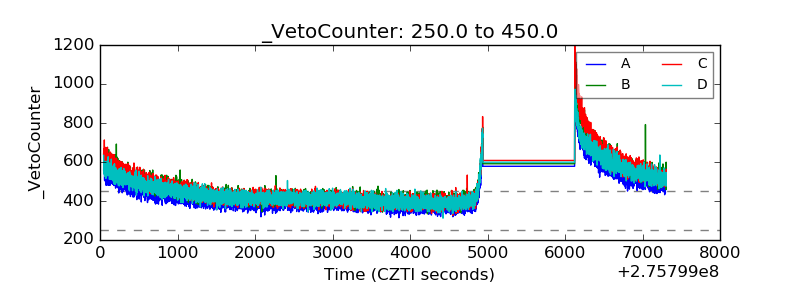 |