| Param | Original file | Final file |
|---|---|---|
| Filename | modeM0/AS1T02_112T01_9000002390_16225cztM0_level2.evt | modeM0/AS1T02_112T01_9000002390_16225cztM0_level2_quad_clean.evt |
| Size (bytes) | 479,563,200 | 98,752,320 |
| Size | 457.3 MB | 94.2 MB |
| Events in quadrant A | 3,587,628 | 643,826 |
| Events in quadrant B | 3,755,029 | 651,165 |
| Events in quadrant C | 3,464,659 | 634,436 |
| Events in quadrant D | 3,292,164 | 625,141 |
| Mode SS | |||
|---|---|---|---|
| Quadrant | BADHDUFLAG | Total packets | Discarded packets |
| A | 0 | 128 | 0 |
| B | 0 | 128 | 0 |
| C | 0 | 128 | 0 |
| D | 0 | 128 | 0 |
| Mode M9 | |||
|---|---|---|---|
| Quadrant | BADHDUFLAG | Total packets | Discarded packets |
| A | 0 | 13 | 0 |
| B | 0 | 13 | 0 |
| C | 0 | 13 | 0 |
| D | 0 | 13 | 0 |
| Mode M0 | |||
|---|---|---|---|
| Quadrant | BADHDUFLAG | Total packets | Discarded packets |
| A | 0 | 14782 | 3 |
| B | 0 | 15169 | 2 |
| C | 0 | 14349 | 2 |
| D | 0 | 13589 | 2 |
| Quadrant | Total seconds | Saturated seconds | Saturation percentage |
|---|---|---|---|
| A | 6243 | 110 | 1.761973% |
| B | 6243 | 131 | 2.098350% |
| C | 6243 | 151 | 2.418709% |
| D | 6244 | 96 | 1.537476% |
Noise dominated data is calculated using 1-second bins in cleaned event files. If a bin has >2000 counts, and if more than 50% of those come from <1% of pixels, then it is considered to be noise-dominated and hence unusable.
| Quadrant | # 1 sec bins | Bins with >0 counts | Bins with >2000 counts | High rate bins dominated by noise | Noise dominated (total time) | Noise dominated (detector-on time) | Marked lightcurve |
|---|---|---|---|---|---|---|---|
| A | 7559 | 6245 | 4 | 4 | 0.05% | 0.06% | 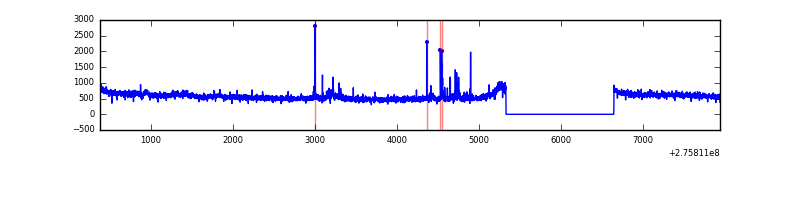 |
| B | 7559 | 6245 | 1 | 1 | 0.01% | 0.02% | 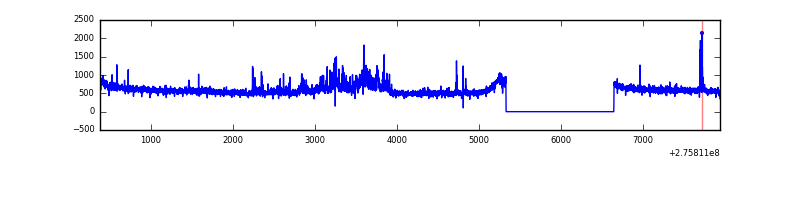 |
| C | 7559 | 6245 | 0 | 0 | 0.00% | 0.00% | 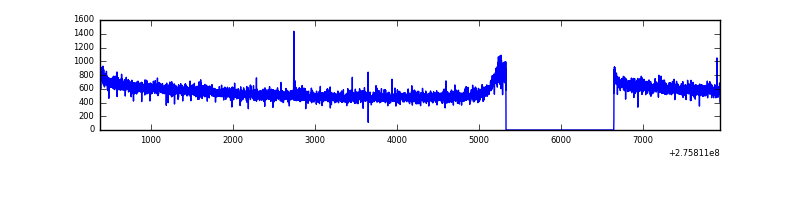 |
| D | 7560 | 6246 | 1 | 1 | 0.01% | 0.02% | 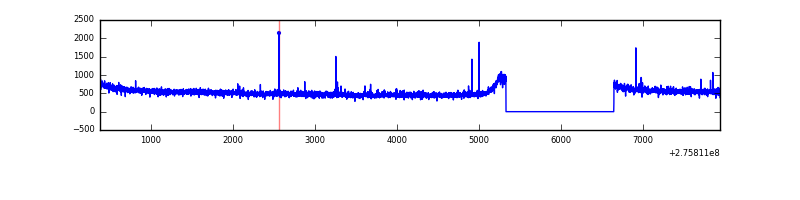 |
Top three noisy pixels from each quadrant. If the there are fewer than three noisy pixels in the level2.evt file, extra rows are filled as -1
| Pixel properties | Quadrant properties | ||||||
|---|---|---|---|---|---|---|---|
| Quadrant | DetID | PixID | Counts | Sigma | Mean | Median | Sigma |
| A | 15 | 174 | 80017 | 453.28 | 883 | 868 | 174.6 |
| A | 0 | 253 | 57520 | 324.44 | 883 | 868 | 174.6 |
| A | 8 | 247 | 31289 | 174.22 | 883 | 868 | 174.6 |
| B | 10 | 16 | 207658 | 1270.29 | 874 | 857 | 162.8 |
| B | 0 | 198 | 53241 | 321.77 | 874 | 857 | 162.8 |
| B | 0 | 229 | 20243 | 119.08 | 874 | 857 | 162.8 |
| C | 14 | 238 | 133019 | 684.29 | 842 | 851 | 193.1 |
| C | 3 | 233 | 30776 | 154.93 | 842 | 851 | 193.1 |
| C | 7 | 247 | 12235 | 58.94 | 842 | 851 | 193.1 |
| D | 2 | 234 | 21954 | 101.73 | 862 | 839 | 207.6 |
| D | 1 | 52 | 13912 | 62.98 | 862 | 839 | 207.6 |
| D | 2 | 120 | 8911 | 38.89 | 862 | 839 | 207.6 |
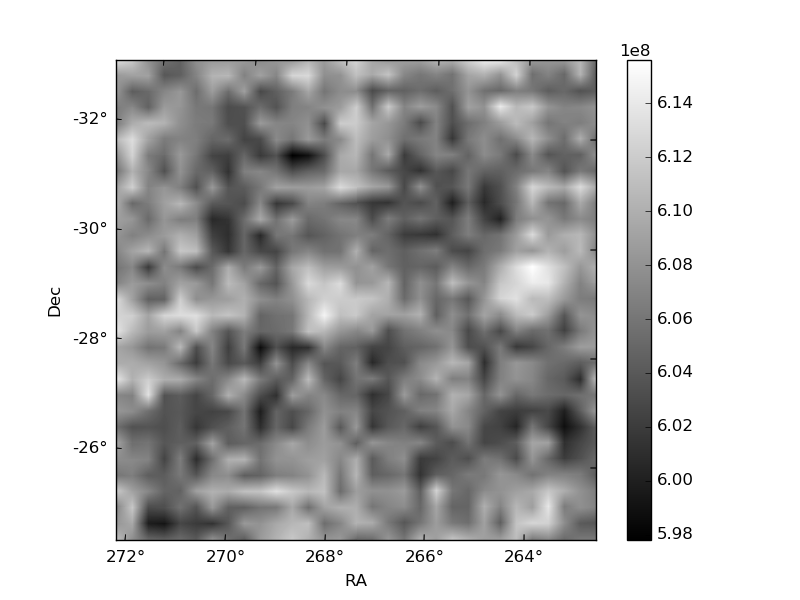
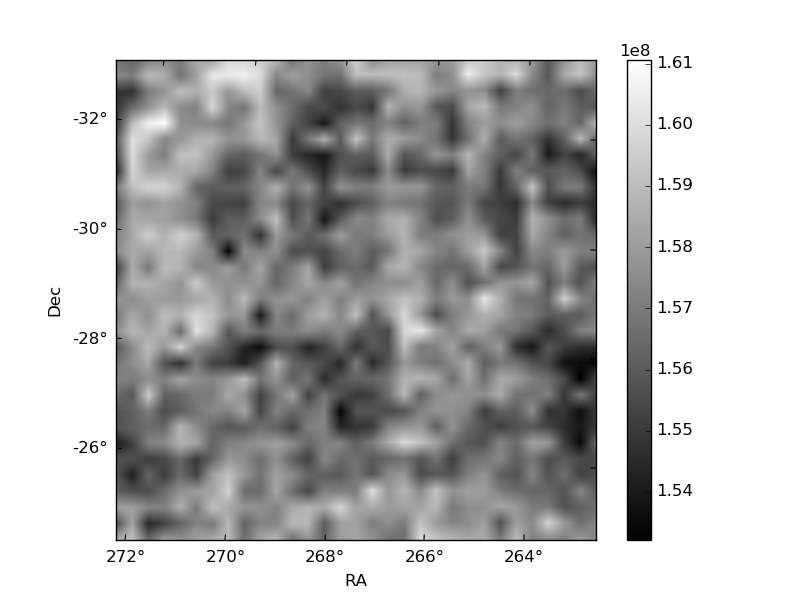
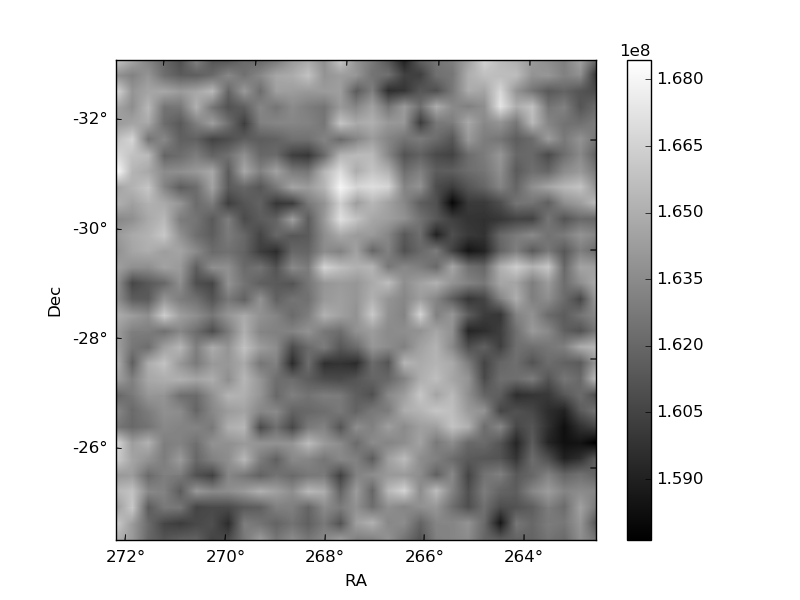
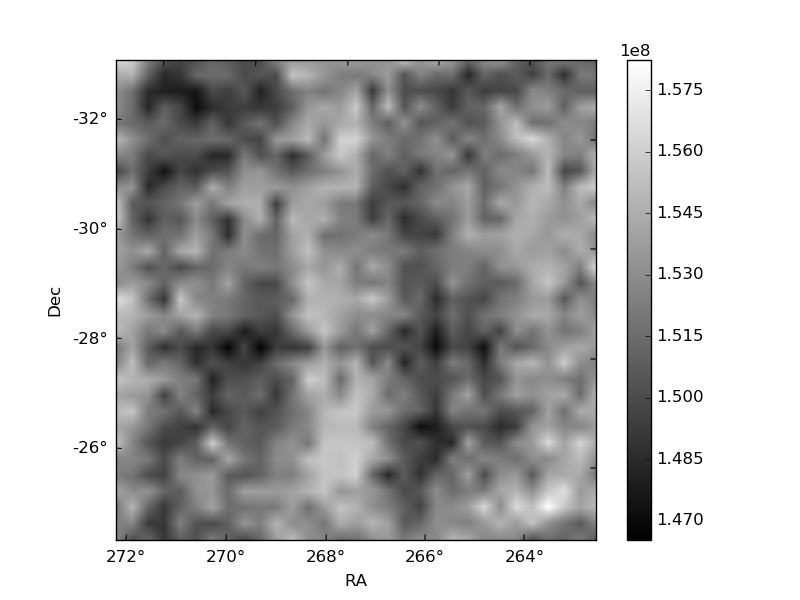
Histogram calculated using DETX and DETY for each event in the final _common_clean file
| Quadrant A | 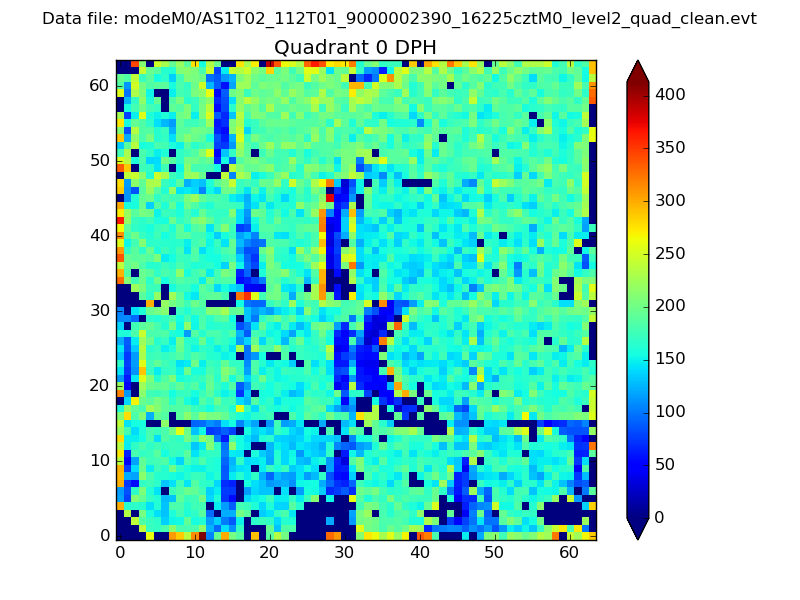 |
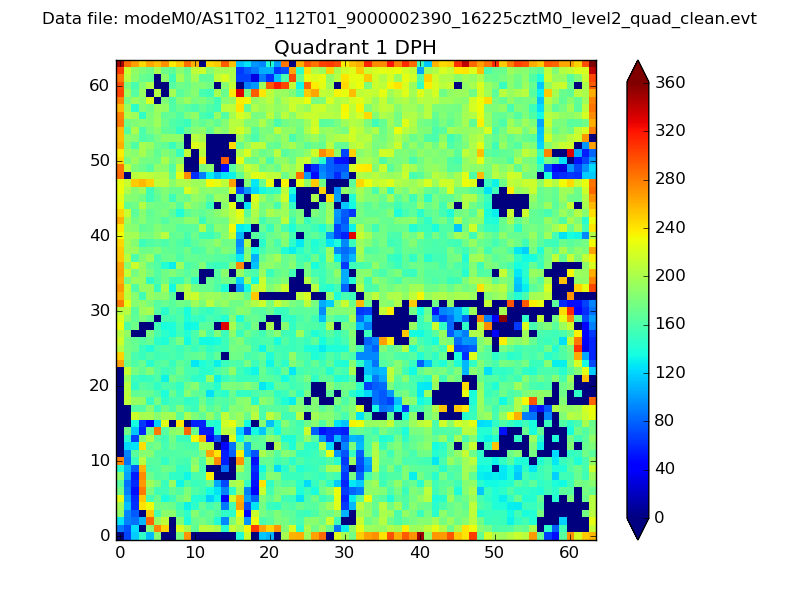 |
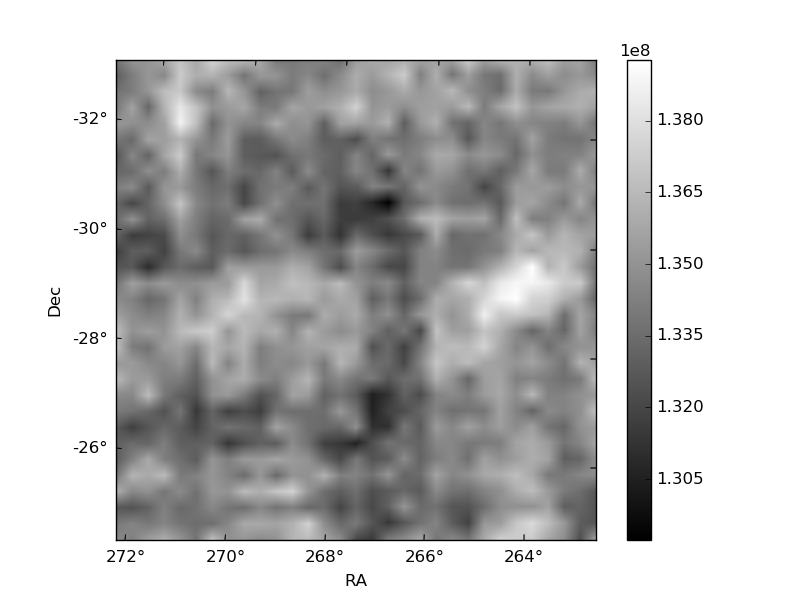
Quadrant B |
|---|---|---|---|
| Quadrant D | 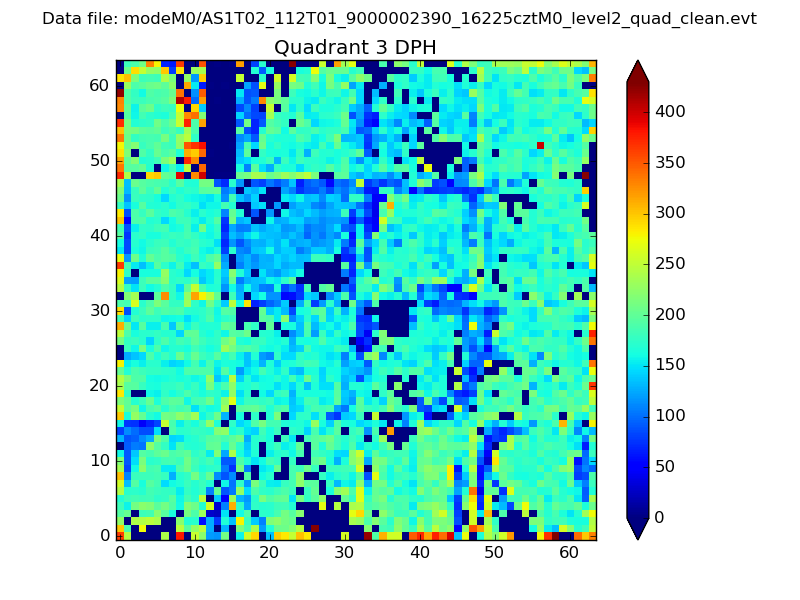 |
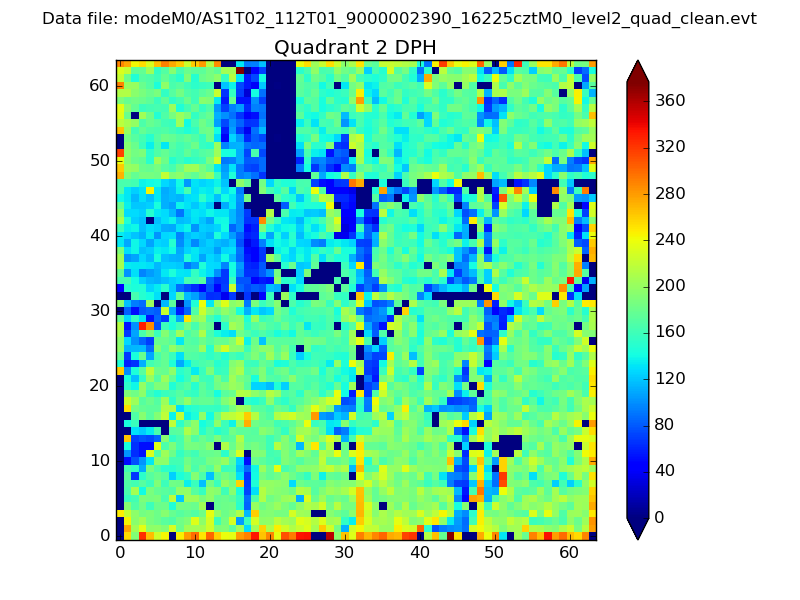 |
Quadrant C |
| Plot type | Count rate plots | Images |
|---|---|---|
| Comparison with Poisson distribution Blue bars denote a histogram of data divided into 1 sec bins. Red curve is a Poisson curve with rate = median count rate of data. |
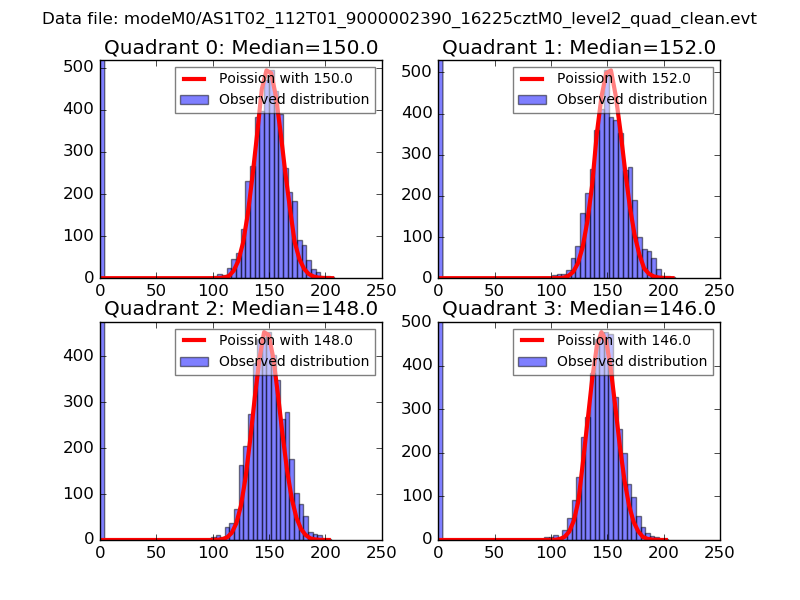 |
 |
| Quadrant-wise count rates Data is divided into 100 sec bins |
 |
|
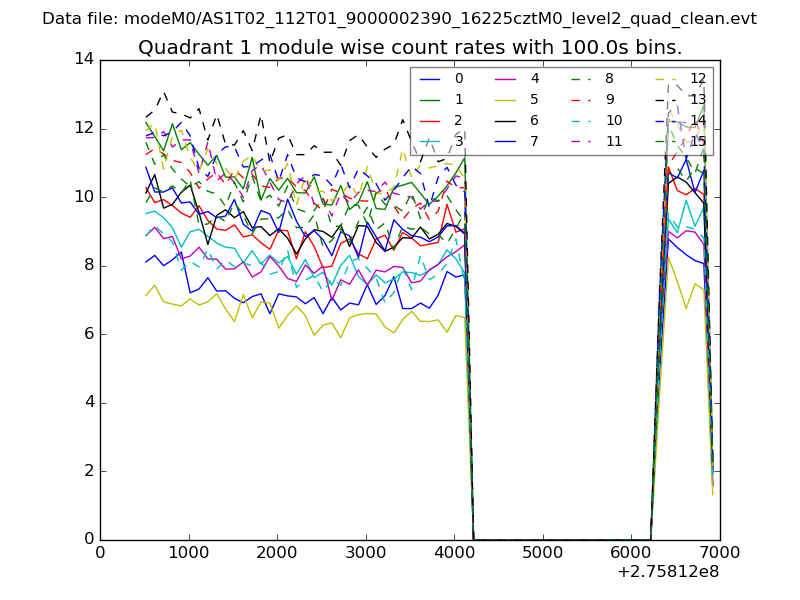
| Module-wise count rates for Quadrant A Data is divided into 100 sec bins |
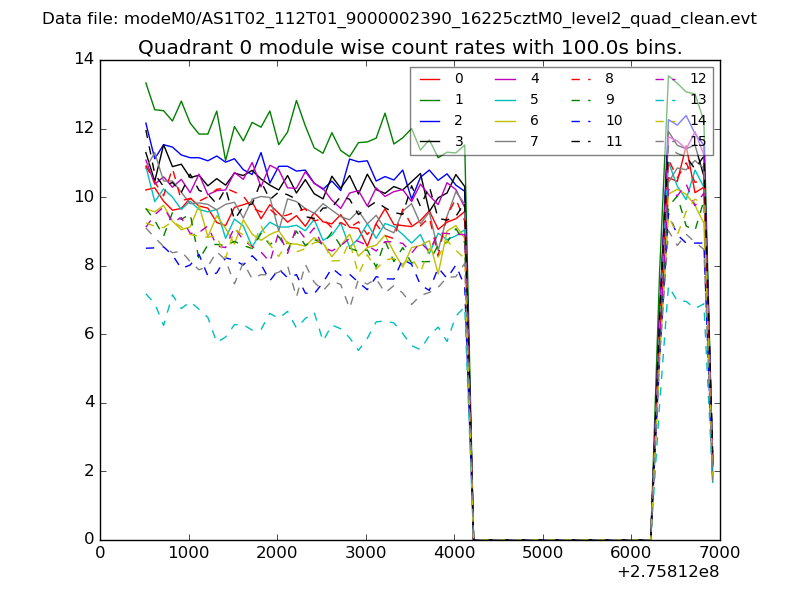 |
 |
| Module-wise count rates for Quadrant B Data is divided into 100 sec bins |
 |
 |
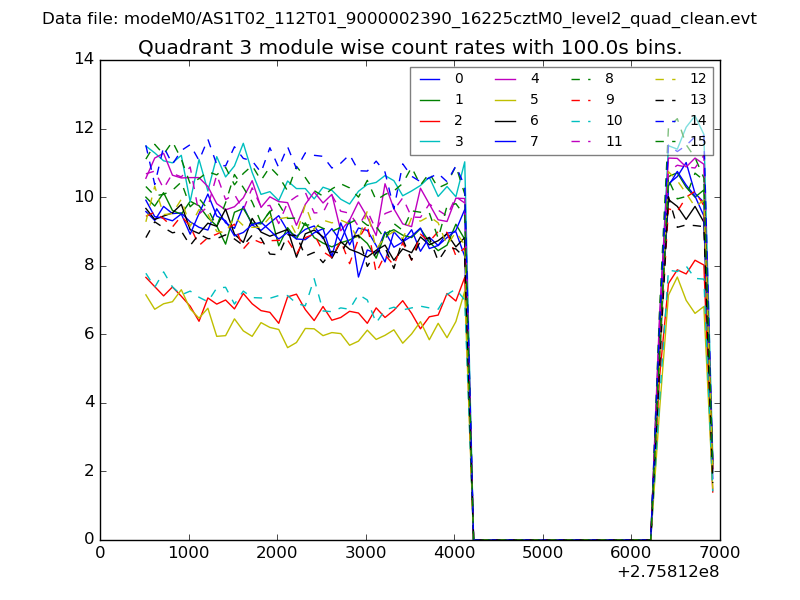
| Module-wise count rates for Quadrant C Data is divided into 100 sec bins |
 |
 |
| Module-wise count rates for Quadrant D Data is divided into 100 sec bins |
 |
 |
| Parameter | Plot |
|---|---|
| CZT HV Monitor | 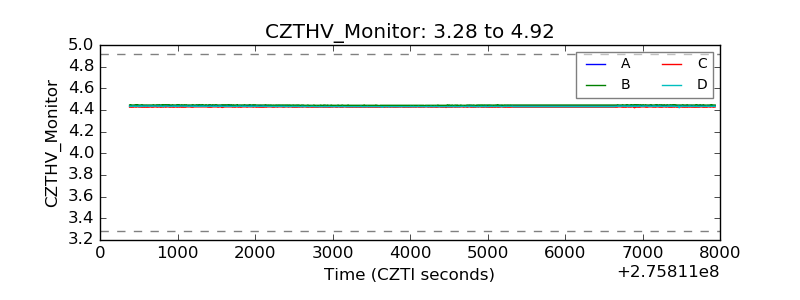 |
| D_VDD | 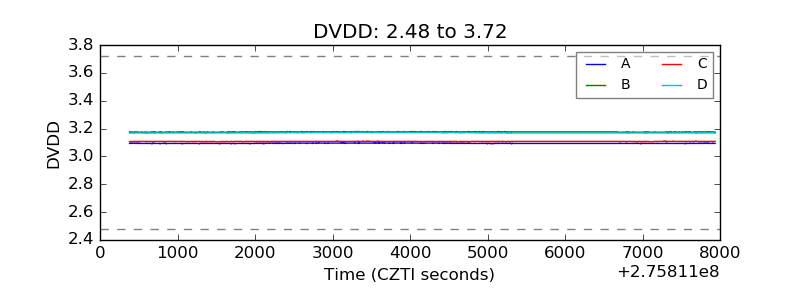 |
| Temperature 1 | 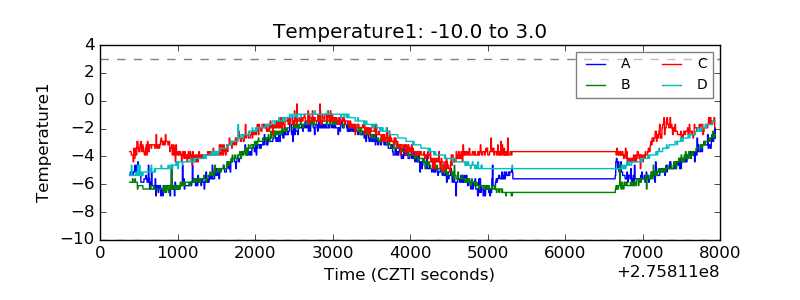 |
| Veto HV Monitor | 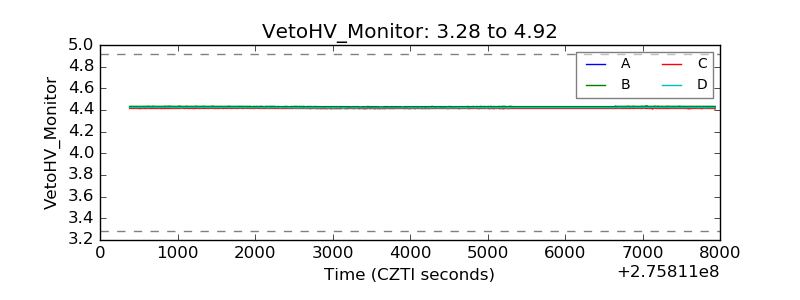 |
| Veto LLD | 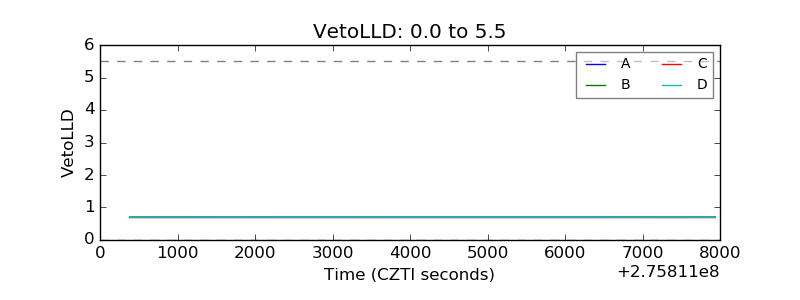 |
| Alpha Counter | 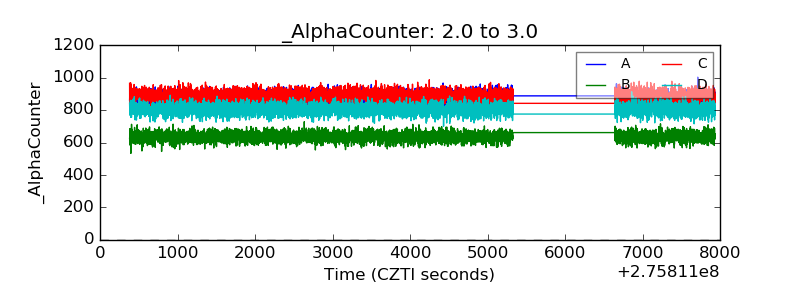 |
| _CPM_Rate | 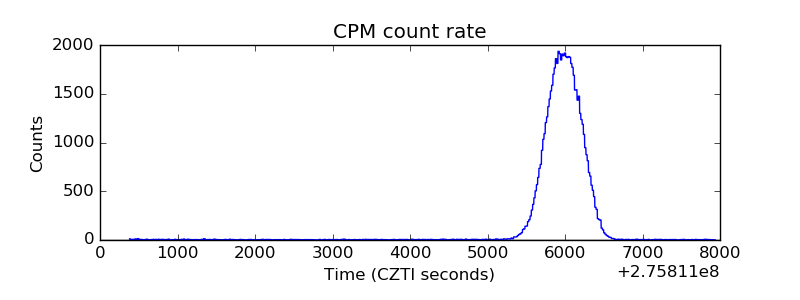 |
| CZT Counter | 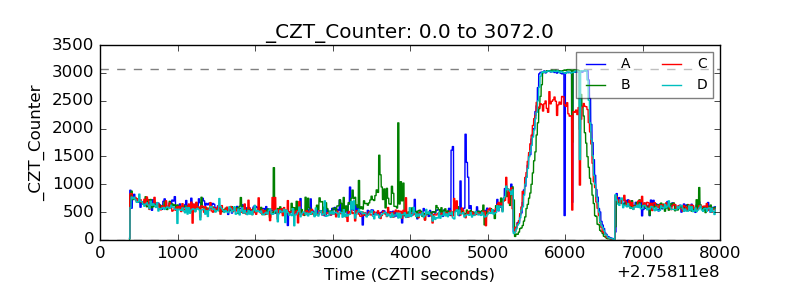 |
| +2.5 Volts monitor | 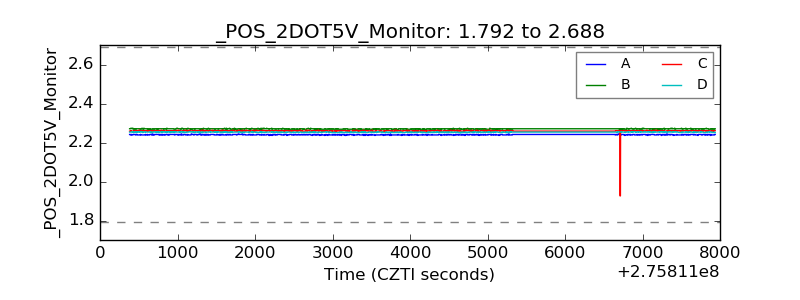 |
| +5 Volts monitor |  |
| _ROLL_ROT | 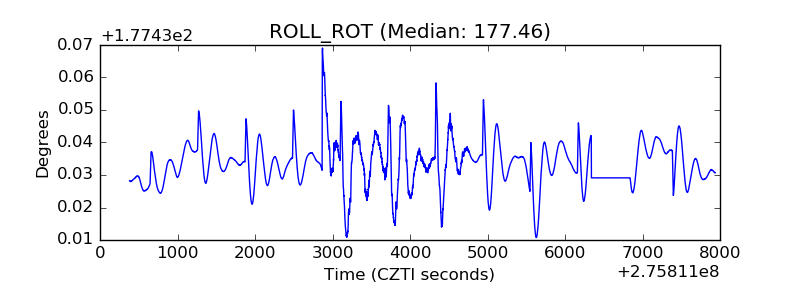 |
| _Roll_DEC | 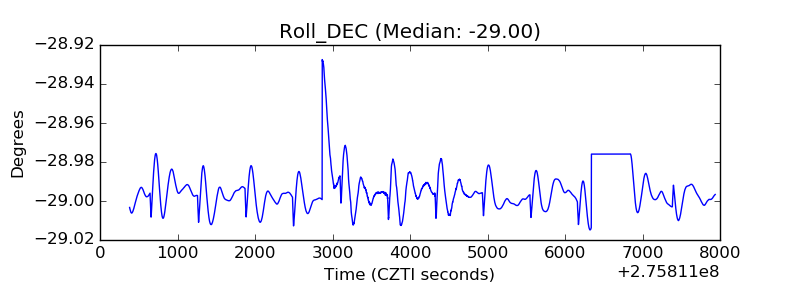 |
| _Roll_RA | 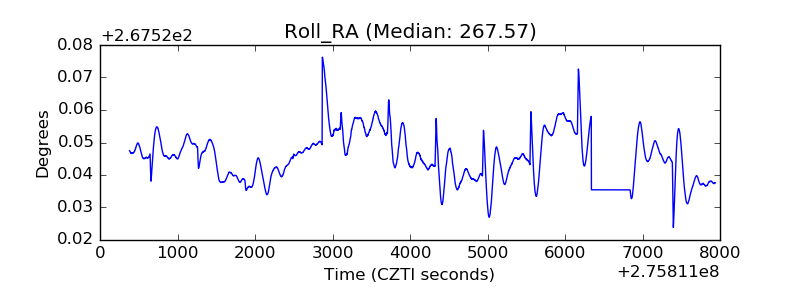 |
| Veto Counter | 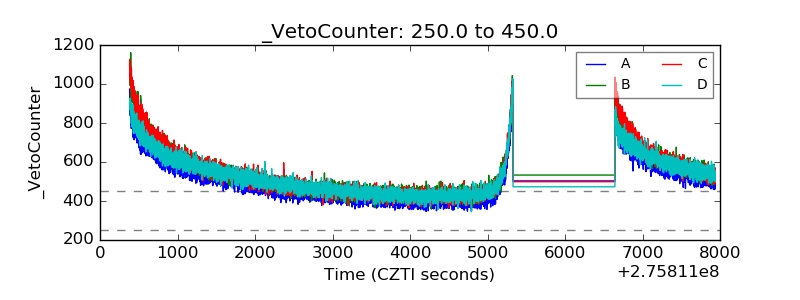 |