| Param | Original file | Final file |
|---|---|---|
| Filename | modeM0/AS1T02_112T01_9000002390_16227cztM0_level2.evt | modeM0/AS1T02_112T01_9000002390_16227cztM0_level2_quad_clean.evt |
| Size (bytes) | 483,105,600 | 111,188,160 |
| Size | 460.7 MB | 106.0 MB |
| Events in quadrant A | 3,688,951 | 733,772 |
| Events in quadrant B | 3,784,387 | 742,252 |
| Events in quadrant C | 3,458,123 | 725,094 |
| Events in quadrant D | 3,262,388 | 717,528 |
| Mode SS | |||
|---|---|---|---|
| Quadrant | BADHDUFLAG | Total packets | Discarded packets |
| A | 0 | 130 | 0 |
| B | 0 | 130 | 0 |
| C | 0 | 130 | 0 |
| D | 0 | 130 | 0 |
| Mode M9 | |||
|---|---|---|---|
| Quadrant | BADHDUFLAG | Total packets | Discarded packets |
| A | 0 | 20 | 0 |
| B | 0 | 20 | 0 |
| C | 0 | 20 | 0 |
| D | 0 | 21 | 0 |
| Mode M0 | |||
|---|---|---|---|
| Quadrant | BADHDUFLAG | Total packets | Discarded packets |
| A | 0 | 14954 | 3 |
| B | 0 | 15300 | 2 |
| C | 0 | 14318 | 2 |
| D | 0 | 13792 | 2 |
| Quadrant | Total seconds | Saturated seconds | Saturation percentage |
|---|---|---|---|
| A | 6437 | 265 | 4.116825% |
| B | 6437 | 165 | 2.563306% |
| C | 6437 | 178 | 2.765263% |
| D | 6437 | 101 | 1.569054% |
Noise dominated data is calculated using 1-second bins in cleaned event files. If a bin has >2000 counts, and if more than 50% of those come from <1% of pixels, then it is considered to be noise-dominated and hence unusable.
| Quadrant | # 1 sec bins | Bins with >0 counts | Bins with >2000 counts | High rate bins dominated by noise | Noise dominated (total time) | Noise dominated (detector-on time) | Marked lightcurve |
|---|---|---|---|---|---|---|---|
| A | 7608 | 6439 | 108 | 108 | 1.42% | 1.68% | 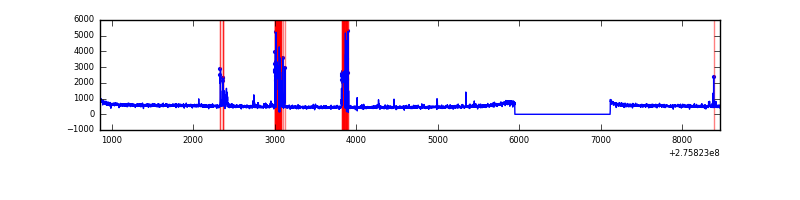 |
| B | 7608 | 6439 | 33 | 33 | 0.43% | 0.51% | 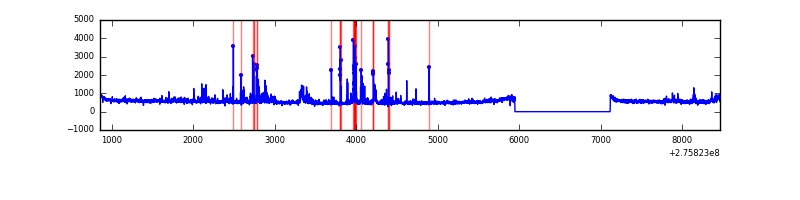 |
| C | 7608 | 6439 | 13 | 13 | 0.17% | 0.20% | 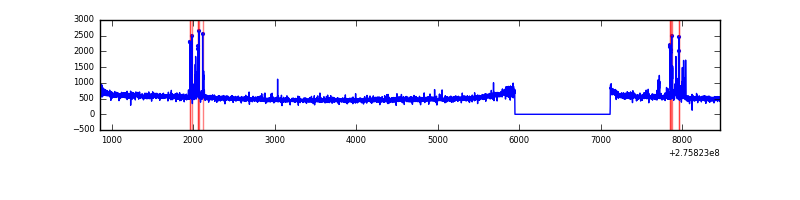 |
| D | 7608 | 6439 | 4 | 4 | 0.05% | 0.06% | 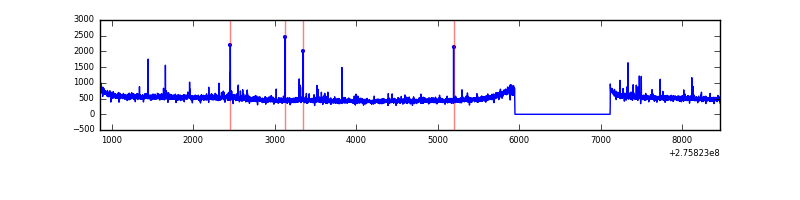 |
Top three noisy pixels from each quadrant. If the there are fewer than three noisy pixels in the level2.evt file, extra rows are filled as -1
| Pixel properties | Quadrant properties | ||||||
|---|---|---|---|---|---|---|---|
| Quadrant | DetID | PixID | Counts | Sigma | Mean | Median | Sigma |
| A | 15 | 174 | 388893 | 2266.24 | 854 | 841 | 171.2 |
| A | 13 | 248 | 9537 | 50.78 | 854 | 841 | 171.2 |
| A | 0 | 226 | 7672 | 39.89 | 854 | 841 | 171.2 |
| B | 0 | 244 | 126859 | 787.94 | 846 | 827 | 160.0 |
| B | 4 | 173 | 87372 | 541.07 | 846 | 827 | 160.0 |
| B | 0 | 198 | 61373 | 378.53 | 846 | 827 | 160.0 |
| C | 14 | 238 | 126136 | 673.26 | 812 | 819 | 186.1 |
| C | 0 | 207 | 117445 | 626.57 | 812 | 819 | 186.1 |
| C | 3 | 233 | 33311 | 174.56 | 812 | 819 | 186.1 |
| D | 1 | 52 | 39813 | 189.89 | 839 | 815 | 205.4 |
| D | 2 | 234 | 24235 | 114.03 | 839 | 815 | 205.4 |
| D | 10 | 70 | 23022 | 108.13 | 839 | 815 | 205.4 |
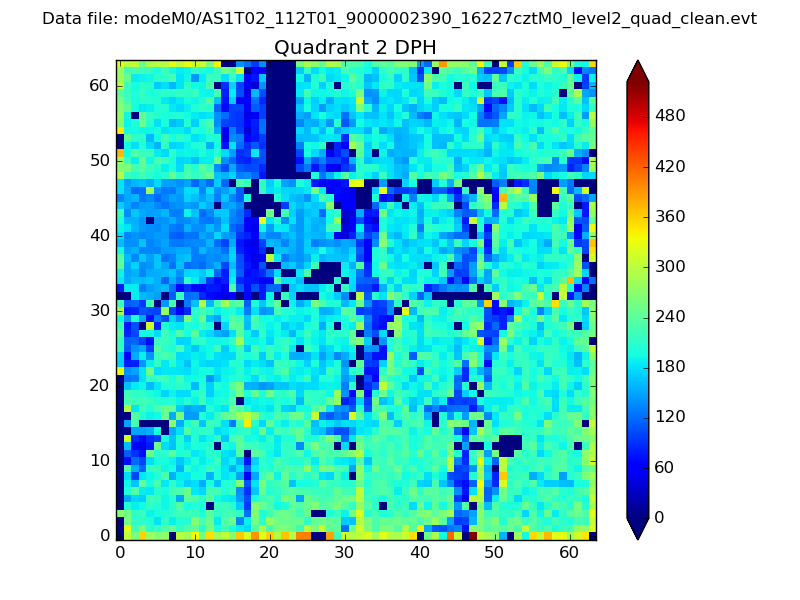
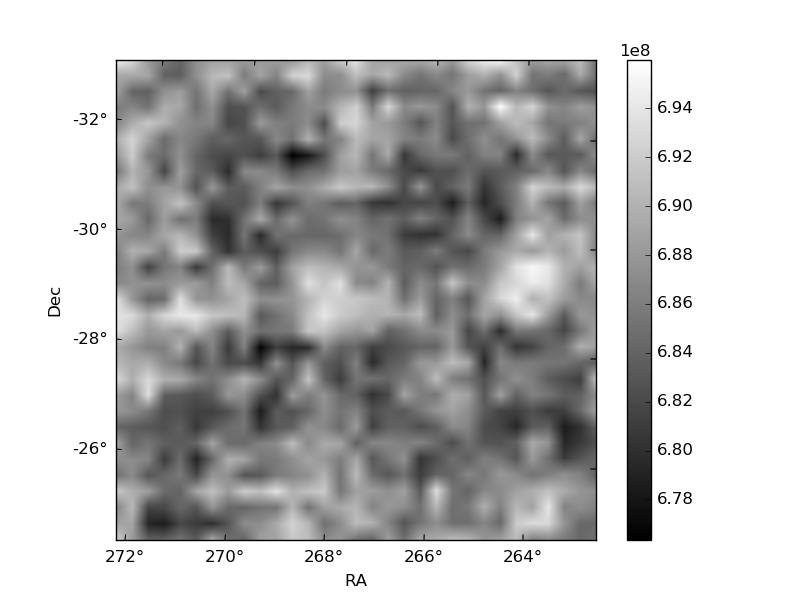
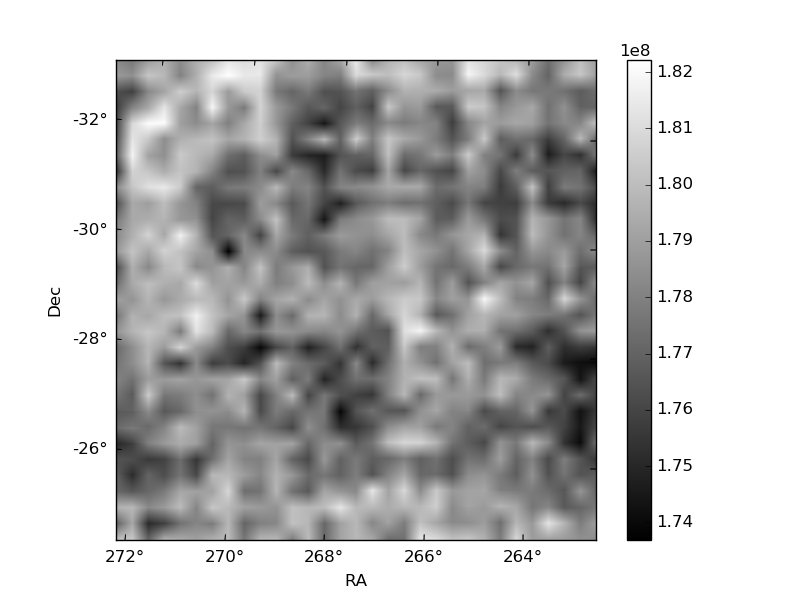
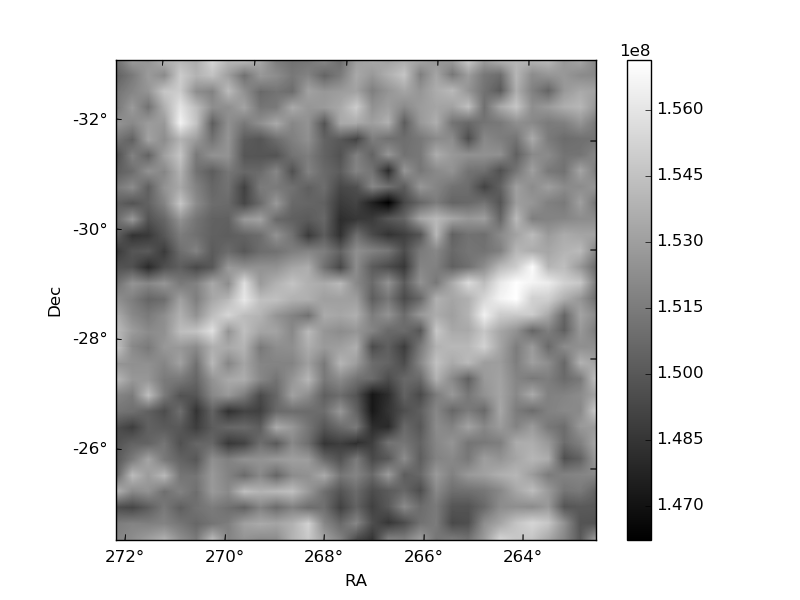
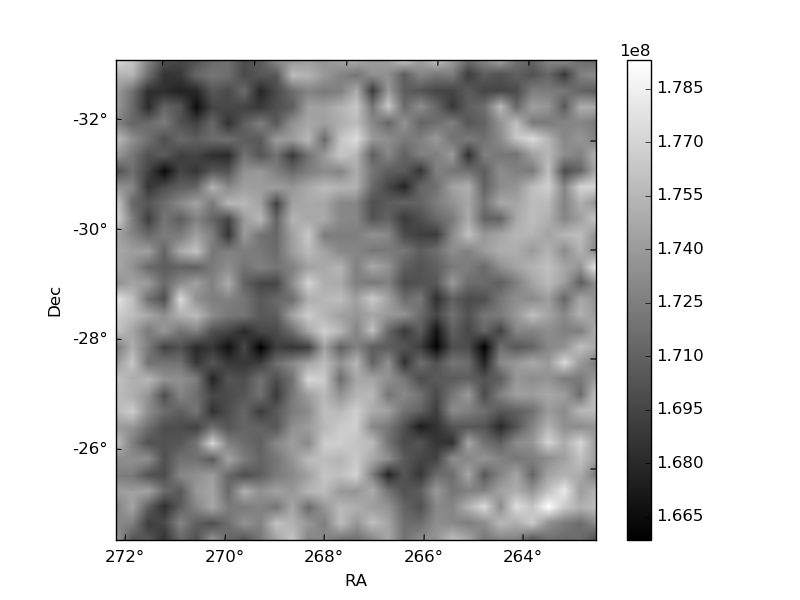
Histogram calculated using DETX and DETY for each event in the final _common_clean file
| Quadrant A | 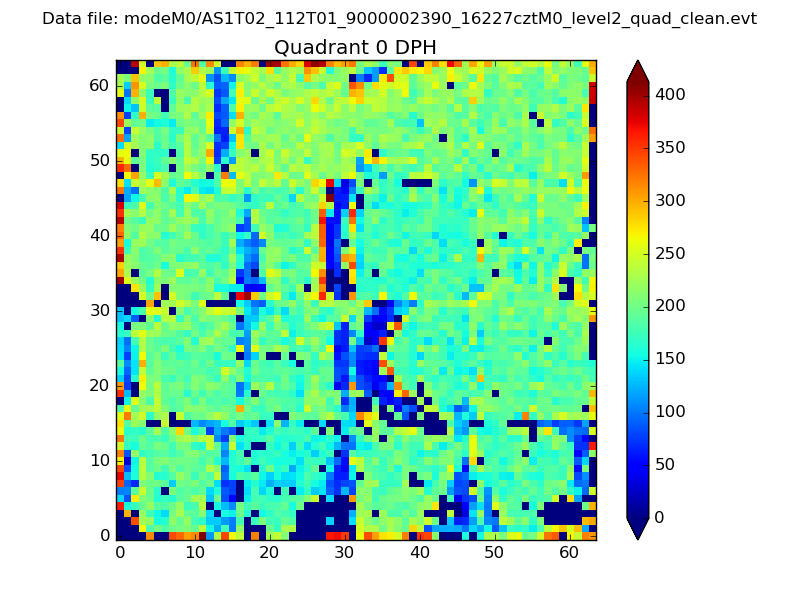 |
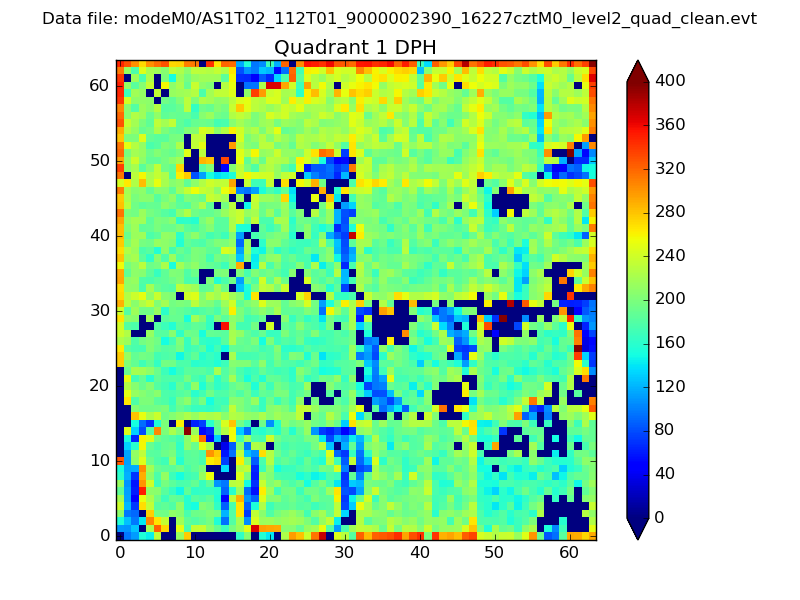 |
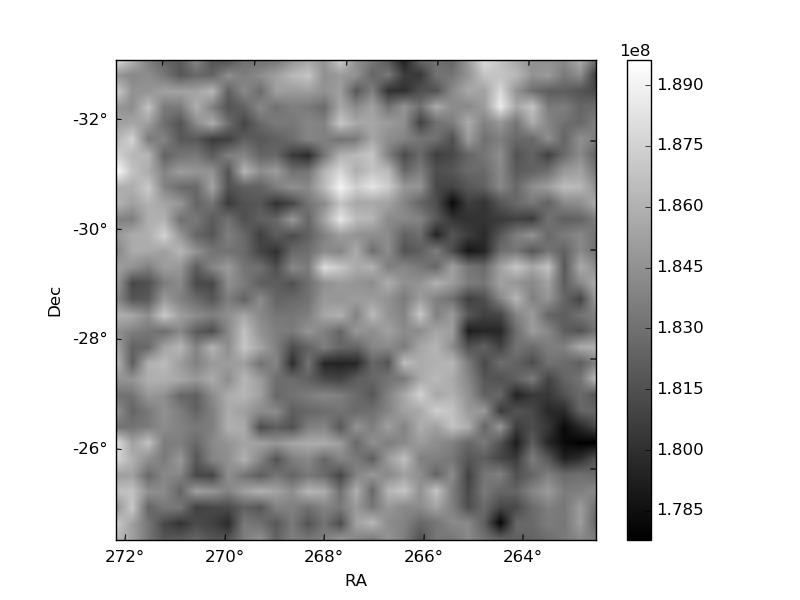
Quadrant B |
|---|---|---|---|
| Quadrant D | 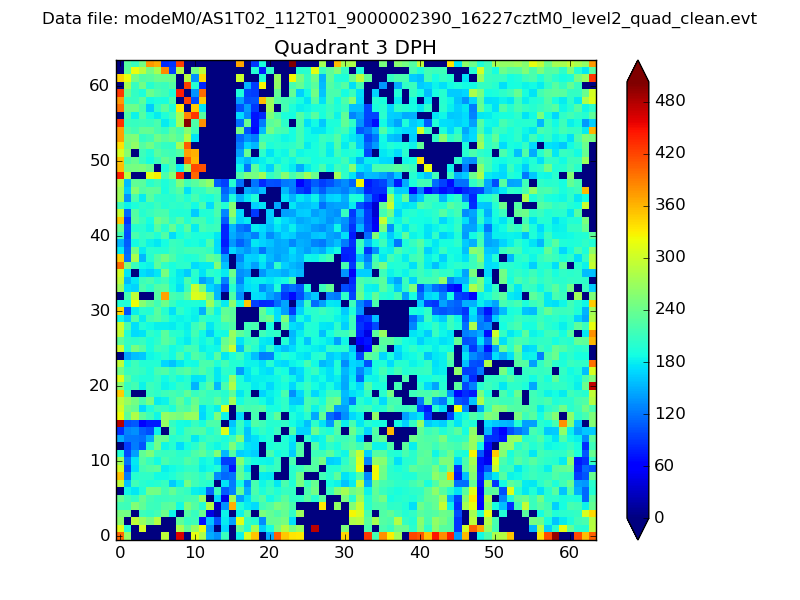 |
 |
Quadrant C |
| Plot type | Count rate plots | Images |
|---|---|---|
| Comparison with Poisson distribution Blue bars denote a histogram of data divided into 1 sec bins. Red curve is a Poisson curve with rate = median count rate of data. |
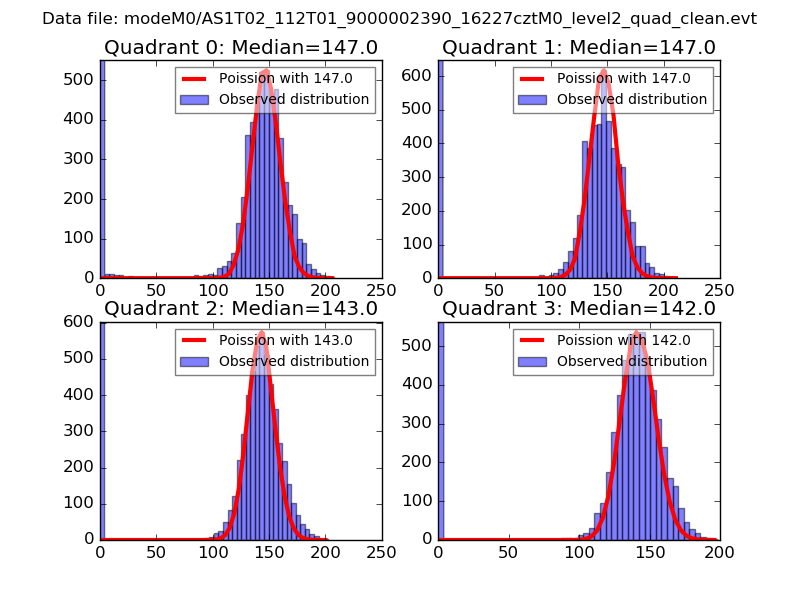 |
 |
| Quadrant-wise count rates Data is divided into 100 sec bins |
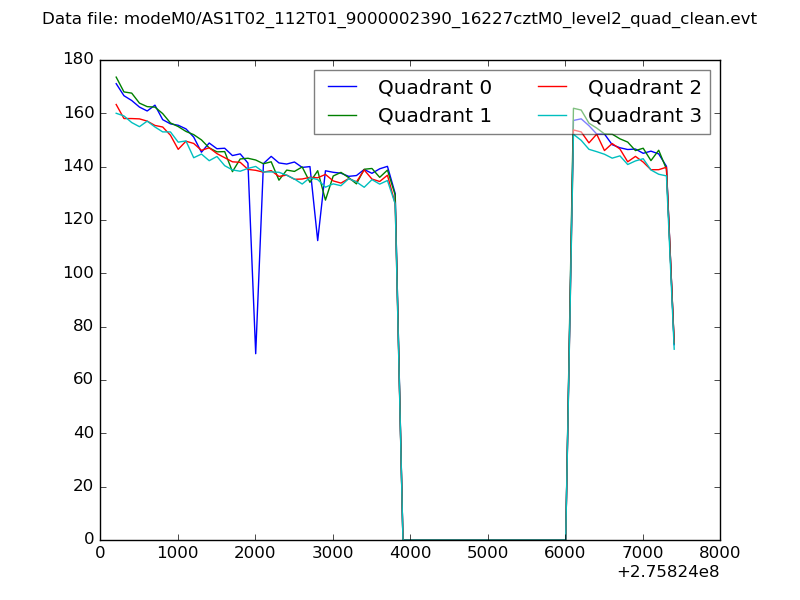 |
|
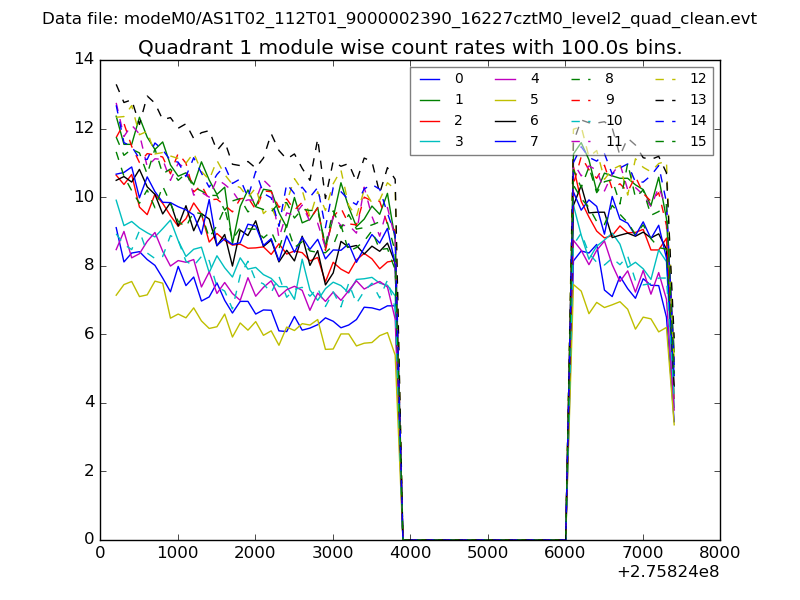
| Module-wise count rates for Quadrant A Data is divided into 100 sec bins |
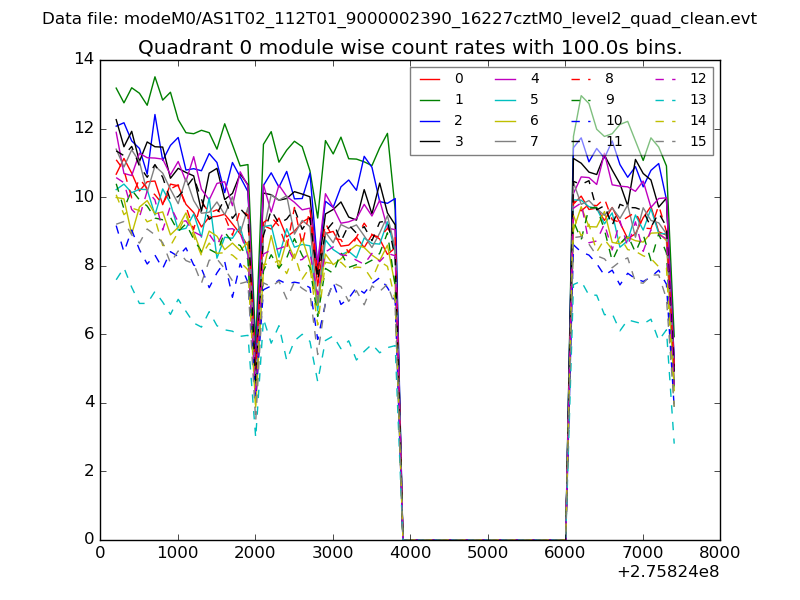 |
 |
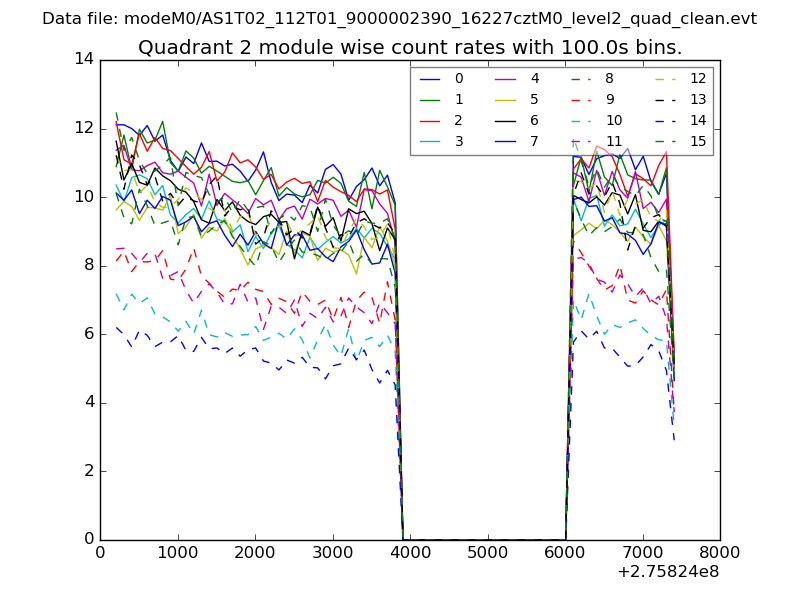
| Module-wise count rates for Quadrant B Data is divided into 100 sec bins |
 |
 |
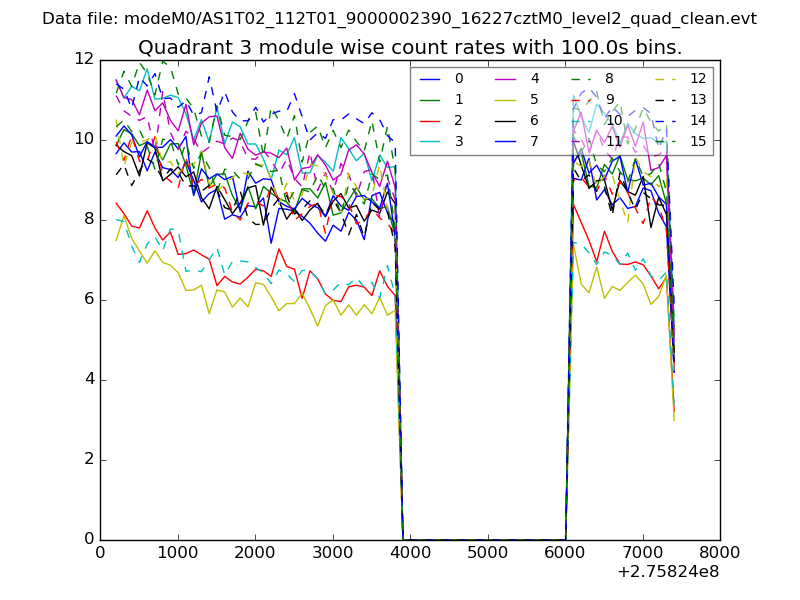
| Module-wise count rates for Quadrant C Data is divided into 100 sec bins |
 |
 |
| Module-wise count rates for Quadrant D Data is divided into 100 sec bins |
 |
 |
| Parameter | Plot |
|---|---|
| CZT HV Monitor | 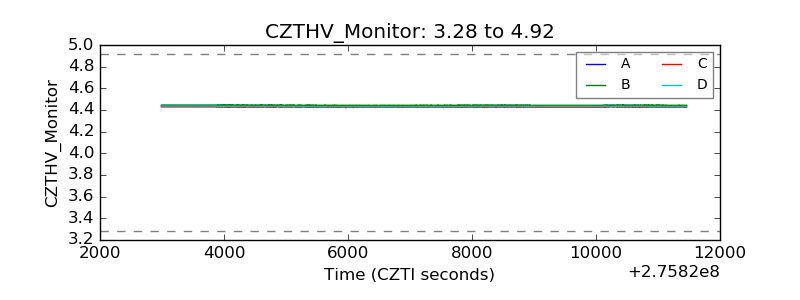 |
| D_VDD | 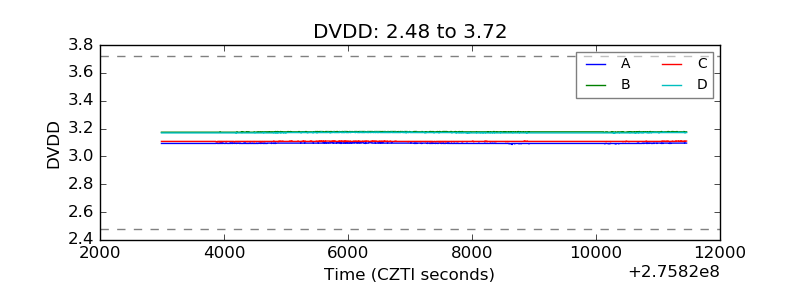 |
| Temperature 1 | 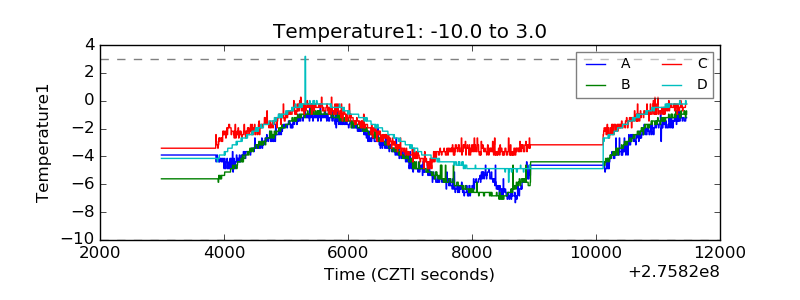 |
| Veto HV Monitor | 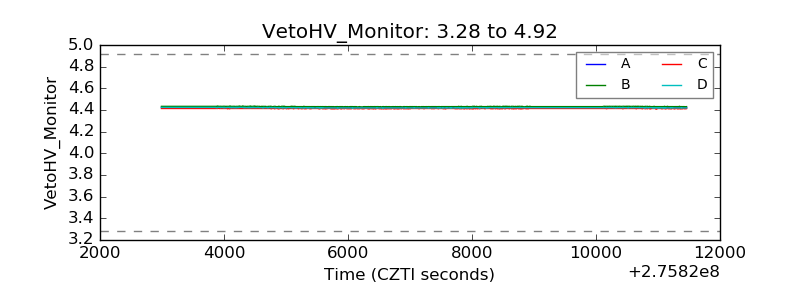 |
| Veto LLD | 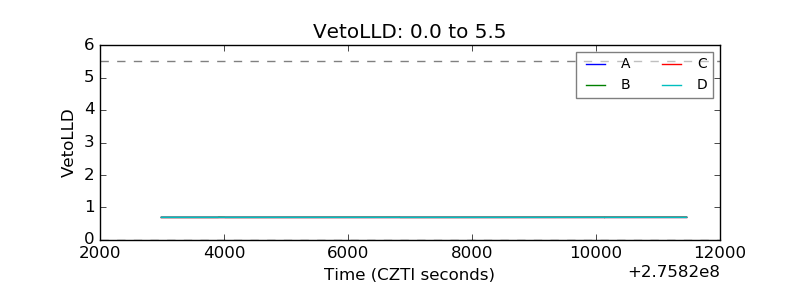 |
| Alpha Counter | 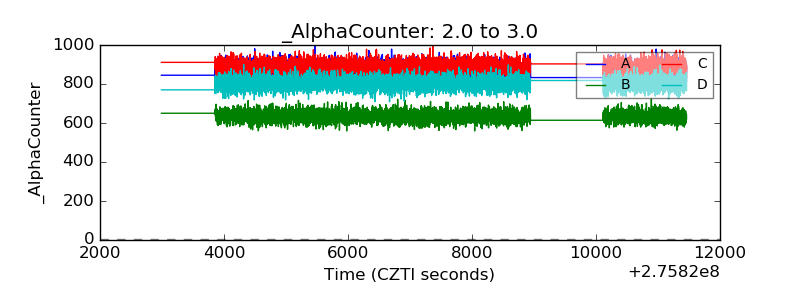 |
| _CPM_Rate | 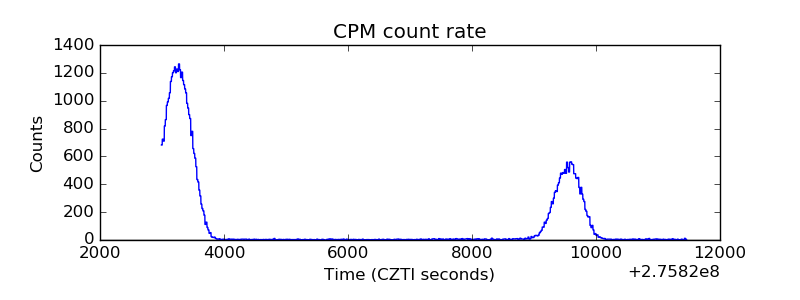 |
| CZT Counter | 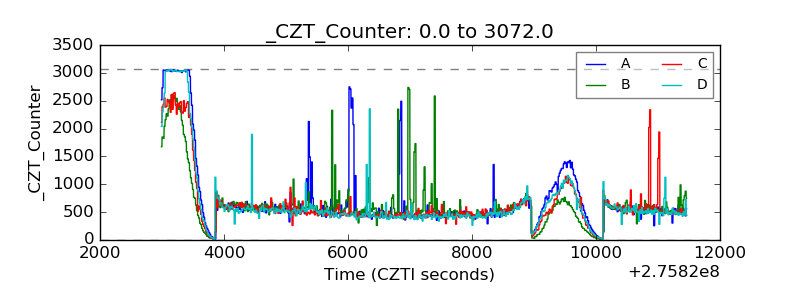 |
| +2.5 Volts monitor |  |
| +5 Volts monitor | 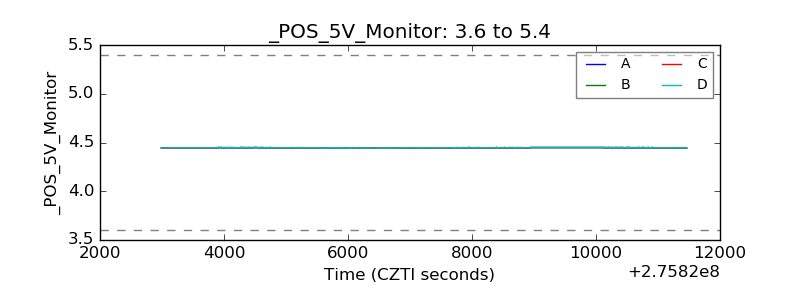 |
| _ROLL_ROT | 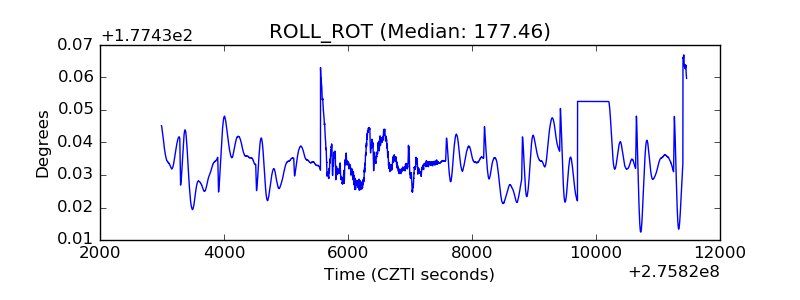 |
| _Roll_DEC | 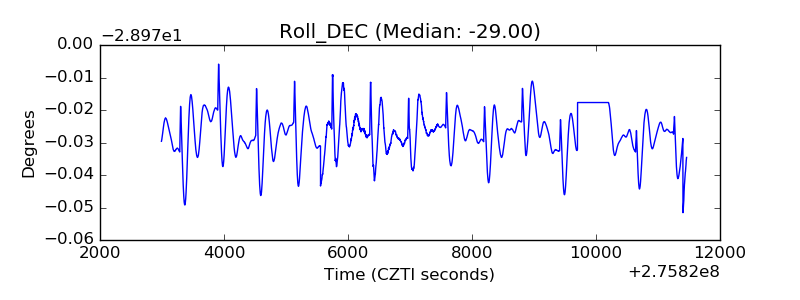 |
| _Roll_RA | 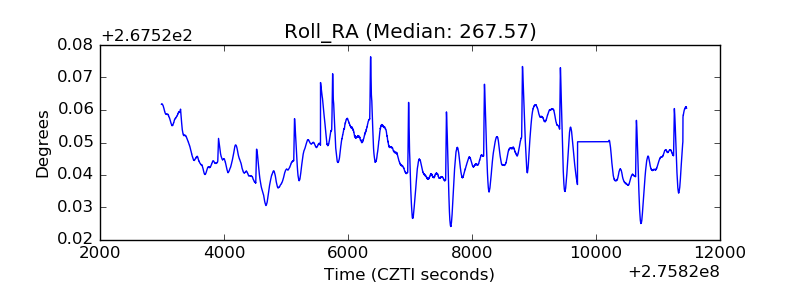 |
| Veto Counter | 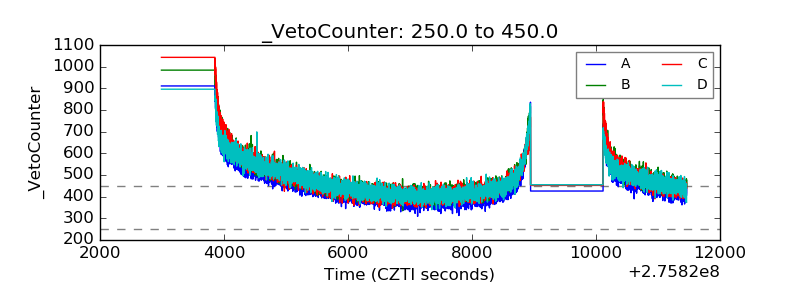 |