| Param | Original file | Final file |
|---|---|---|
| Filename | modeM0/AS1T02_112T01_9000002390_16228cztM0_level2.evt | modeM0/AS1T02_112T01_9000002390_16228cztM0_level2_quad_clean.evt |
| Size (bytes) | 506,206,080 | 109,402,560 |
| Size | 482.8 MB | 104.3 MB |
| Events in quadrant A | 3,485,209 | 718,587 |
| Events in quadrant B | 4,319,730 | 711,791 |
| Events in quadrant C | 3,684,930 | 704,759 |
| Events in quadrant D | 3,372,265 | 697,637 |
| Mode SS | |||
|---|---|---|---|
| Quadrant | BADHDUFLAG | Total packets | Discarded packets |
| A | 0 | 138 | 0 |
| B | 0 | 138 | 0 |
| C | 0 | 138 | 0 |
| D | 0 | 138 | 0 |
| Mode M9 | |||
|---|---|---|---|
| Quadrant | BADHDUFLAG | Total packets | Discarded packets |
| A | 0 | 9 | 0 |
| B | 0 | 9 | 0 |
| C | 0 | 9 | 0 |
| D | 0 | 9 | 0 |
| Mode M0 | |||
|---|---|---|---|
| Quadrant | BADHDUFLAG | Total packets | Discarded packets |
| A | 0 | 14712 | 2 |
| B | 0 | 17300 | 1 |
| C | 0 | 15500 | 1 |
| D | 0 | 14583 | 1 |
| Quadrant | Total seconds | Saturated seconds | Saturation percentage |
|---|---|---|---|
| A | 6905 | 116 | 1.679942% |
| B | 6905 | 212 | 3.070239% |
| C | 6905 | 135 | 1.955105% |
| D | 6905 | 68 | 0.984794% |
Noise dominated data is calculated using 1-second bins in cleaned event files. If a bin has >2000 counts, and if more than 50% of those come from <1% of pixels, then it is considered to be noise-dominated and hence unusable.
| Quadrant | # 1 sec bins | Bins with >0 counts | Bins with >2000 counts | High rate bins dominated by noise | Noise dominated (total time) | Noise dominated (detector-on time) | Marked lightcurve |
|---|---|---|---|---|---|---|---|
| A | 7772 | 6908 | 20 | 20 | 0.26% | 0.29% | 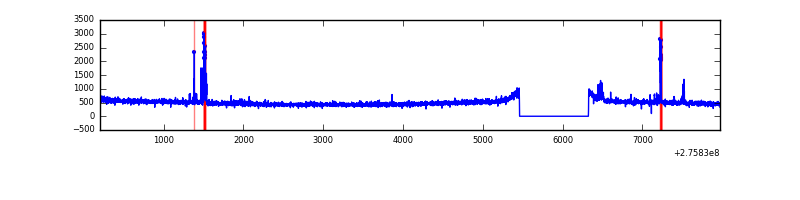 |
| B | 7772 | 6908 | 80 | 80 | 1.03% | 1.16% | 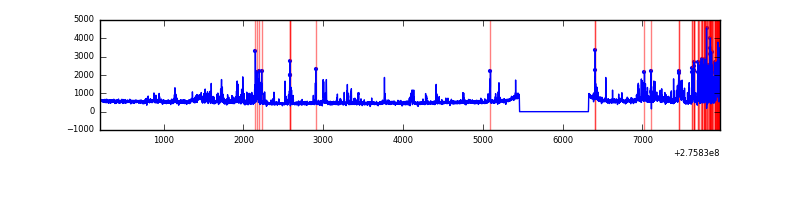 |
| C | 7772 | 6908 | 10 | 10 | 0.13% | 0.14% | 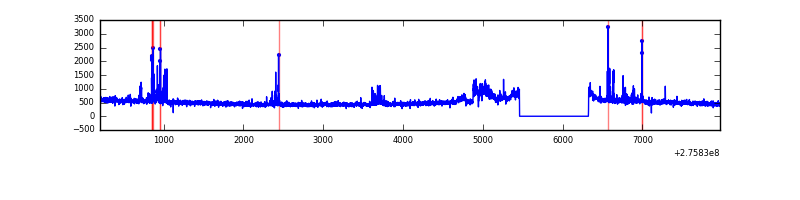 |
| D | 7772 | 6908 | 16 | 16 | 0.21% | 0.23% | 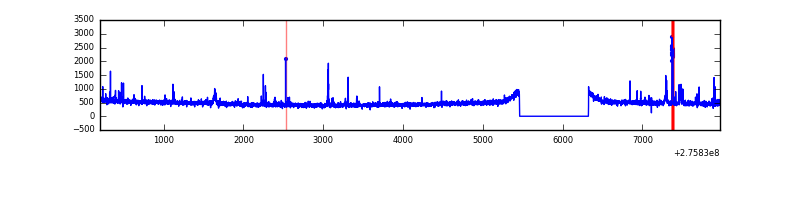 |
Top three noisy pixels from each quadrant. If the there are fewer than three noisy pixels in the level2.evt file, extra rows are filled as -1
| Pixel properties | Quadrant properties | ||||||
|---|---|---|---|---|---|---|---|
| Quadrant | DetID | PixID | Counts | Sigma | Mean | Median | Sigma |
| A | 15 | 174 | 103416 | 582.79 | 872 | 857 | 176.0 |
| A | 13 | 248 | 16489 | 88.83 | 872 | 857 | 176.0 |
| A | 0 | 226 | 7768 | 39.27 | 872 | 857 | 176.0 |
| B | 7 | 220 | 377407 | 2290.95 | 861 | 839 | 164.4 |
| B | 4 | 173 | 171404 | 1037.68 | 861 | 839 | 164.4 |
| B | 0 | 219 | 113246 | 683.86 | 861 | 839 | 164.4 |
| C | 3 | 233 | 193063 | 1003.83 | 825 | 832 | 191.5 |
| C | 0 | 207 | 134904 | 700.12 | 825 | 832 | 191.5 |
| C | 14 | 238 | 125841 | 652.79 | 825 | 832 | 191.5 |
| D | 15 | 0 | 75378 | 356.22 | 851 | 828 | 209.3 |
| D | 1 | 52 | 36249 | 169.25 | 851 | 828 | 209.3 |
| D | 2 | 234 | 27476 | 127.33 | 851 | 828 | 209.3 |
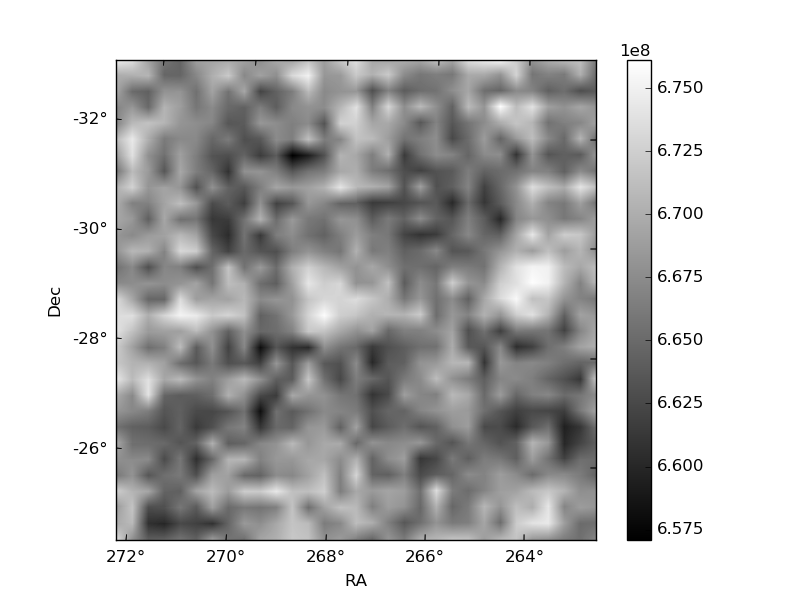
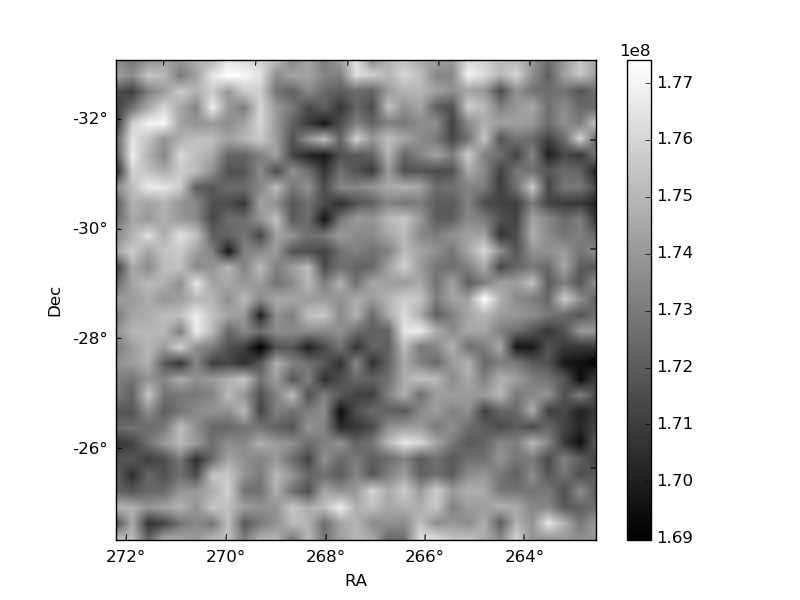
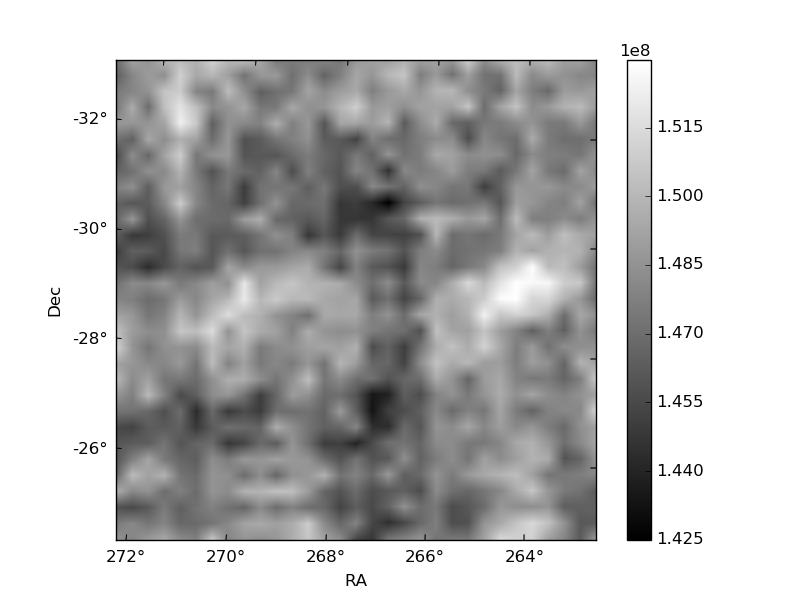
Histogram calculated using DETX and DETY for each event in the final _common_clean file
| Quadrant A | 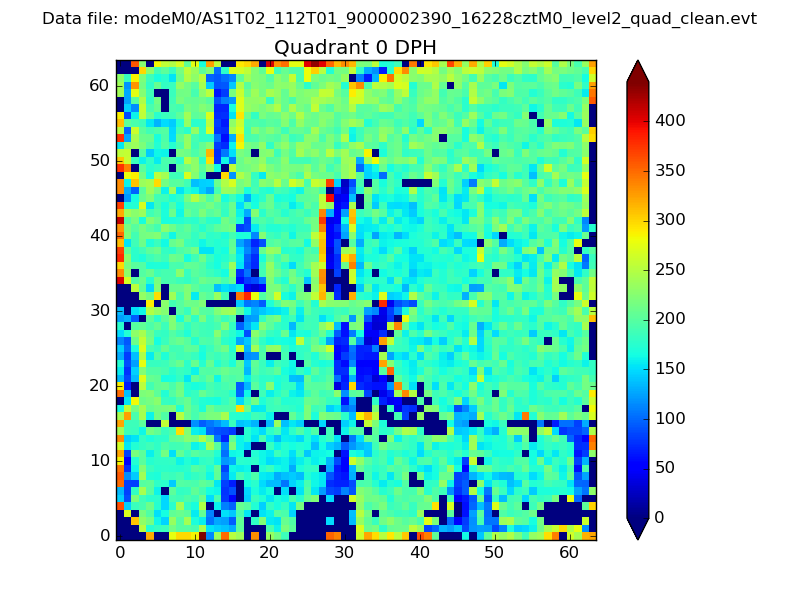 |
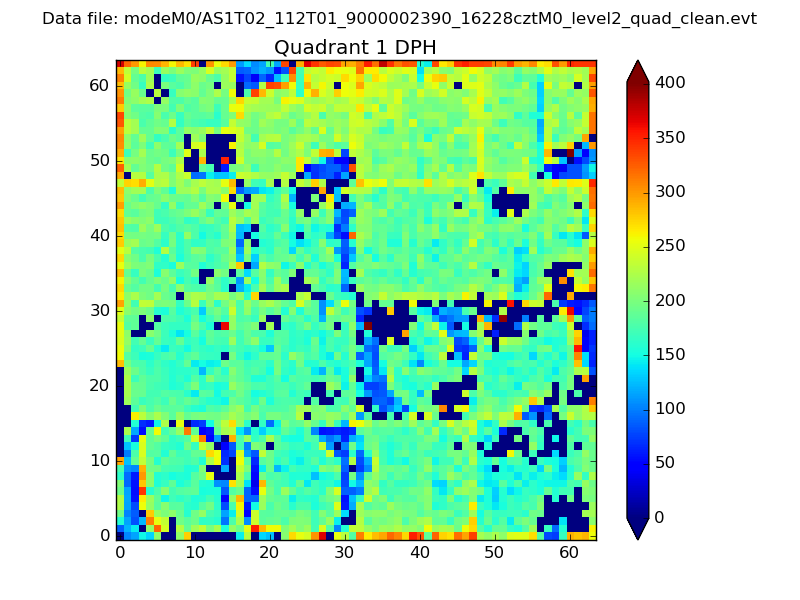 |
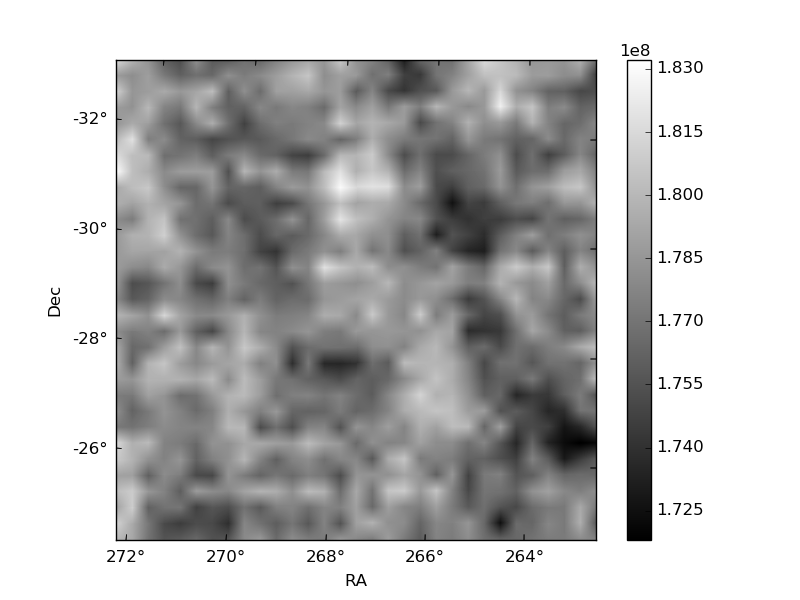
Quadrant B |
|---|---|---|---|
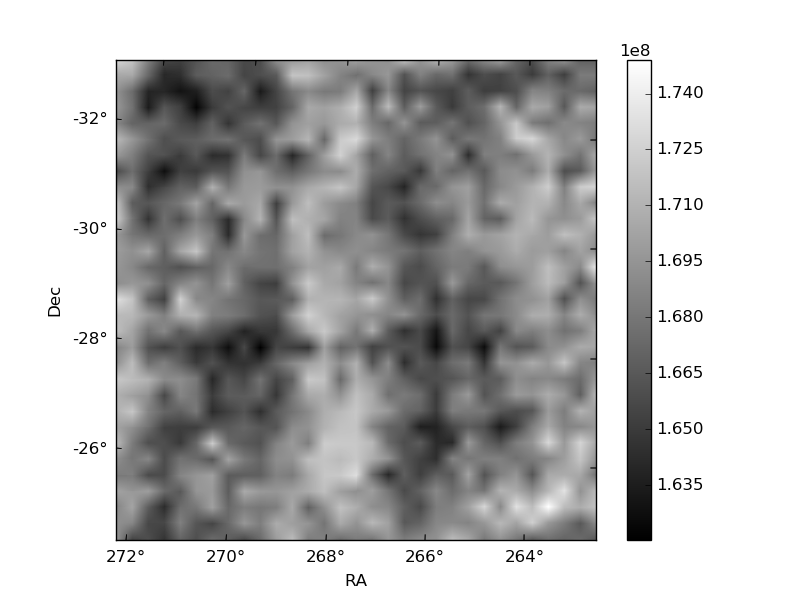
| Quadrant D | 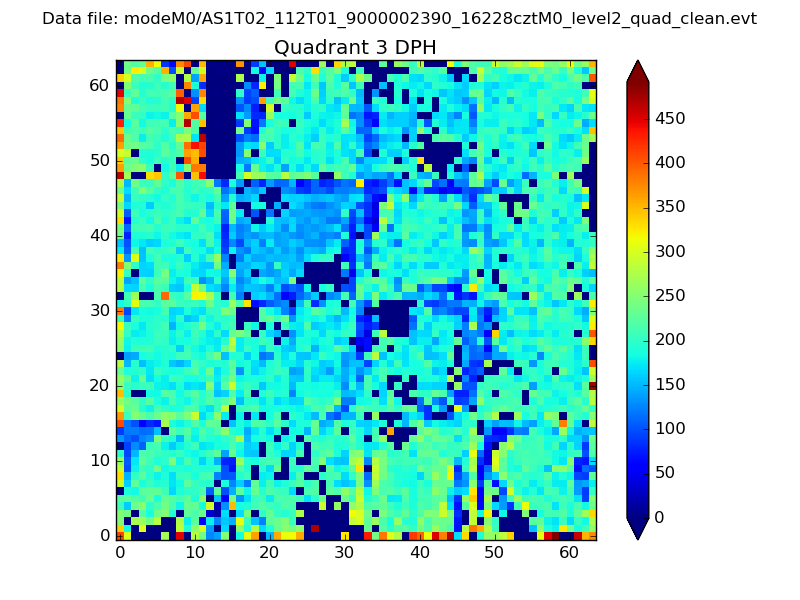 |
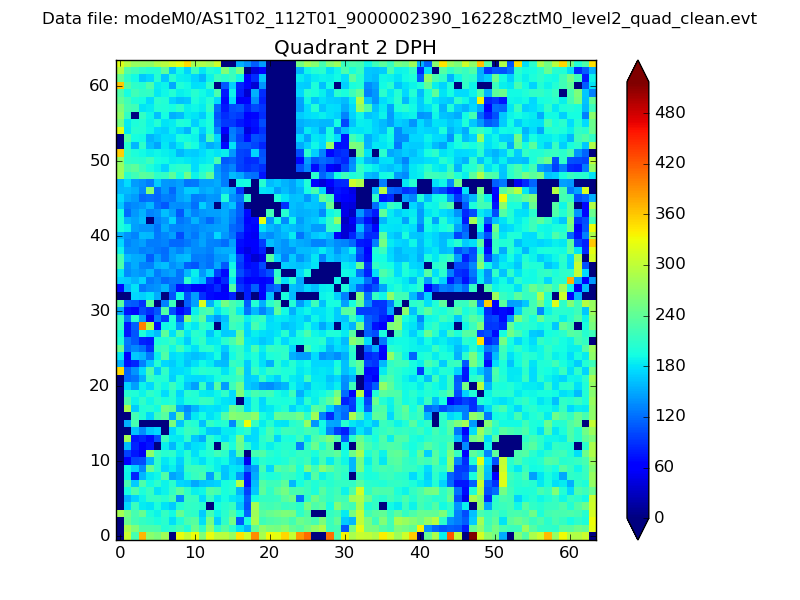 |
Quadrant C |
| Plot type | Count rate plots | Images |
|---|---|---|
| Comparison with Poisson distribution Blue bars denote a histogram of data divided into 1 sec bins. Red curve is a Poisson curve with rate = median count rate of data. |
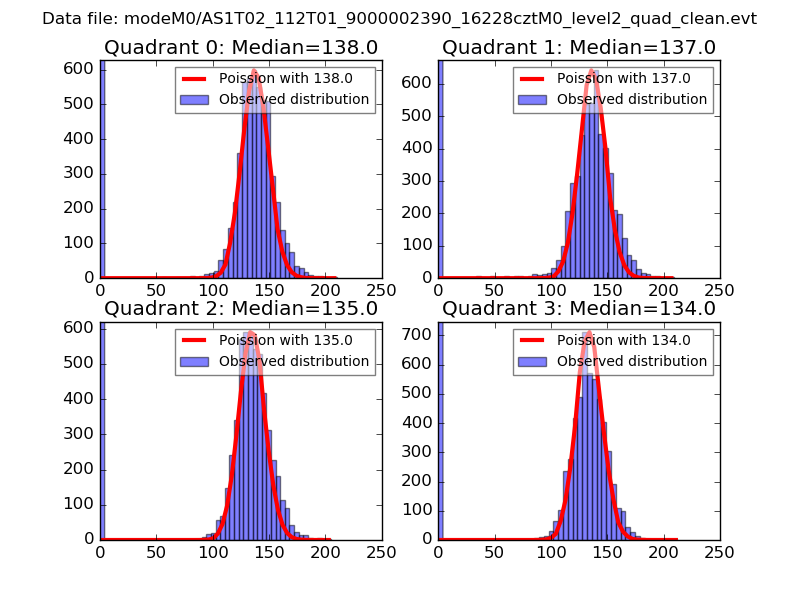 |
 |
| Quadrant-wise count rates Data is divided into 100 sec bins |
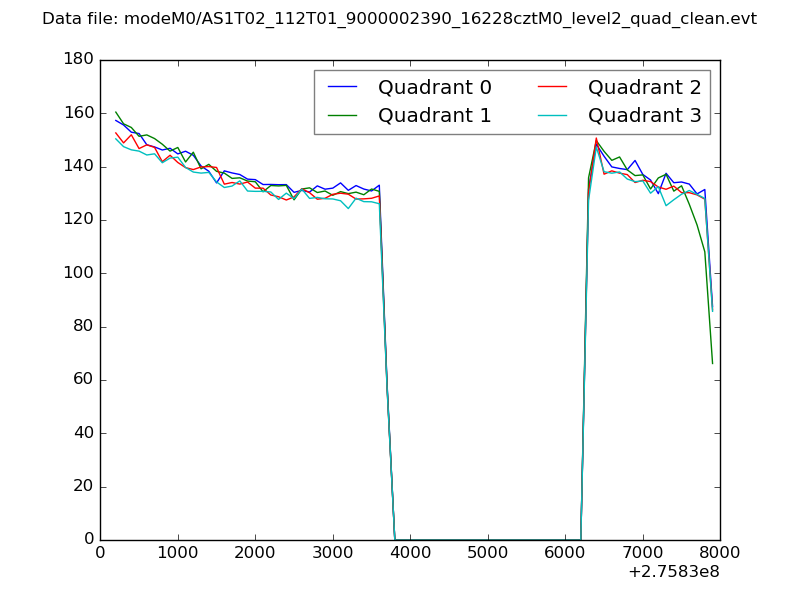 |
|
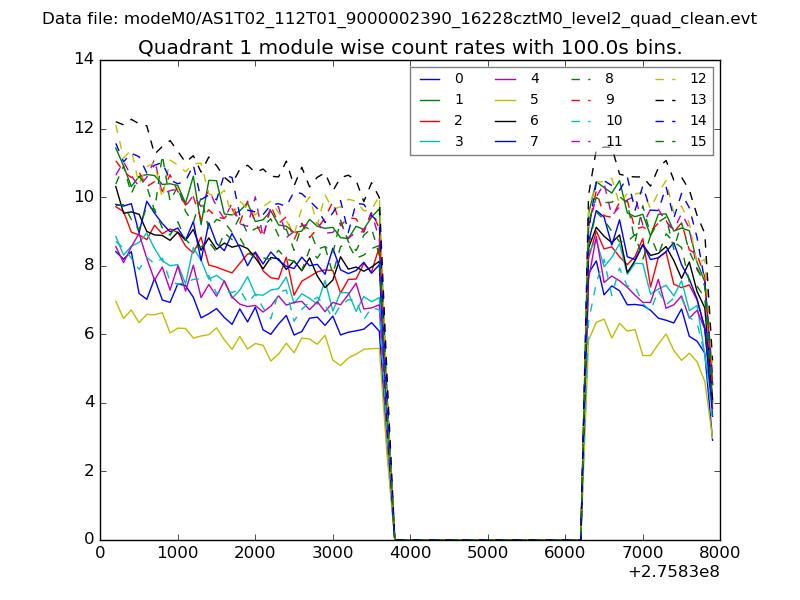
| Module-wise count rates for Quadrant A Data is divided into 100 sec bins |
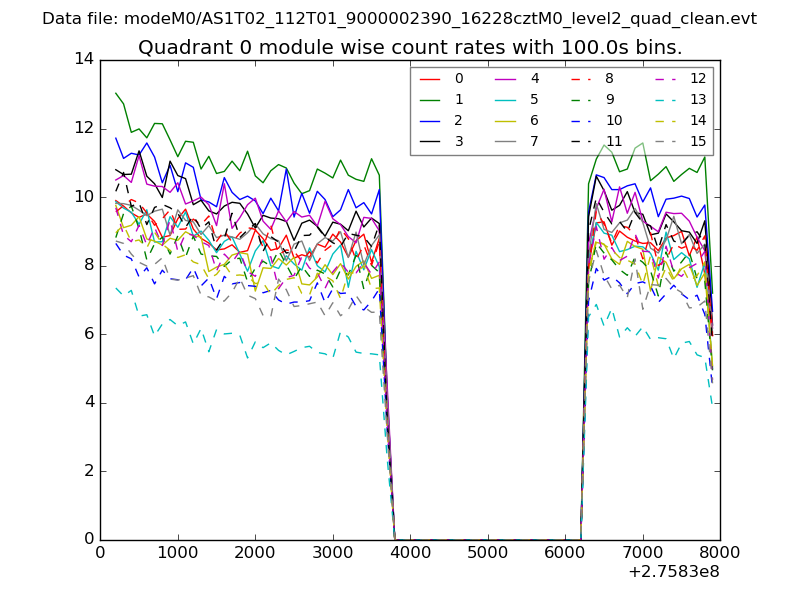 |
 |
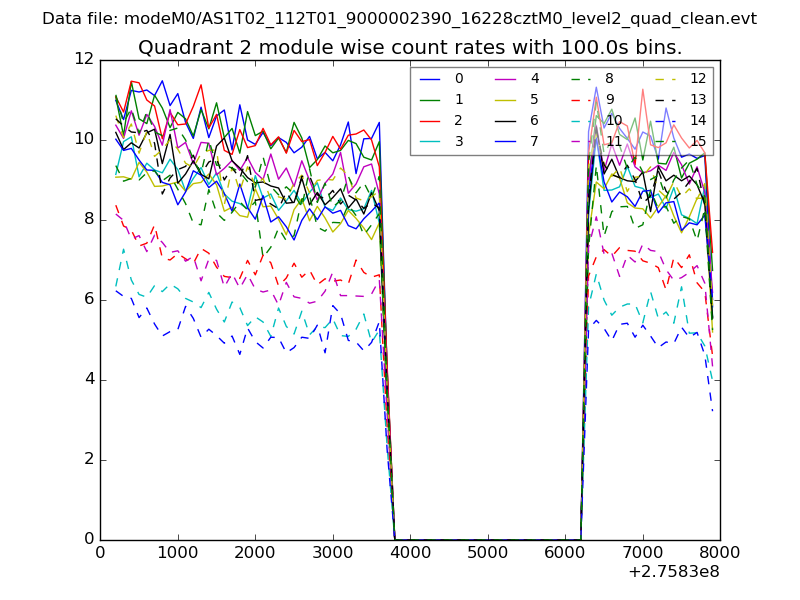
| Module-wise count rates for Quadrant B Data is divided into 100 sec bins |
 |
 |
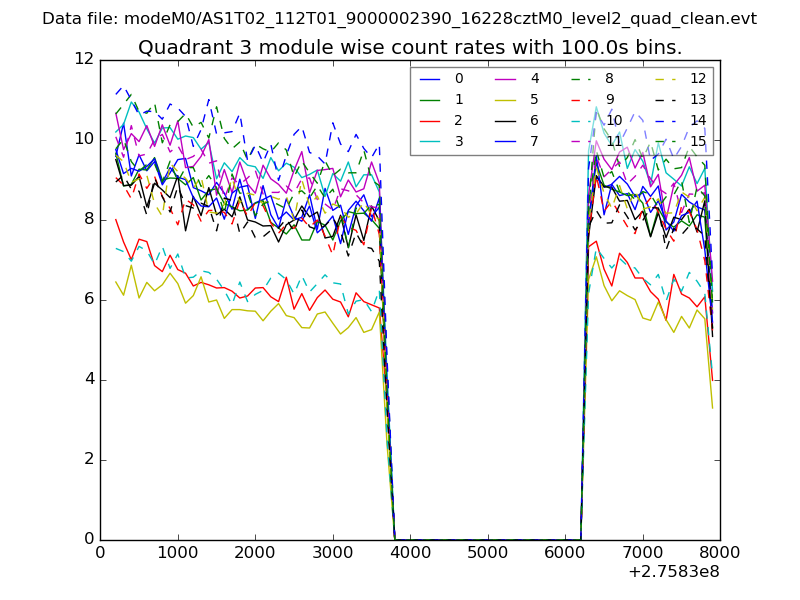
| Module-wise count rates for Quadrant C Data is divided into 100 sec bins |
 |
 |
| Module-wise count rates for Quadrant D Data is divided into 100 sec bins |
 |
 |
| Parameter | Plot |
|---|---|
| CZT HV Monitor | 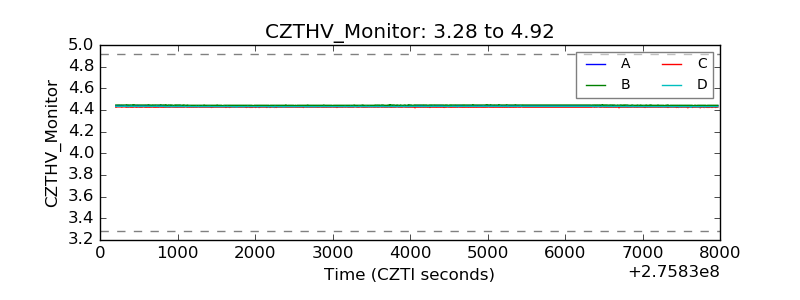 |
| D_VDD | 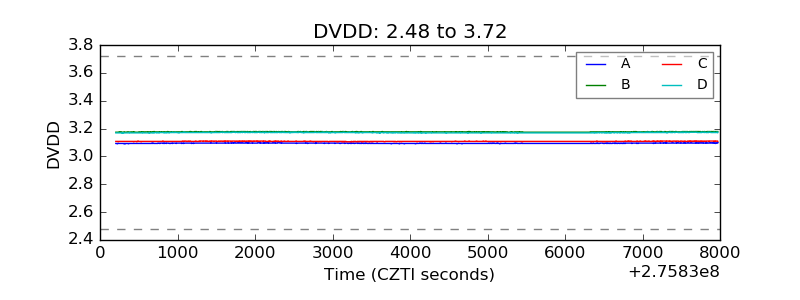 |
| Temperature 1 | 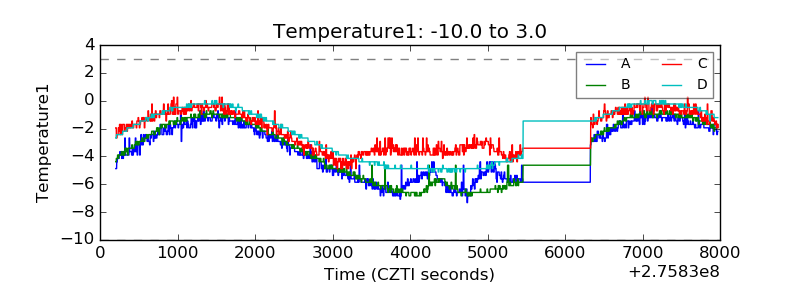 |
| Veto HV Monitor | 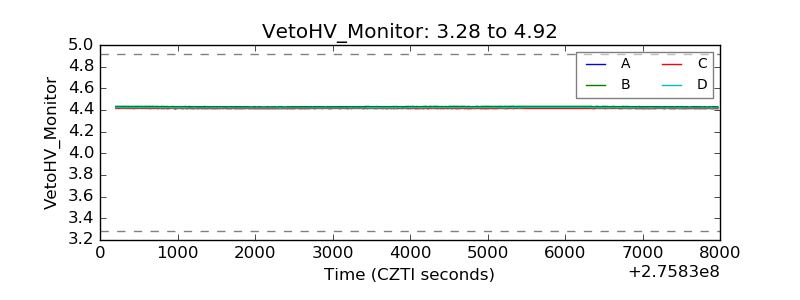 |
| Veto LLD | 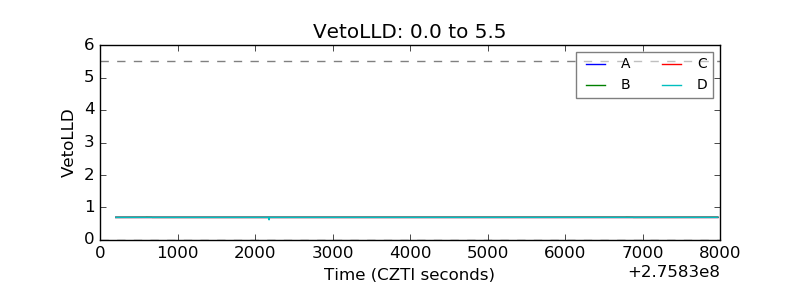 |
| Alpha Counter | 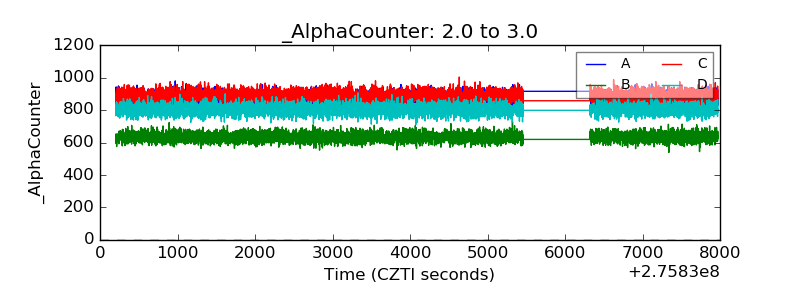 |
| _CPM_Rate | 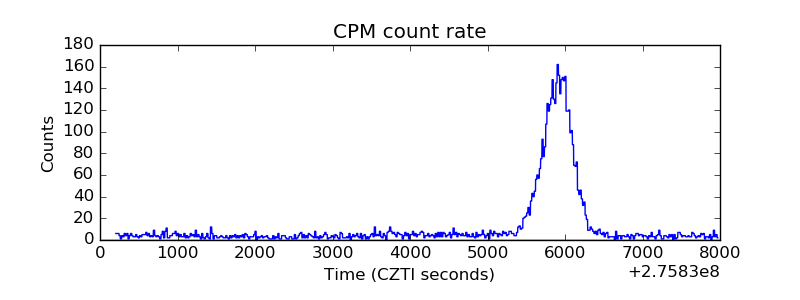 |
| CZT Counter | 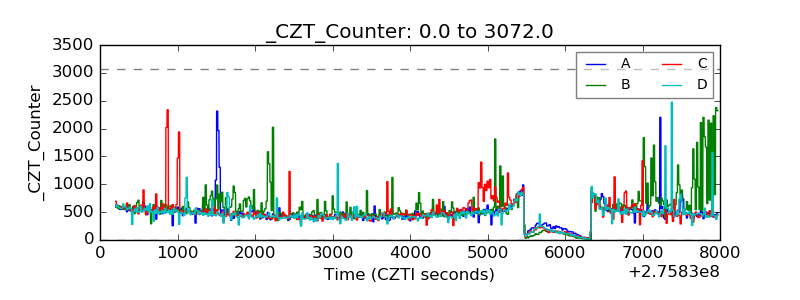 |
| +2.5 Volts monitor | 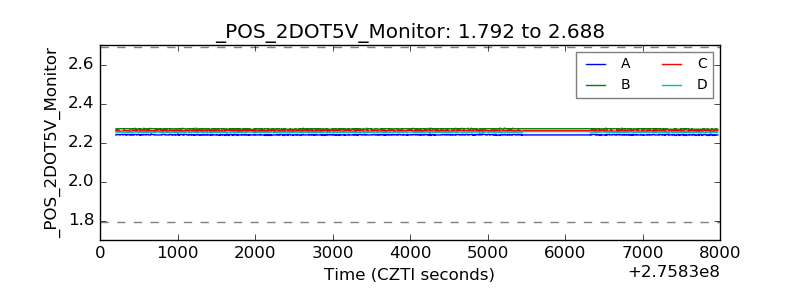 |
| +5 Volts monitor |  |
| _ROLL_ROT | 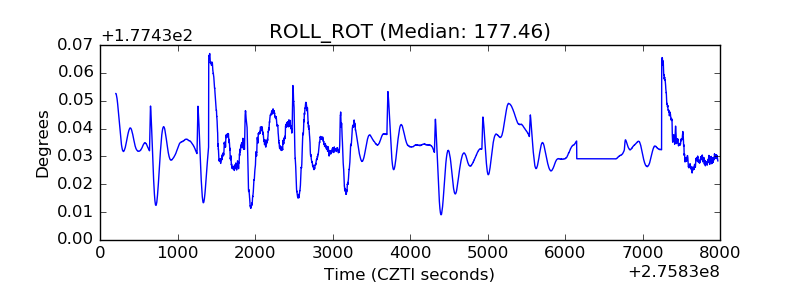 |
| _Roll_DEC | 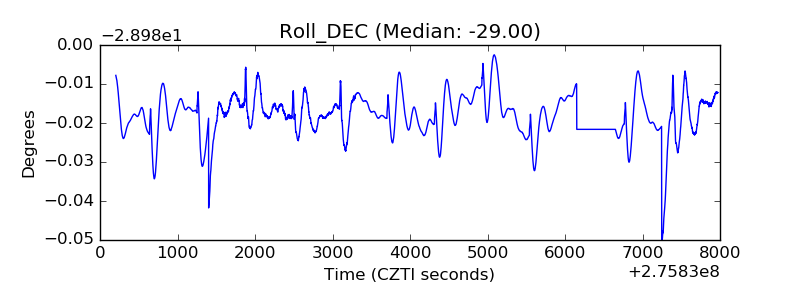 |
| _Roll_RA | 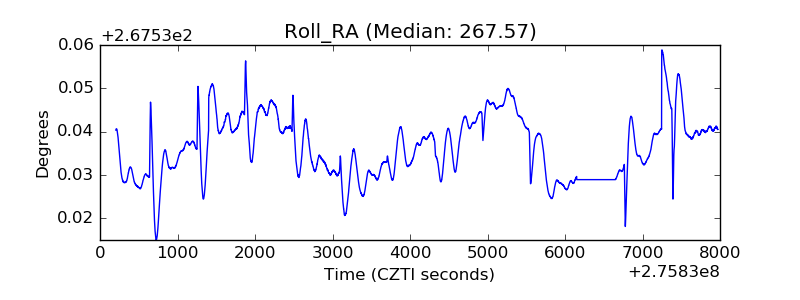 |
| Veto Counter | 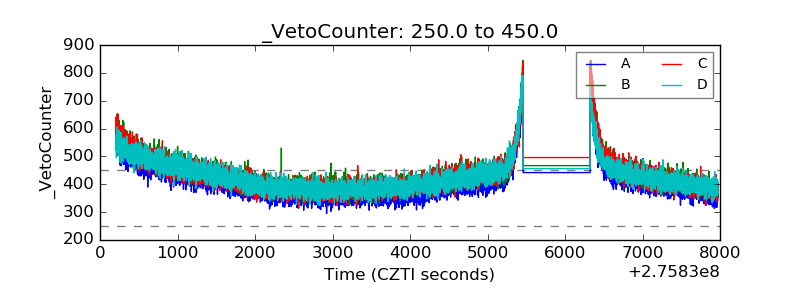 |