| Param | Original file | Final file |
|---|---|---|
| Filename | modeM0/AS1T02_112T01_9000002390_16229cztM0_level2.evt | modeM0/AS1T02_112T01_9000002390_16229cztM0_level2_quad_clean.evt |
| Size (bytes) | 525,182,400 | 98,611,200 |
| Size | 500.9 MB | 94.0 MB |
| Events in quadrant A | 3,797,188 | 632,905 |
| Events in quadrant B | 4,611,196 | 622,369 |
| Events in quadrant C | 3,622,053 | 626,654 |
| Events in quadrant D | 3,402,450 | 619,397 |
| Mode SS | |||
|---|---|---|---|
| Quadrant | BADHDUFLAG | Total packets | Discarded packets |
| A | 0 | 142 | 0 |
| B | 0 | 142 | 0 |
| C | 0 | 142 | 0 |
| D | 0 | 142 | 0 |
| Mode M9 | |||
|---|---|---|---|
| Quadrant | BADHDUFLAG | Total packets | Discarded packets |
| A | 0 | 4 | 0 |
| B | 0 | 4 | 0 |
| C | 0 | 4 | 0 |
| D | 0 | 4 | 0 |
| Mode M0 | |||
|---|---|---|---|
| Quadrant | BADHDUFLAG | Total packets | Discarded packets |
| A | 0 | 15839 | 2 |
| B | 0 | 18227 | 1 |
| C | 0 | 15039 | 1 |
| D | 0 | 14861 | 1 |
| Quadrant | Total seconds | Saturated seconds | Saturation percentage |
|---|---|---|---|
| A | 6957 | 122 | 1.753629% |
| B | 6957 | 350 | 5.030904% |
| C | 6957 | 104 | 1.494897% |
| D | 6957 | 72 | 1.034929% |
Noise dominated data is calculated using 1-second bins in cleaned event files. If a bin has >2000 counts, and if more than 50% of those come from <1% of pixels, then it is considered to be noise-dominated and hence unusable.
| Quadrant | # 1 sec bins | Bins with >0 counts | Bins with >2000 counts | High rate bins dominated by noise | Noise dominated (total time) | Noise dominated (detector-on time) | Marked lightcurve |
|---|---|---|---|---|---|---|---|
| A | 7414 | 6960 | 27 | 27 | 0.36% | 0.39% | 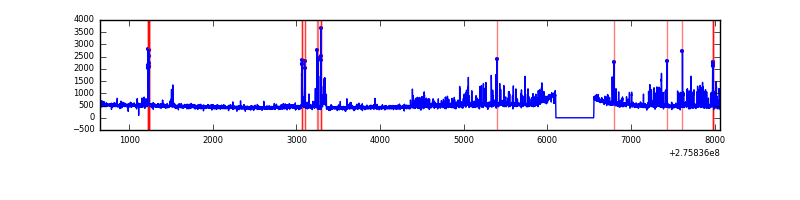 |
| B | 7414 | 6960 | 181 | 181 | 2.44% | 2.60% | 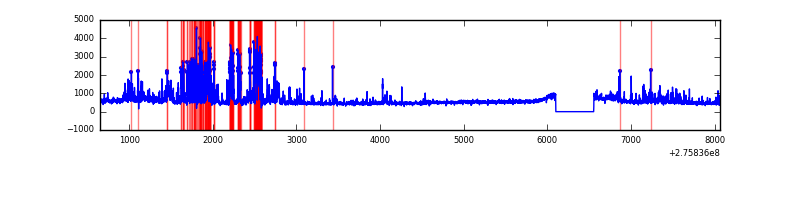 |
| C | 7414 | 6960 | 8 | 8 | 0.11% | 0.11% | 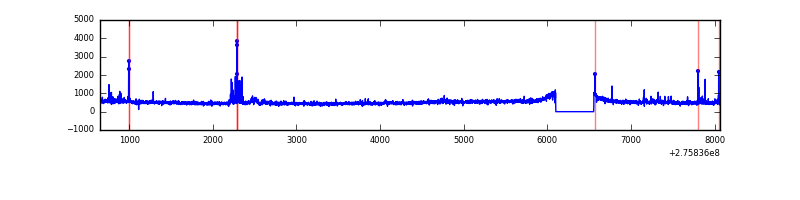 |
| D | 7414 | 6960 | 28 | 28 | 0.38% | 0.40% | 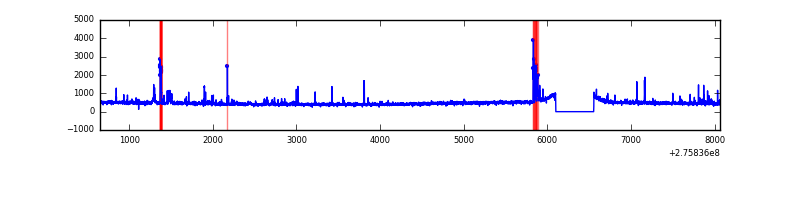 |
Top three noisy pixels from each quadrant. If the there are fewer than three noisy pixels in the level2.evt file, extra rows are filled as -1
| Pixel properties | Quadrant properties | ||||||
|---|---|---|---|---|---|---|---|
| Quadrant | DetID | PixID | Counts | Sigma | Mean | Median | Sigma |
| A | 0 | 253 | 278962 | 1601.55 | 857 | 839 | 173.7 |
| A | 15 | 174 | 130038 | 743.98 | 857 | 839 | 173.7 |
| A | 4 | 2 | 27823 | 155.38 | 857 | 839 | 173.7 |
| B | 7 | 220 | 777021 | 4801.68 | 842 | 822 | 161.7 |
| B | 4 | 173 | 166257 | 1023.4 | 842 | 822 | 161.7 |
| B | 0 | 219 | 139235 | 856.24 | 842 | 822 | 161.7 |
| C | 3 | 233 | 174499 | 914.14 | 816 | 822 | 190.0 |
| C | 14 | 238 | 123282 | 644.56 | 816 | 822 | 190.0 |
| C | 0 | 207 | 103889 | 542.49 | 816 | 822 | 190.0 |
| D | 1 | 52 | 119958 | 578.33 | 832 | 808 | 206.0 |
| D | 15 | 0 | 90781 | 436.71 | 832 | 808 | 206.0 |
| D | 2 | 234 | 27279 | 128.48 | 832 | 808 | 206.0 |
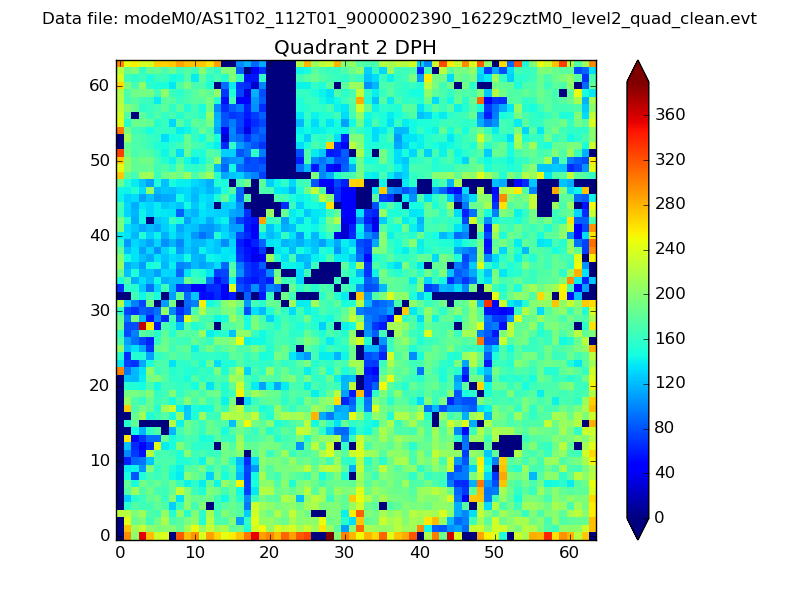
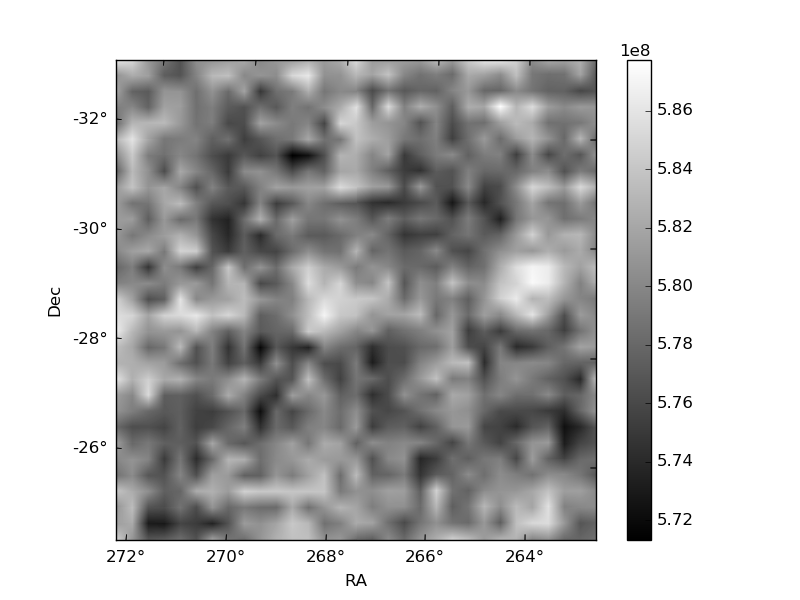
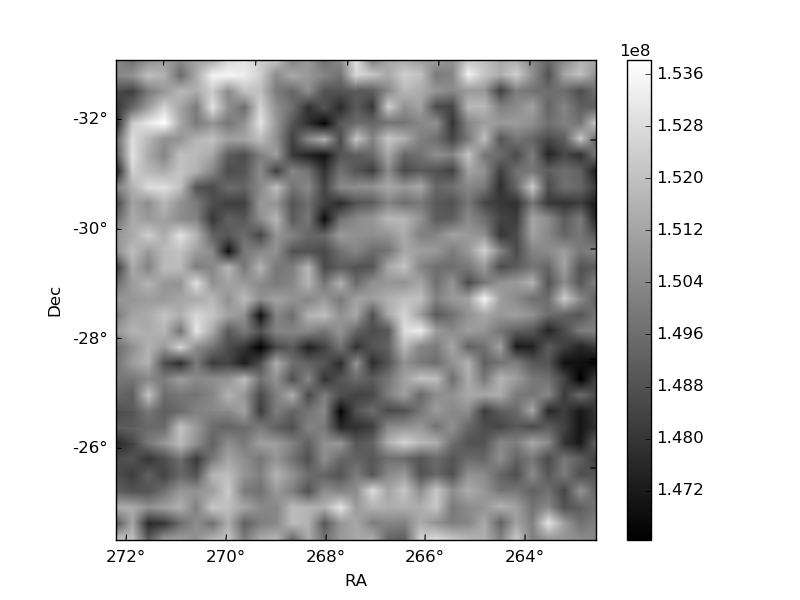
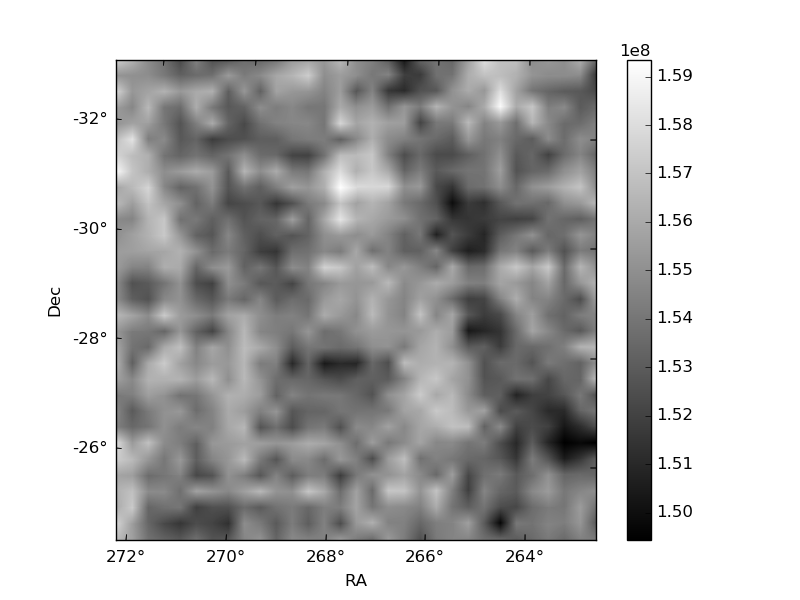
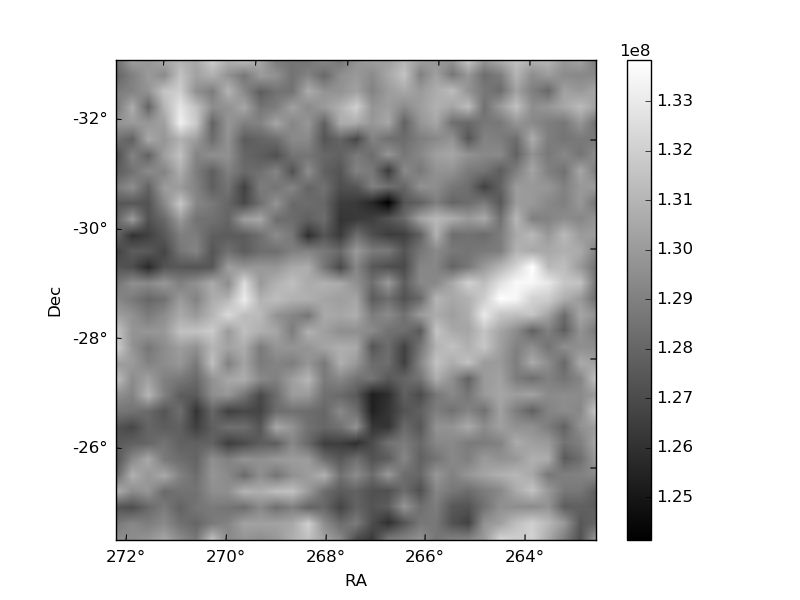
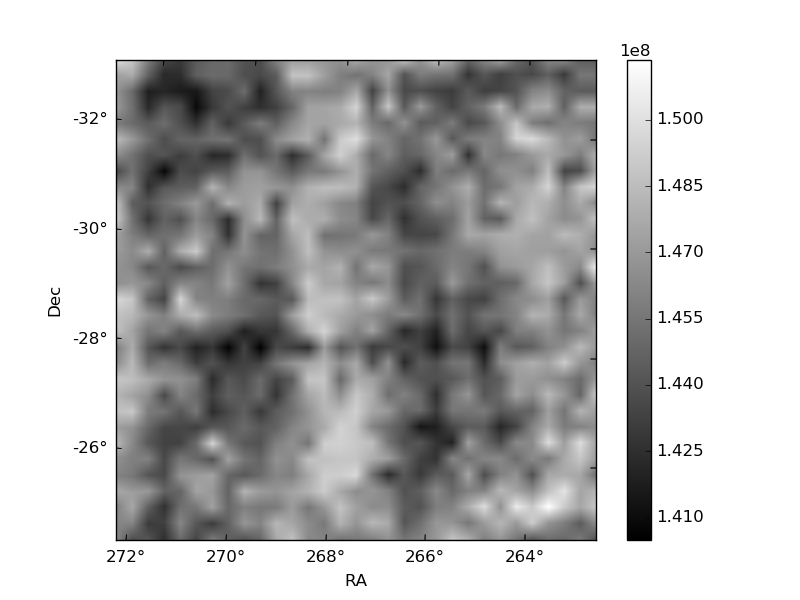
Histogram calculated using DETX and DETY for each event in the final _common_clean file
| Quadrant A | 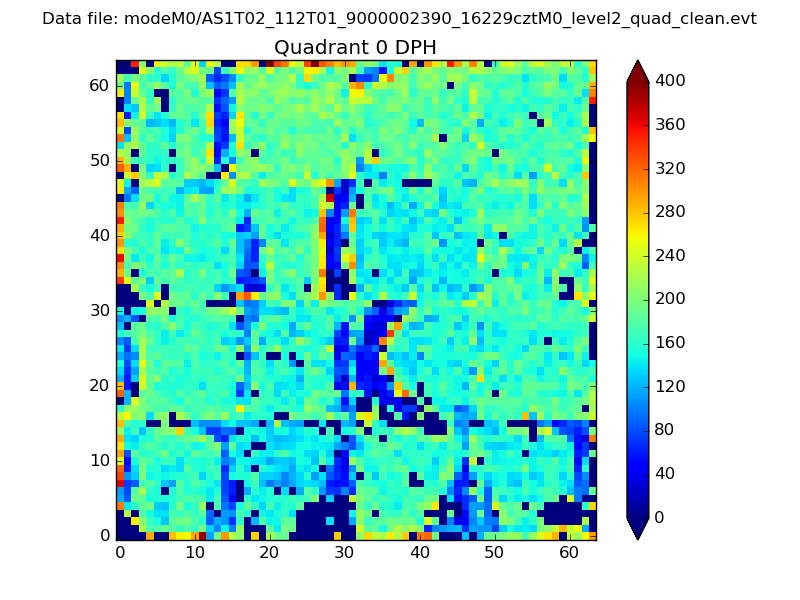 |
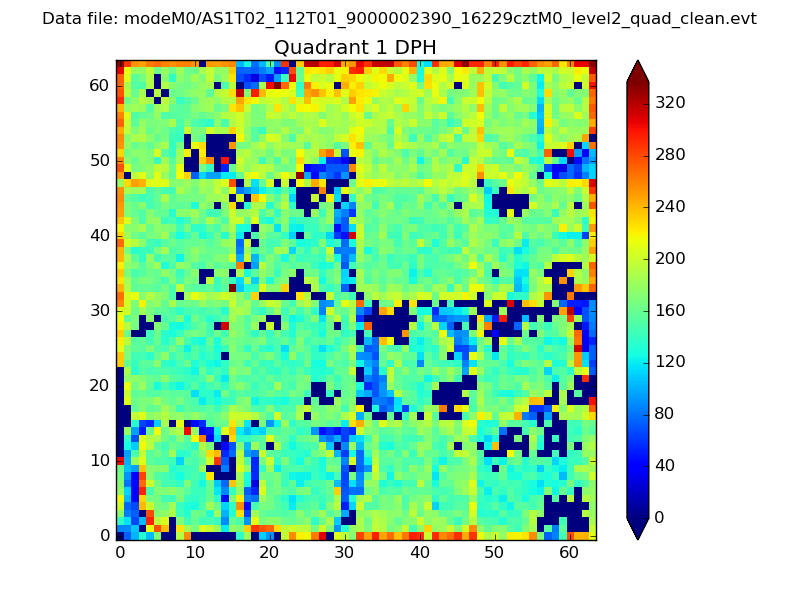 |
Quadrant B |
|---|---|---|---|
| Quadrant D | 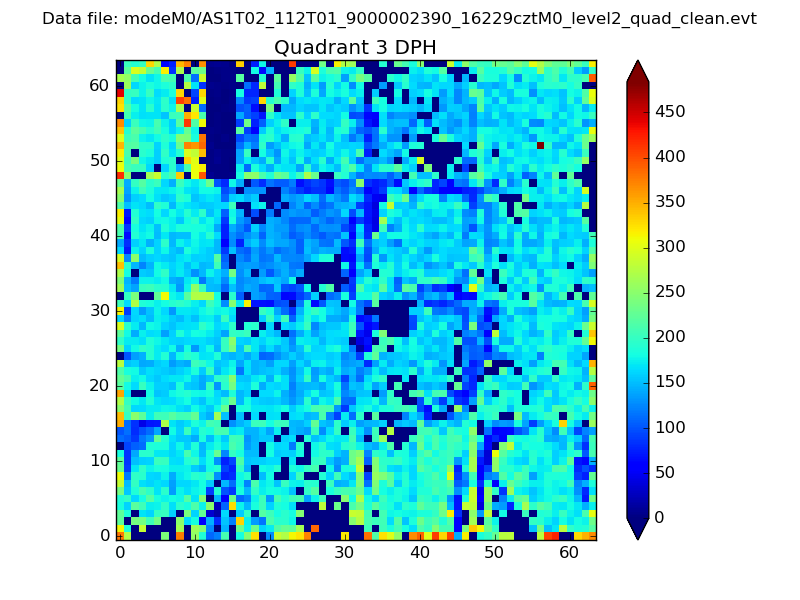 |
 |
Quadrant C |
| Plot type | Count rate plots | Images |
|---|---|---|
| Comparison with Poisson distribution Blue bars denote a histogram of data divided into 1 sec bins. Red curve is a Poisson curve with rate = median count rate of data. |
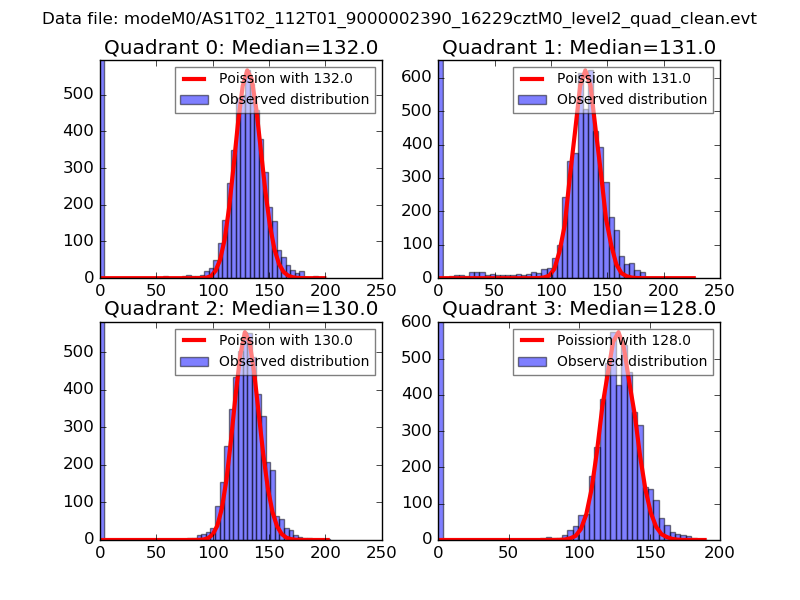 |
 |
| Quadrant-wise count rates Data is divided into 100 sec bins |
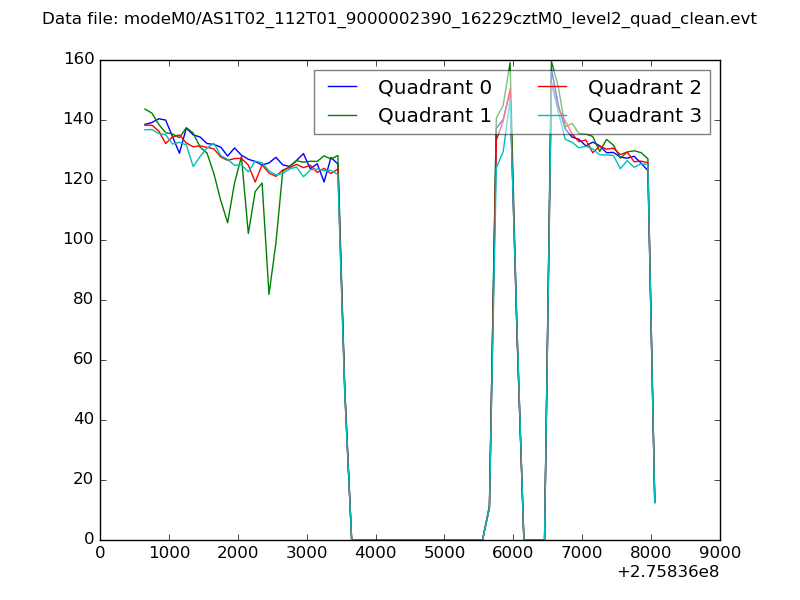 |
|
| Module-wise count rates for Quadrant A Data is divided into 100 sec bins |
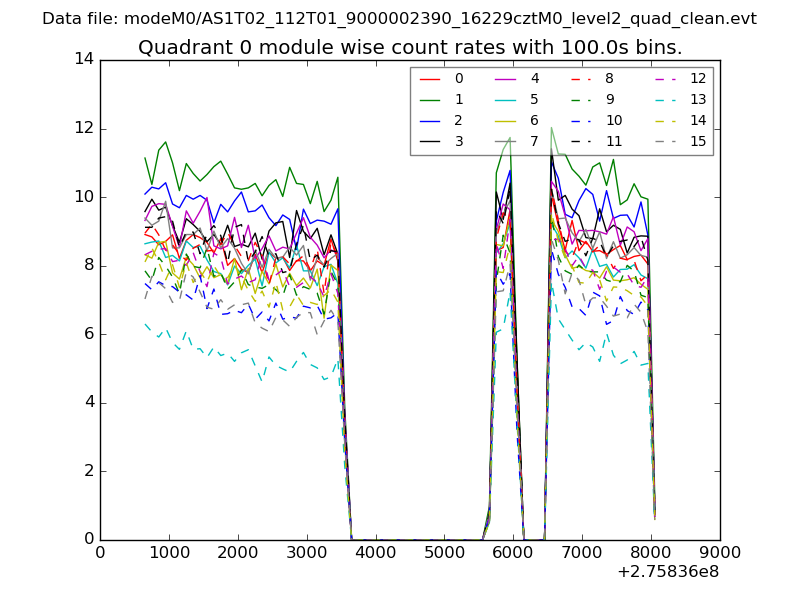 |
 |
| Module-wise count rates for Quadrant B Data is divided into 100 sec bins |
 |
 |
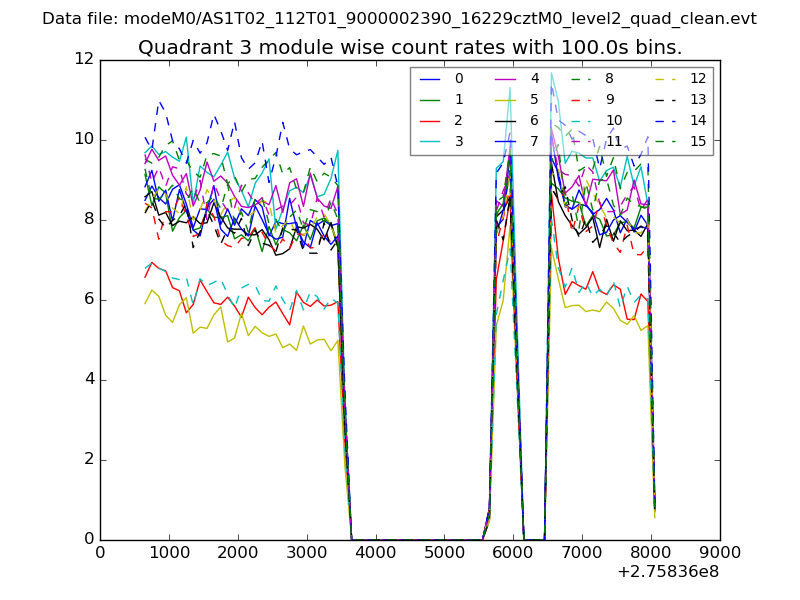
| Module-wise count rates for Quadrant C Data is divided into 100 sec bins |
 |
 |
| Module-wise count rates for Quadrant D Data is divided into 100 sec bins |
 |
 |
| Parameter | Plot |
|---|---|
| CZT HV Monitor |  |
| D_VDD | 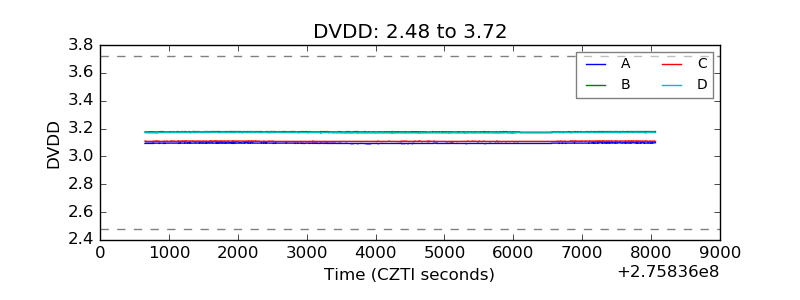 |
| Temperature 1 | 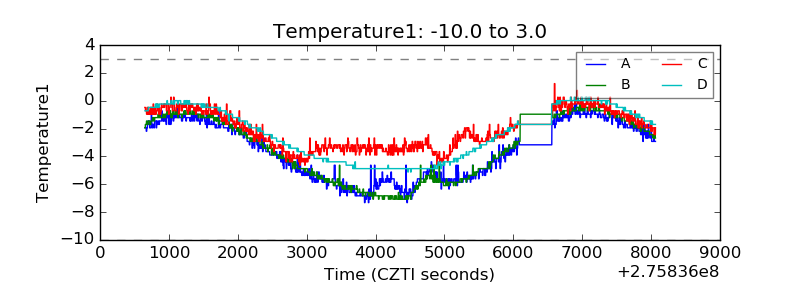 |
| Veto HV Monitor | 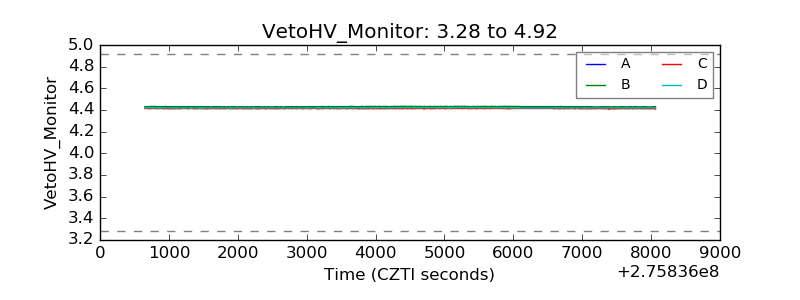 |
| Veto LLD | 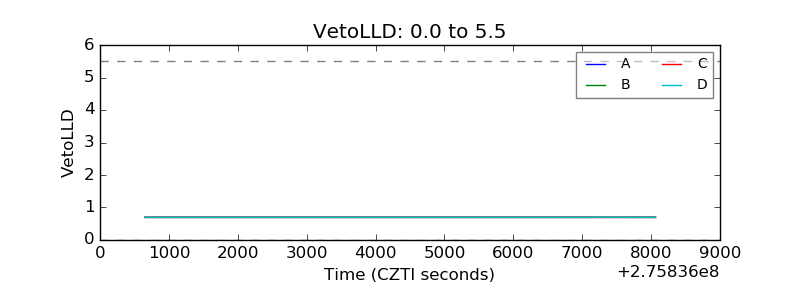 |
| Alpha Counter | 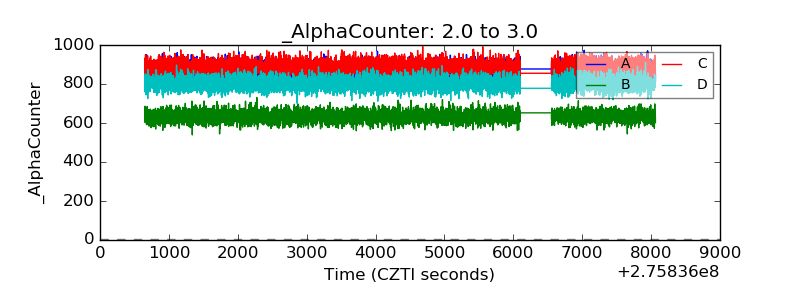 |
| _CPM_Rate | 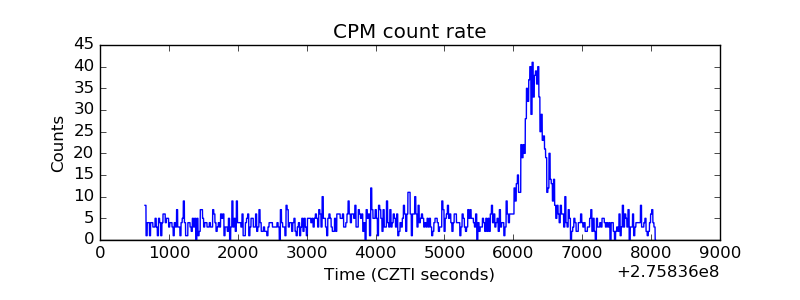 |
| CZT Counter | 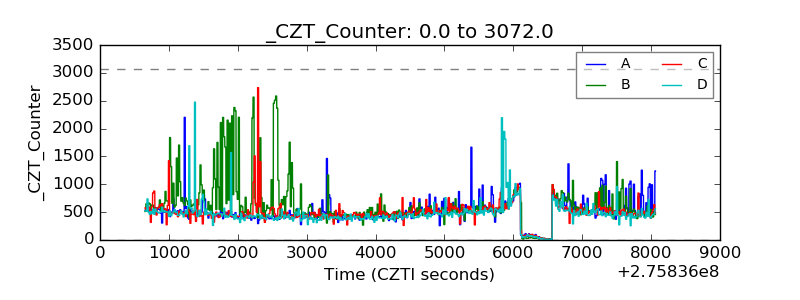 |
| +2.5 Volts monitor |  |
| +5 Volts monitor |  |
| _ROLL_ROT | 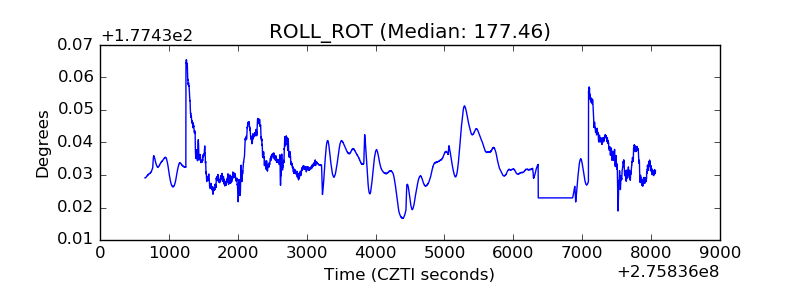 |
| _Roll_DEC | 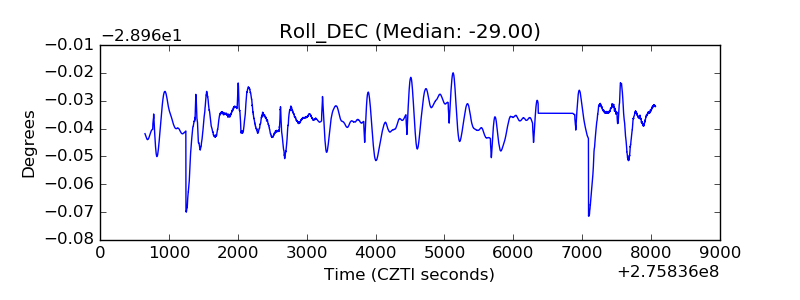 |
| _Roll_RA | 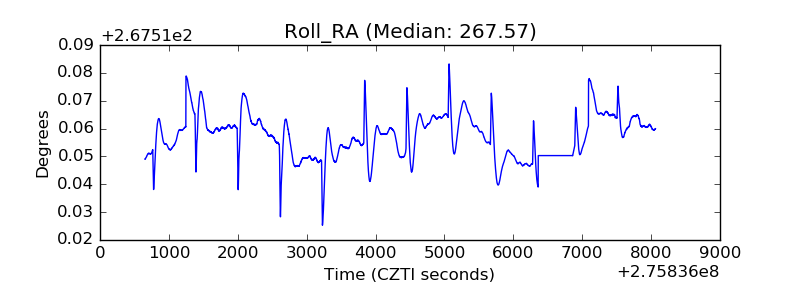 |
| Veto Counter | 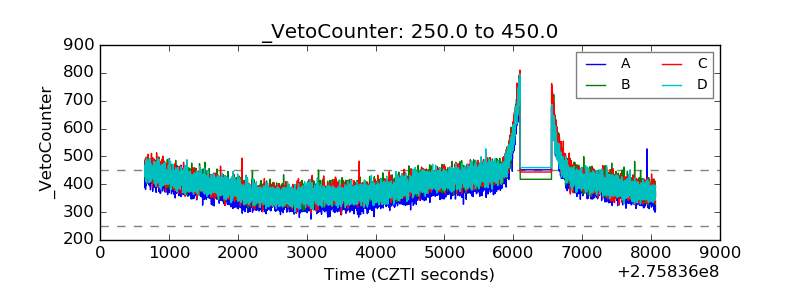 |