| Param | Original file | Final file |
|---|---|---|
| Filename | modeM0/AS1T02_112T01_9000002390_16230cztM0_level2.evt | modeM0/AS1T02_112T01_9000002390_16230cztM0_level2_quad_clean.evt |
| Size (bytes) | 542,831,040 | 100,719,360 |
| Size | 517.7 MB | 96.1 MB |
| Events in quadrant A | 3,994,458 | 642,123 |
| Events in quadrant B | 4,004,138 | 653,006 |
| Events in quadrant C | 4,157,091 | 632,471 |
| Events in quadrant D | 3,801,360 | 626,816 |
| Mode SS | |||
|---|---|---|---|
| Quadrant | BADHDUFLAG | Total packets | Discarded packets |
| A | 0 | 144 | 0 |
| B | 0 | 144 | 0 |
| C | 0 | 144 | 0 |
| D | 0 | 144 | 0 |
| Mode M9 | |||
|---|---|---|---|
| Quadrant | BADHDUFLAG | Total packets | Discarded packets |
| A | 0 | 3 | 0 |
| B | 0 | 3 | 0 |
| C | 0 | 3 | 0 |
| D | 0 | 3 | 0 |
| Mode M0 | |||
|---|---|---|---|
| Quadrant | BADHDUFLAG | Total packets | Discarded packets |
| A | 0 | 16484 | 2 |
| B | 0 | 16493 | 1 |
| C | 0 | 16694 | 1 |
| D | 0 | 16383 | 1 |
| Quadrant | Total seconds | Saturated seconds | Saturation percentage |
|---|---|---|---|
| A | 7120 | 102 | 1.432584% |
| B | 7120 | 94 | 1.320225% |
| C | 7120 | 248 | 3.483146% |
| D | 7120 | 95 | 1.334270% |
Noise dominated data is calculated using 1-second bins in cleaned event files. If a bin has >2000 counts, and if more than 50% of those come from <1% of pixels, then it is considered to be noise-dominated and hence unusable.
| Quadrant | # 1 sec bins | Bins with >0 counts | Bins with >2000 counts | High rate bins dominated by noise | Noise dominated (total time) | Noise dominated (detector-on time) | Marked lightcurve |
|---|---|---|---|---|---|---|---|
| A | 7366 | 7122 | 47 | 47 | 0.64% | 0.66% | 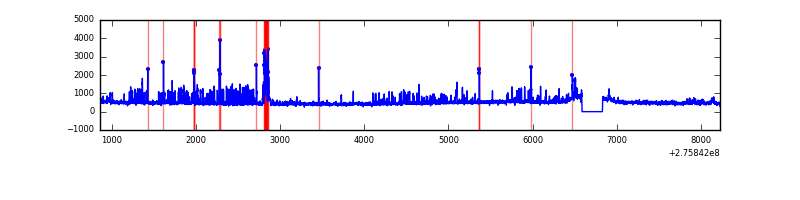 |
| B | 7366 | 7122 | 17 | 17 | 0.23% | 0.24% | 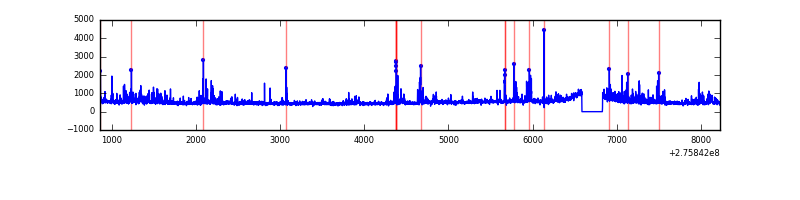 |
| C | 7366 | 7122 | 59 | 59 | 0.80% | 0.83% | 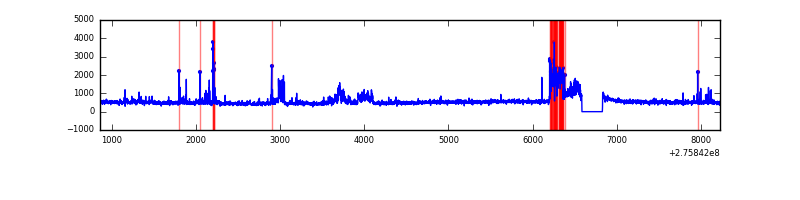 |
| D | 7366 | 7122 | 31 | 31 | 0.42% | 0.44% | 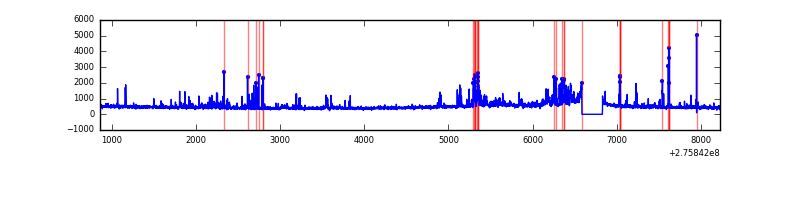 |
Top three noisy pixels from each quadrant. If the there are fewer than three noisy pixels in the level2.evt file, extra rows are filled as -1
| Pixel properties | Quadrant properties | ||||||
|---|---|---|---|---|---|---|---|
| Quadrant | DetID | PixID | Counts | Sigma | Mean | Median | Sigma |
| A | 0 | 253 | 443973 | 2526.99 | 862 | 845 | 175.4 |
| A | 15 | 174 | 154453 | 875.97 | 862 | 845 | 175.4 |
| A | 8 | 247 | 32328 | 179.54 | 862 | 845 | 175.4 |
| B | 7 | 220 | 202136 | 1226.37 | 863 | 844 | 164.1 |
| B | 4 | 173 | 155842 | 944.33 | 863 | 844 | 164.1 |
| B | 0 | 219 | 51231 | 306.98 | 863 | 844 | 164.1 |
| C | 3 | 233 | 637469 | 3303.16 | 819 | 825 | 192.7 |
| C | 0 | 207 | 149886 | 773.39 | 819 | 825 | 192.7 |
| C | 14 | 238 | 126225 | 650.62 | 819 | 825 | 192.7 |
| D | 1 | 52 | 473050 | 2293.31 | 838 | 814 | 205.9 |
| D | 15 | 0 | 42321 | 201.57 | 838 | 814 | 205.9 |
| D | 10 | 70 | 39225 | 186.53 | 838 | 814 | 205.9 |
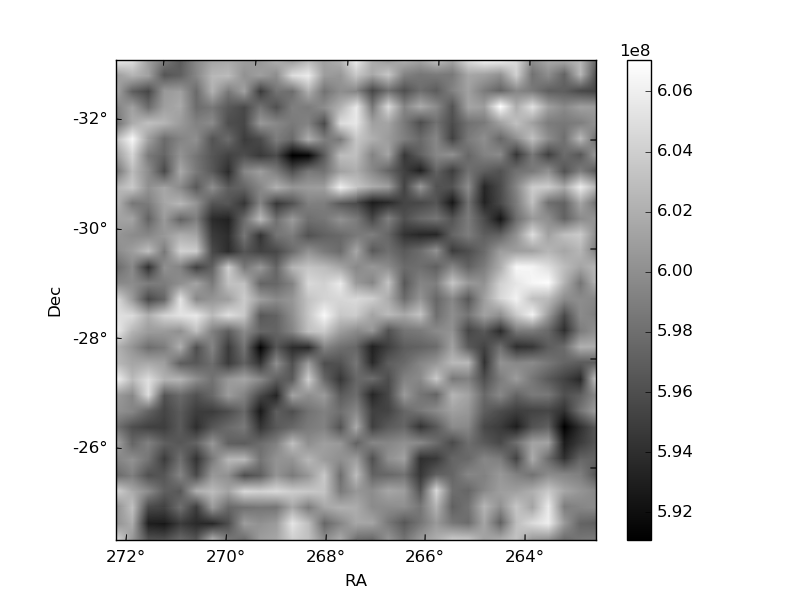
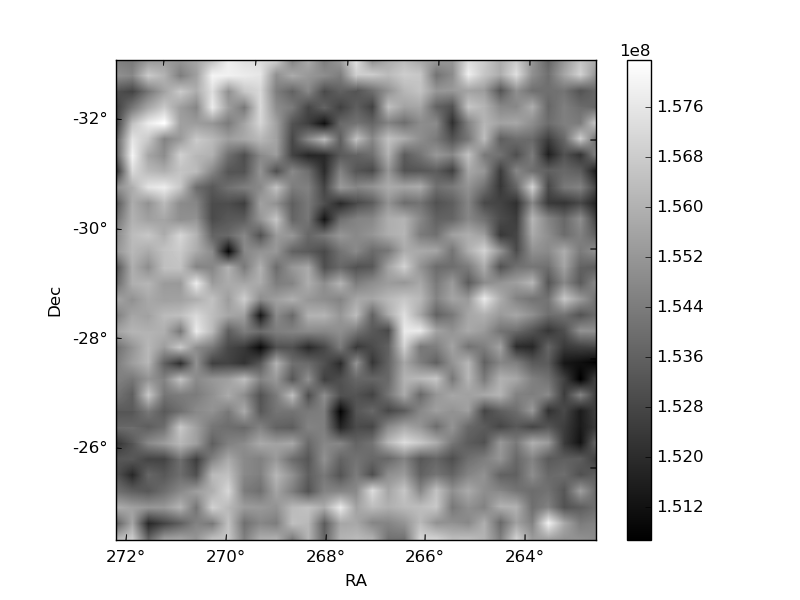
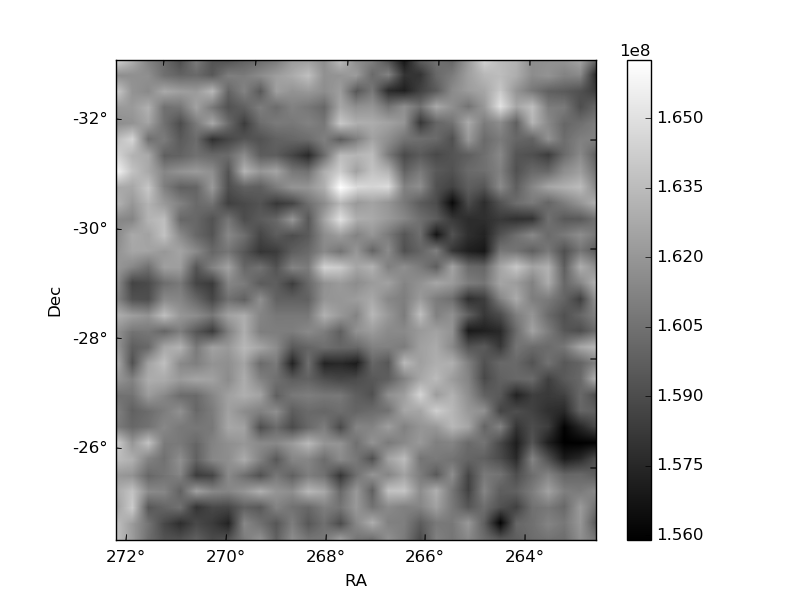
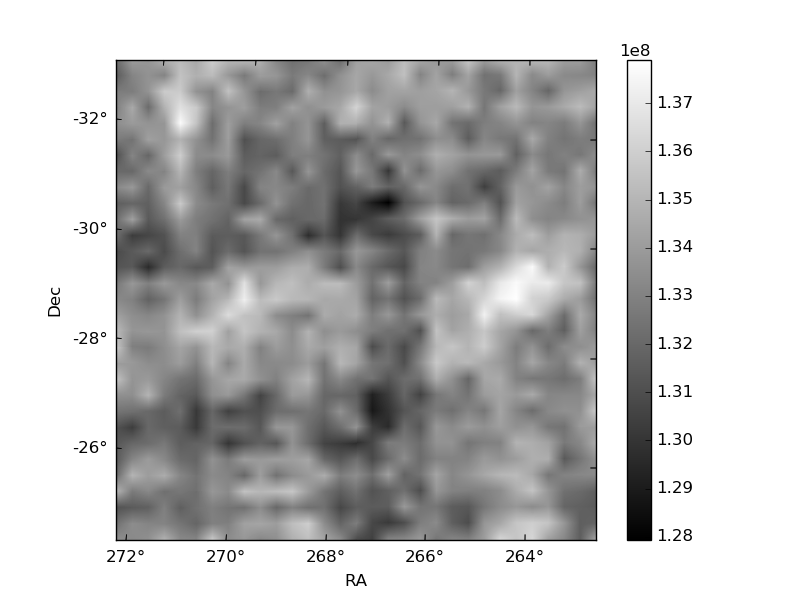
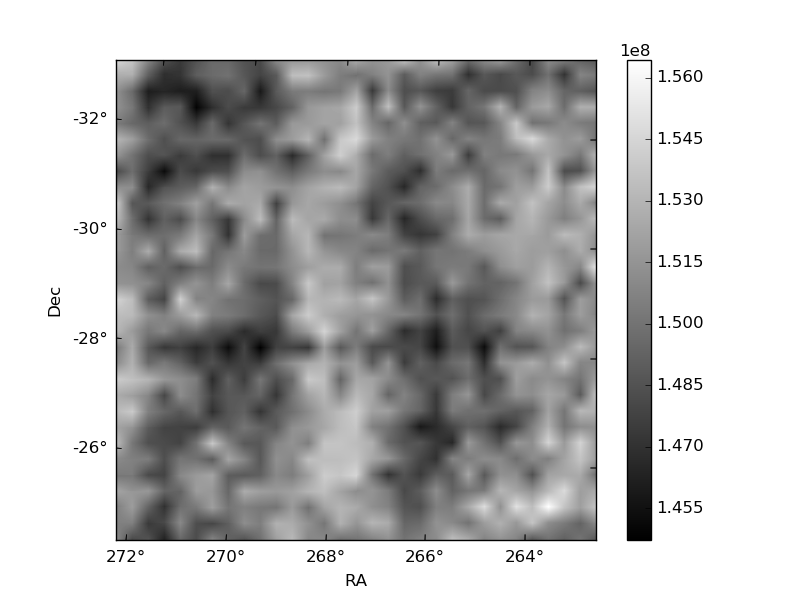
Histogram calculated using DETX and DETY for each event in the final _common_clean file
| Quadrant A | 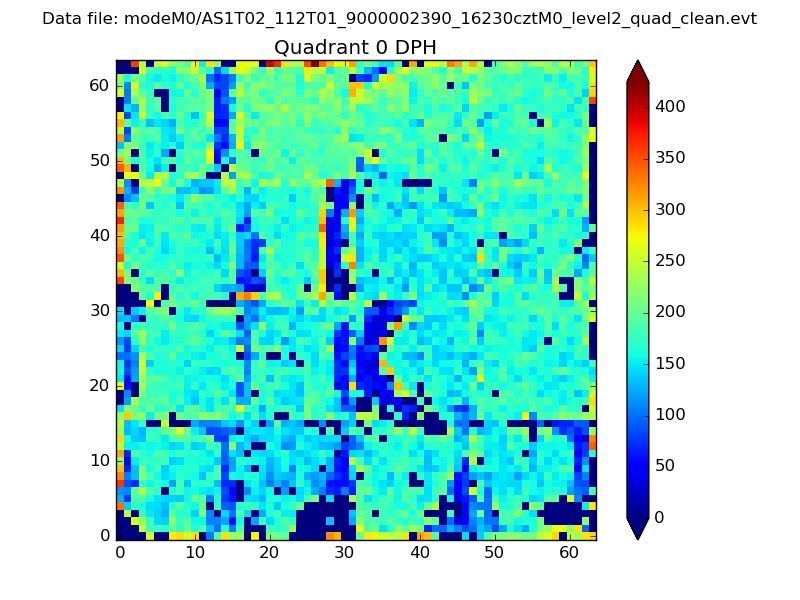 |
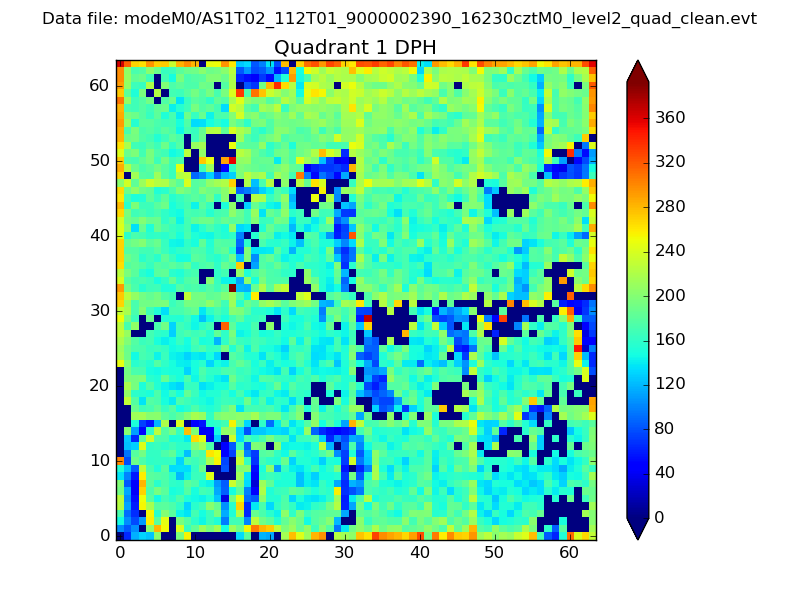 |
Quadrant B |
|---|---|---|---|
| Quadrant D | 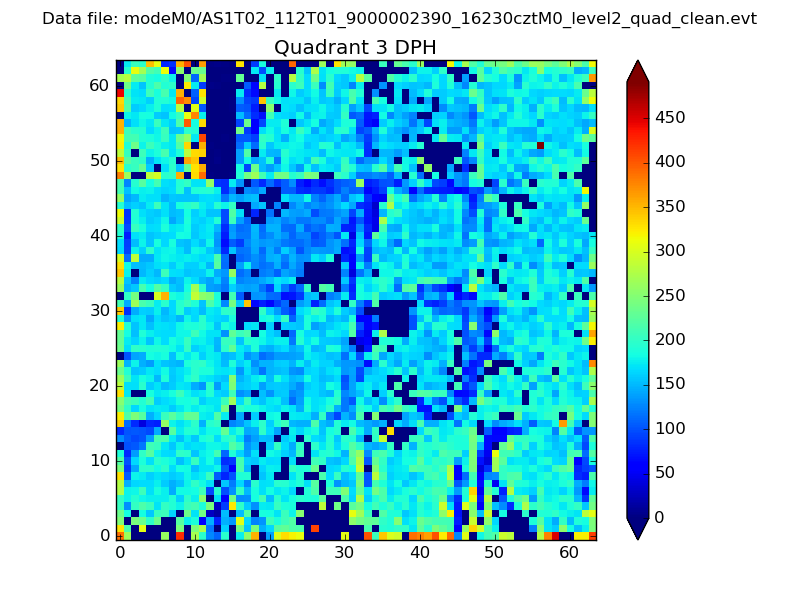 |
 |
Quadrant C |
| Plot type | Count rate plots | Images |
|---|---|---|
| Comparison with Poisson distribution Blue bars denote a histogram of data divided into 1 sec bins. Red curve is a Poisson curve with rate = median count rate of data. |
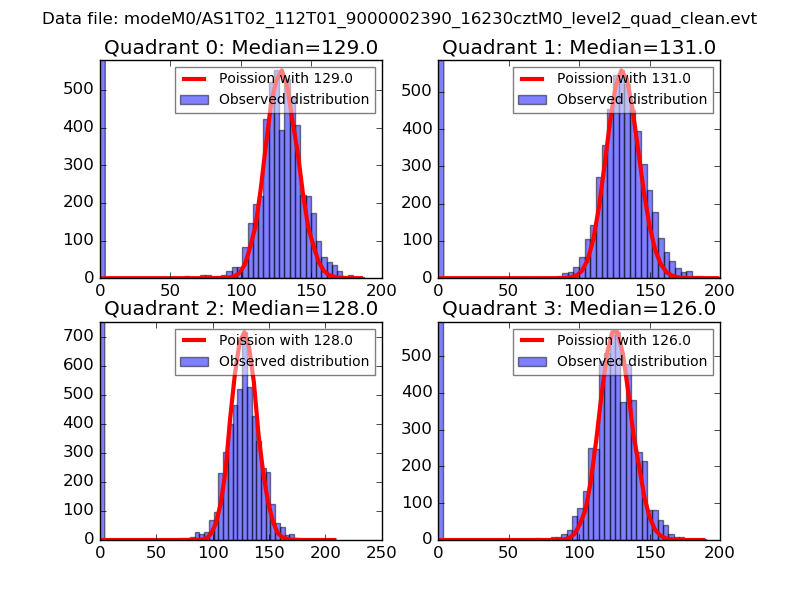 |
 |
| Quadrant-wise count rates Data is divided into 100 sec bins |
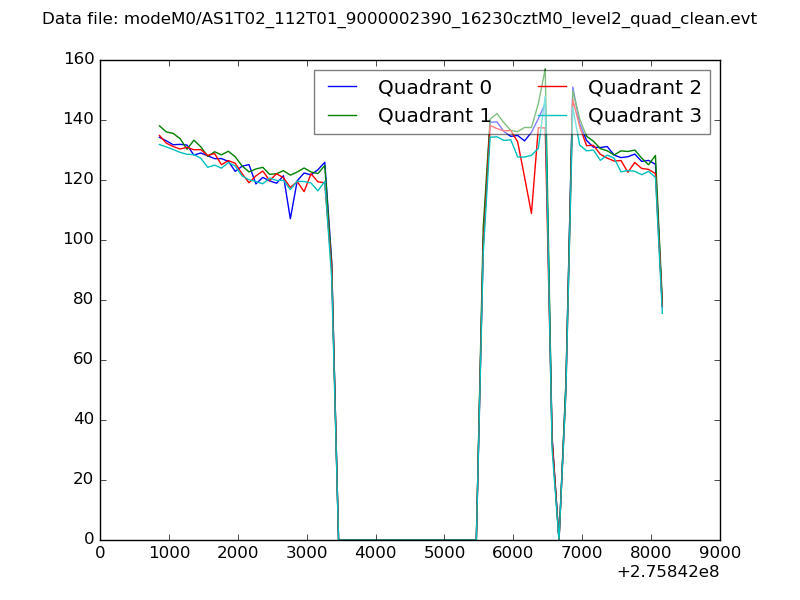 |
|
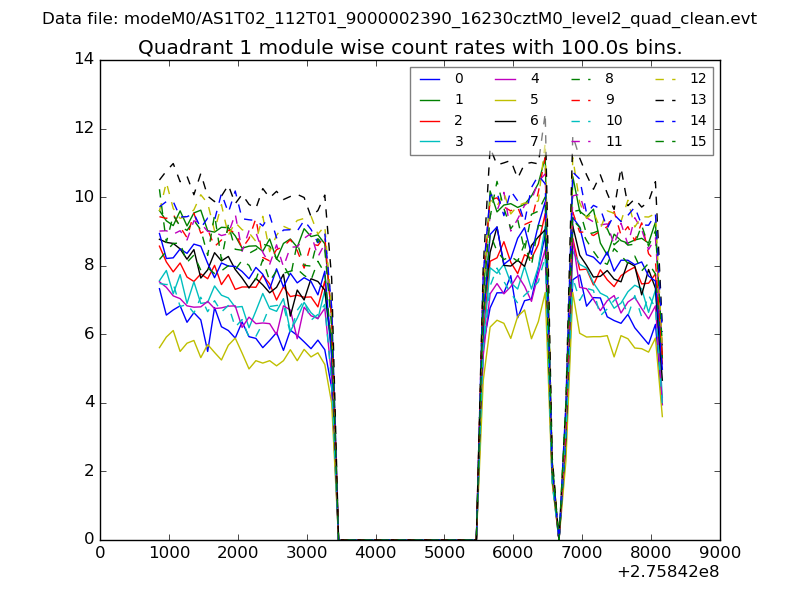
| Module-wise count rates for Quadrant A Data is divided into 100 sec bins |
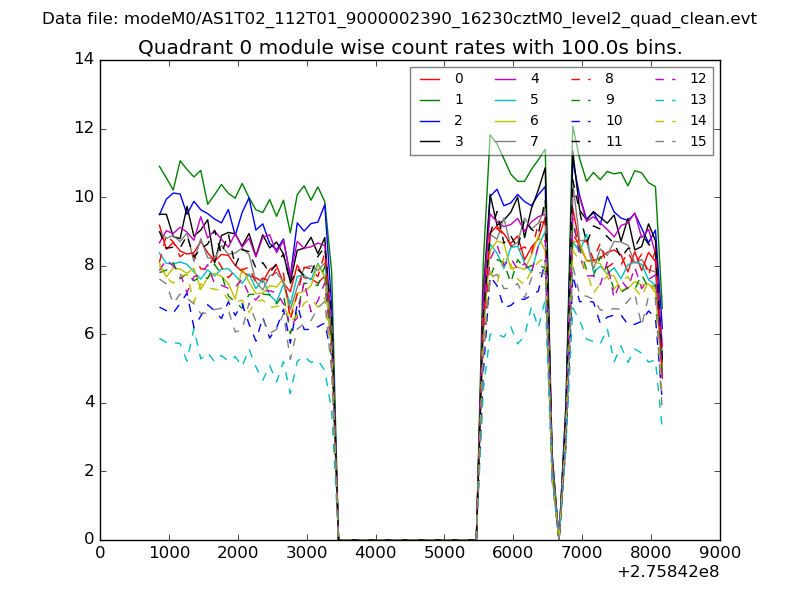 |
 |
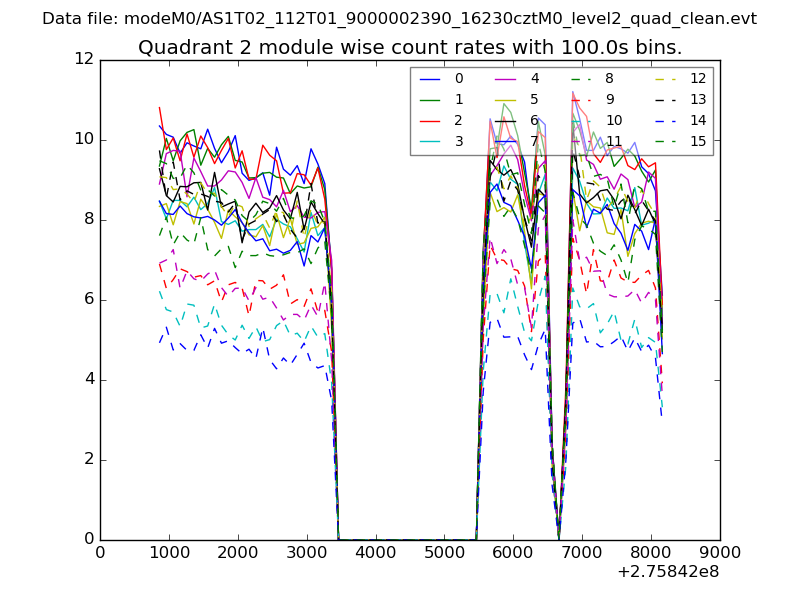
| Module-wise count rates for Quadrant B Data is divided into 100 sec bins |
 |
 |
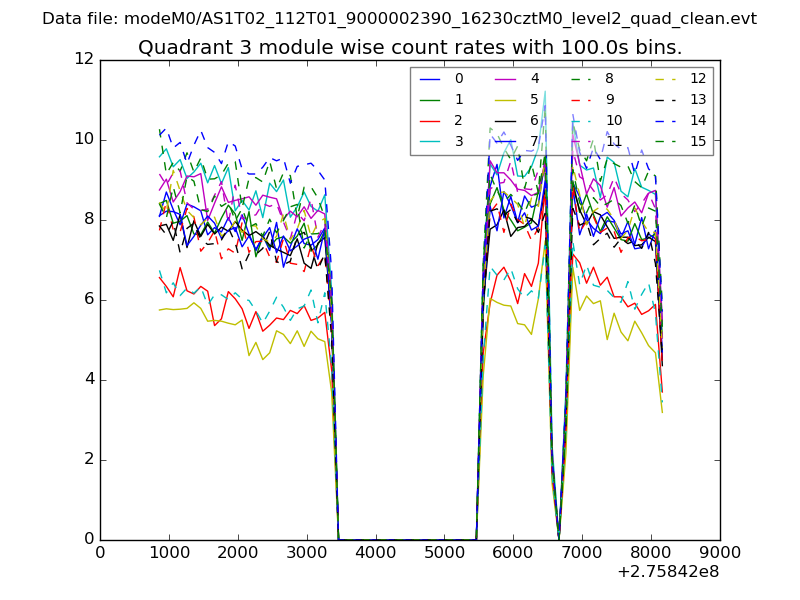
| Module-wise count rates for Quadrant C Data is divided into 100 sec bins |
 |
 |
| Module-wise count rates for Quadrant D Data is divided into 100 sec bins |
 |
 |
| Parameter | Plot |
|---|---|
| CZT HV Monitor | 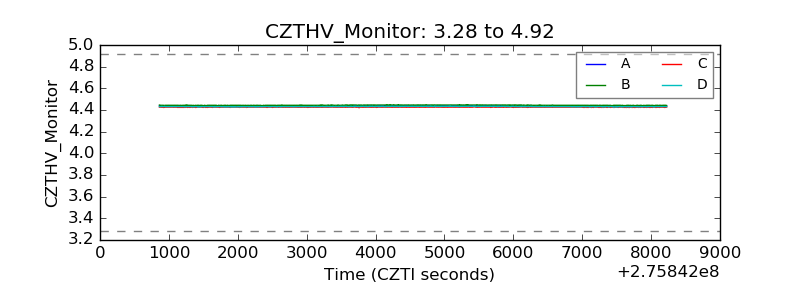 |
| D_VDD | 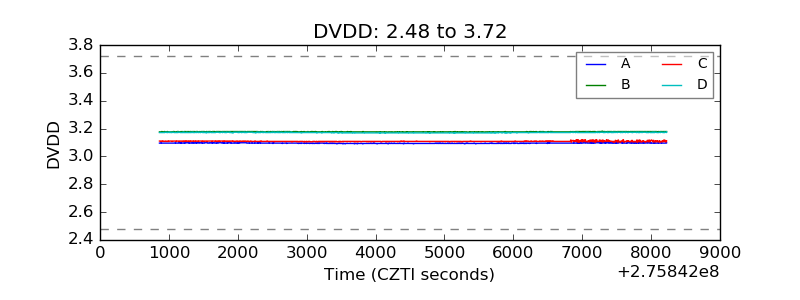 |
| Temperature 1 | 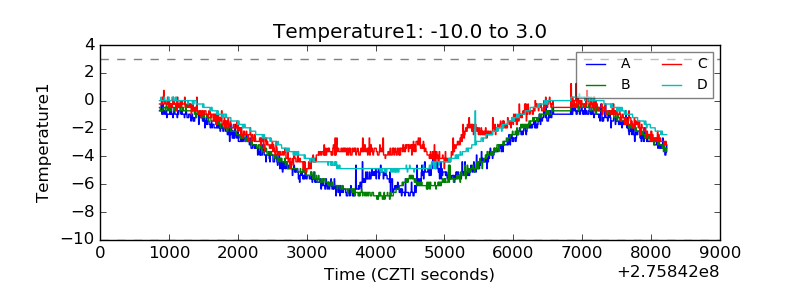 |
| Veto HV Monitor | 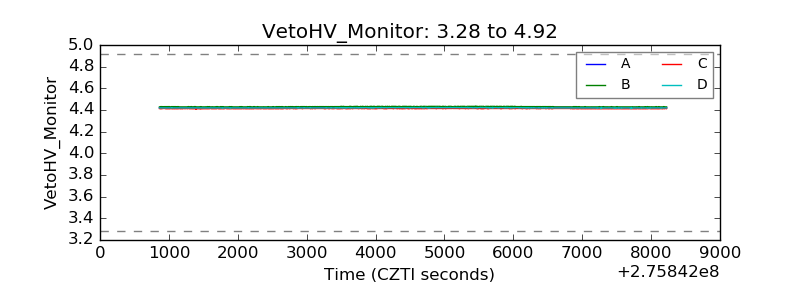 |
| Veto LLD | 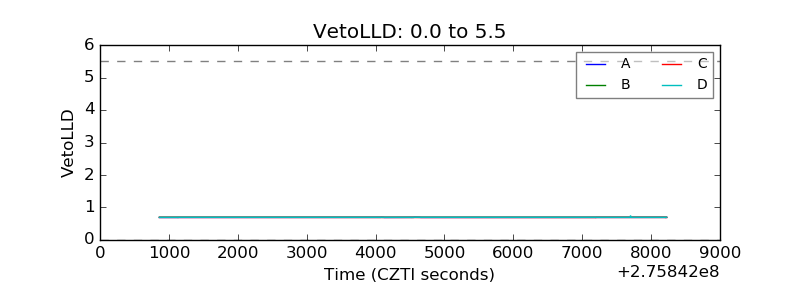 |
| Alpha Counter | 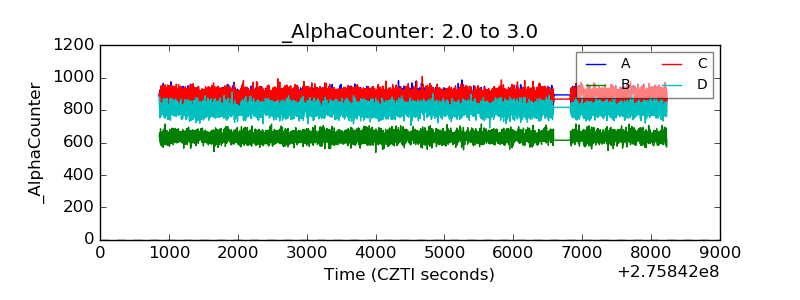 |
| _CPM_Rate |  |
| CZT Counter | 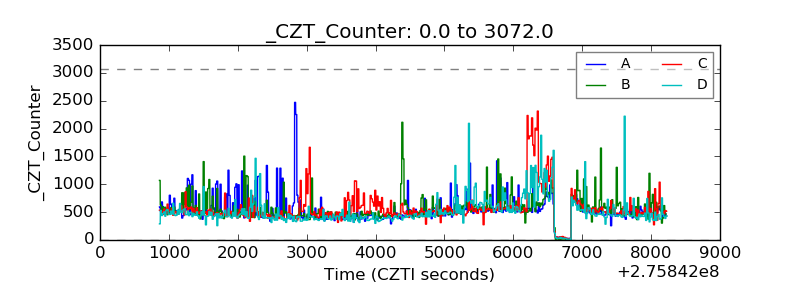 |
| +2.5 Volts monitor |  |
| +5 Volts monitor |  |
| _ROLL_ROT | 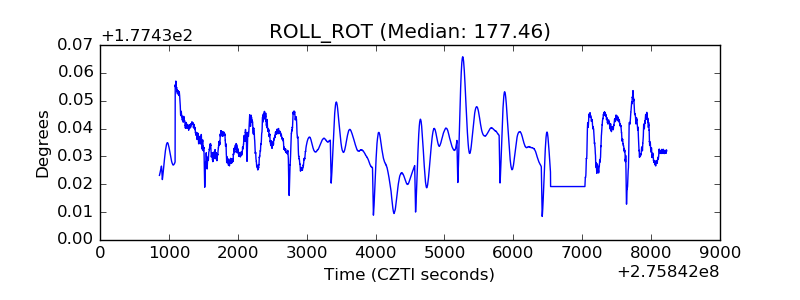 |
| _Roll_DEC | 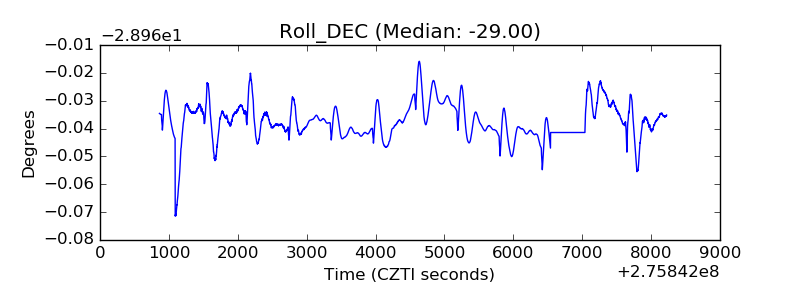 |
| _Roll_RA | 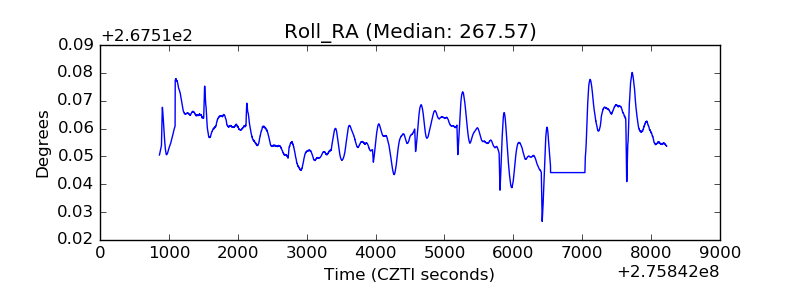 |
| Veto Counter | 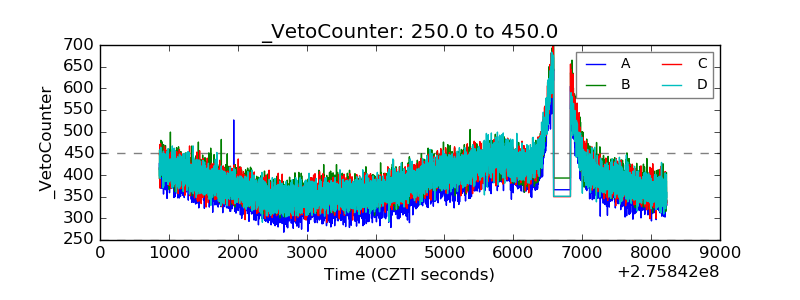 |