| Param | Original file | Final file |
|---|---|---|
| Filename | modeM0/AS1T02_112T01_9000002390_16231cztM0_level2.evt | modeM0/AS1T02_112T01_9000002390_16231cztM0_level2_quad_clean.evt |
| Size (bytes) | 507,585,600 | 101,424,960 |
| Size | 484.1 MB | 96.7 MB |
| Events in quadrant A | 3,491,509 | 650,823 |
| Events in quadrant B | 3,812,605 | 654,647 |
| Events in quadrant C | 3,839,276 | 637,502 |
| Events in quadrant D | 3,741,159 | 628,390 |
| Mode SS | |||
|---|---|---|---|
| Quadrant | BADHDUFLAG | Total packets | Discarded packets |
| A | 0 | 146 | 0 |
| B | 0 | 146 | 0 |
| C | 0 | 146 | 0 |
| D | 0 | 146 | 0 |
| Mode M9 | |||
|---|---|---|---|
| Quadrant | BADHDUFLAG | Total packets | Discarded packets |
| A | 0 | 3 | 0 |
| B | 0 | 3 | 0 |
| C | 0 | 3 | 0 |
| D | 0 | 3 | 0 |
| Mode M0 | |||
|---|---|---|---|
| Quadrant | BADHDUFLAG | Total packets | Discarded packets |
| A | 0 | 15063 | 2 |
| B | 0 | 16056 | 1 |
| C | 0 | 16064 | 1 |
| D | 0 | 16117 | 1 |
| Quadrant | Total seconds | Saturated seconds | Saturation percentage |
|---|---|---|---|
| A | 7183 | 28 | 0.389809% |
| B | 7183 | 63 | 0.877071% |
| C | 7183 | 110 | 1.531394% |
| D | 7183 | 67 | 0.932758% |
Noise dominated data is calculated using 1-second bins in cleaned event files. If a bin has >2000 counts, and if more than 50% of those come from <1% of pixels, then it is considered to be noise-dominated and hence unusable.
| Quadrant | # 1 sec bins | Bins with >0 counts | Bins with >2000 counts | High rate bins dominated by noise | Noise dominated (total time) | Noise dominated (detector-on time) | Marked lightcurve |
|---|---|---|---|---|---|---|---|
| A | 7524 | 7185 | 14 | 14 | 0.19% | 0.19% | 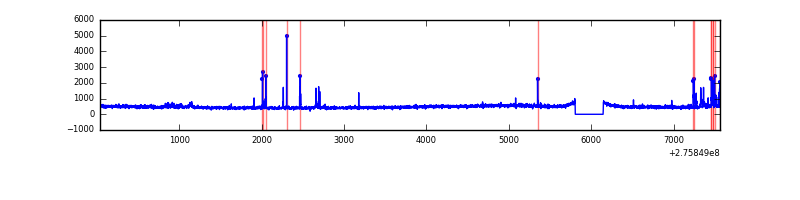 |
| B | 7524 | 7185 | 14 | 14 | 0.19% | 0.19% | 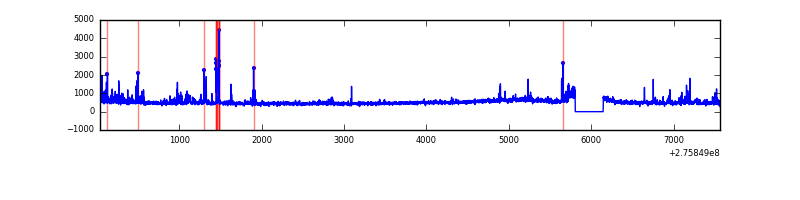 |
| C | 7524 | 7185 | 20 | 20 | 0.27% | 0.28% | 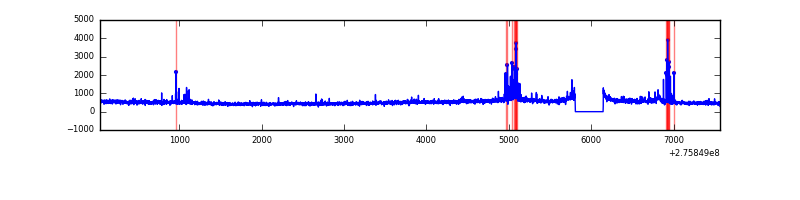 |
| D | 7524 | 7185 | 61 | 61 | 0.81% | 0.85% | 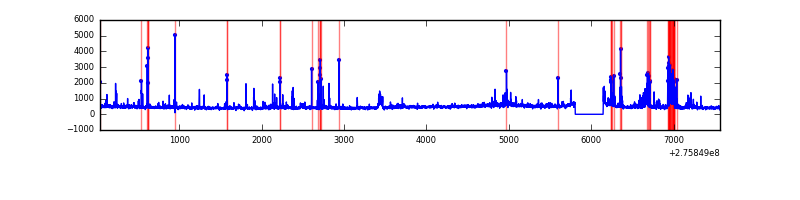 |
Top three noisy pixels from each quadrant. If the there are fewer than three noisy pixels in the level2.evt file, extra rows are filled as -1
| Pixel properties | Quadrant properties | ||||||
|---|---|---|---|---|---|---|---|
| Quadrant | DetID | PixID | Counts | Sigma | Mean | Median | Sigma |
| A | 15 | 174 | 117147 | 661.93 | 857 | 840 | 175.7 |
| A | 8 | 247 | 42923 | 239.5 | 857 | 840 | 175.7 |
| A | 0 | 253 | 12433 | 65.98 | 857 | 840 | 175.7 |
| B | 7 | 220 | 165986 | 1017.09 | 857 | 838 | 162.4 |
| B | 0 | 219 | 70989 | 432.04 | 857 | 838 | 162.4 |
| B | 3 | 209 | 56329 | 341.75 | 857 | 838 | 162.4 |
| C | 3 | 233 | 338569 | 1767.99 | 815 | 821 | 191.0 |
| C | 0 | 207 | 165680 | 862.98 | 815 | 821 | 191.0 |
| C | 14 | 238 | 126881 | 659.88 | 815 | 821 | 191.0 |
| D | 12 | 233 | 259597 | 1278.74 | 828 | 806 | 202.4 |
| D | 1 | 52 | 177753 | 874.33 | 828 | 806 | 202.4 |
| D | 10 | 70 | 64340 | 313.93 | 828 | 806 | 202.4 |
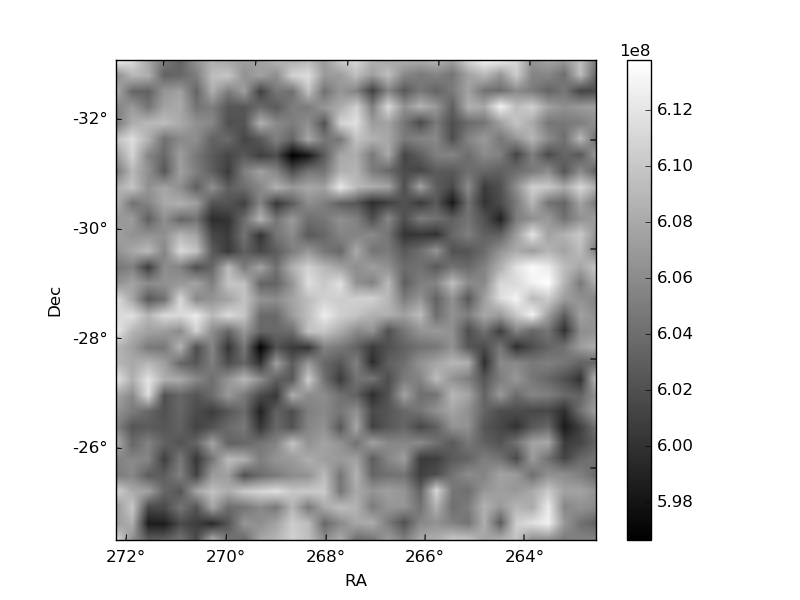
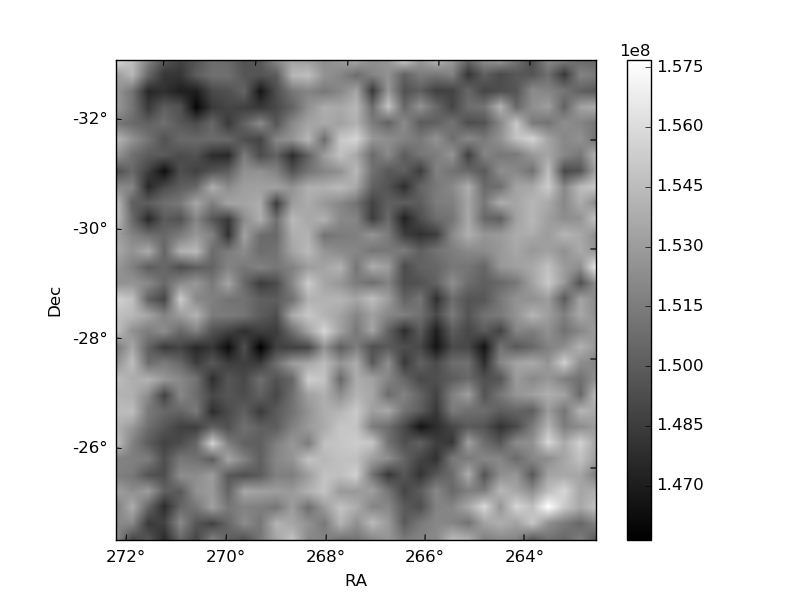
Histogram calculated using DETX and DETY for each event in the final _common_clean file
| Quadrant A | 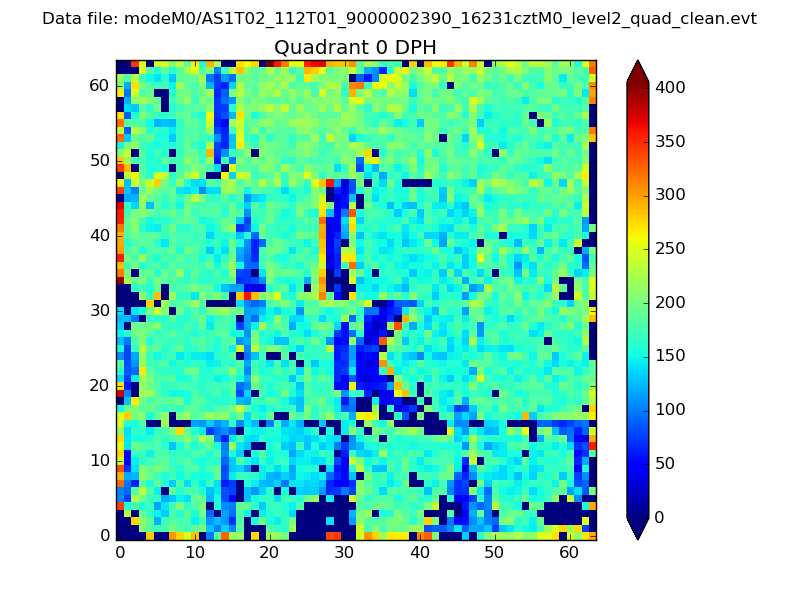 |
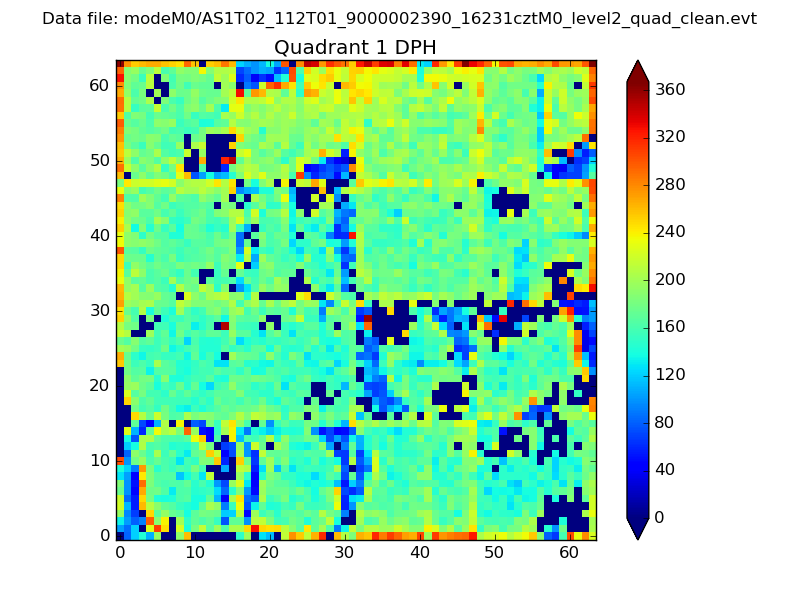 |
Quadrant B |
|---|---|---|---|
| Quadrant D | 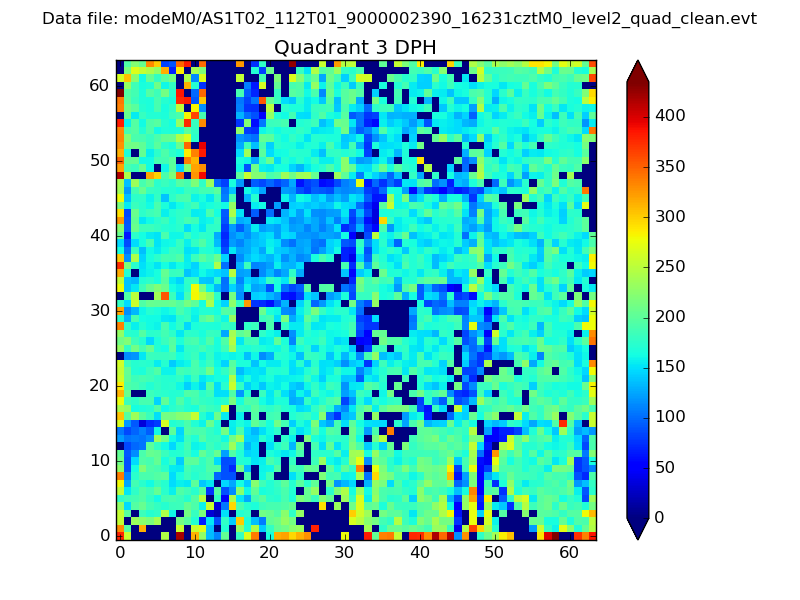 |
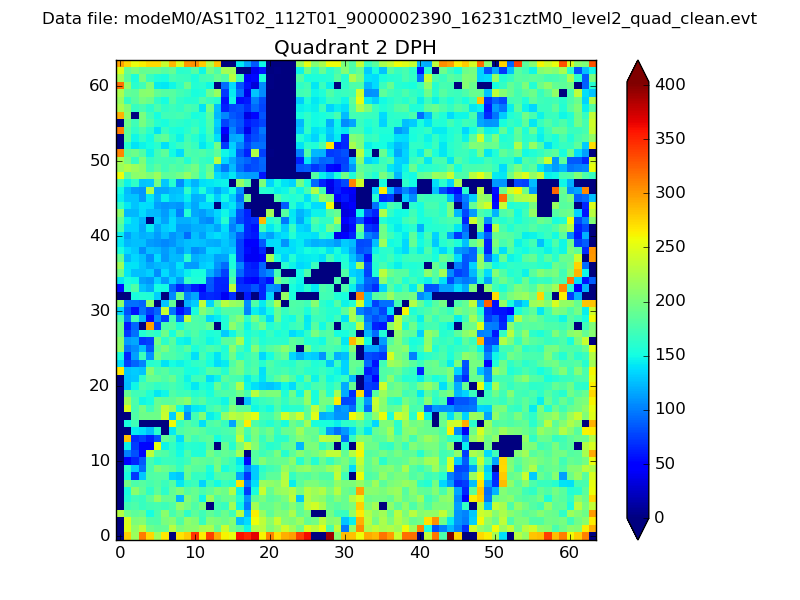 |
Quadrant C |
| Plot type | Count rate plots | Images |
|---|---|---|
| Comparison with Poisson distribution Blue bars denote a histogram of data divided into 1 sec bins. Red curve is a Poisson curve with rate = median count rate of data. |
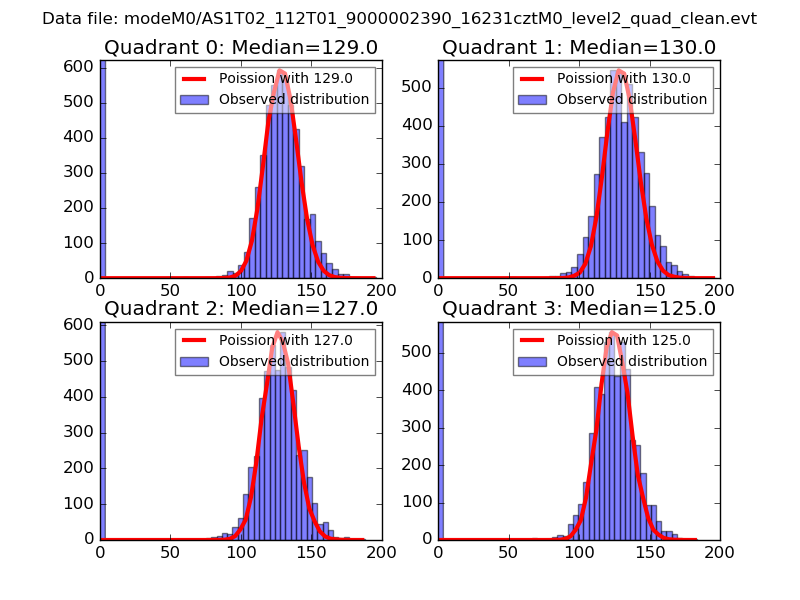 |
 |
| Quadrant-wise count rates Data is divided into 100 sec bins |
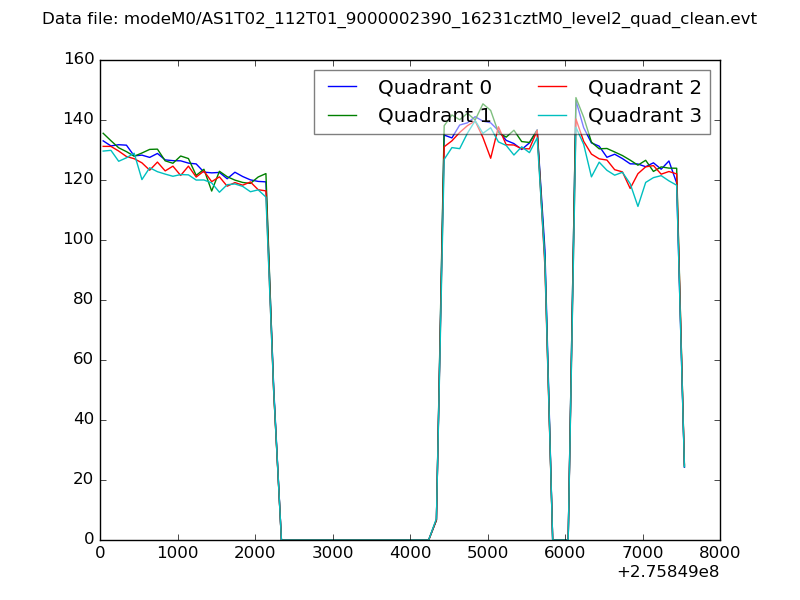 |
|
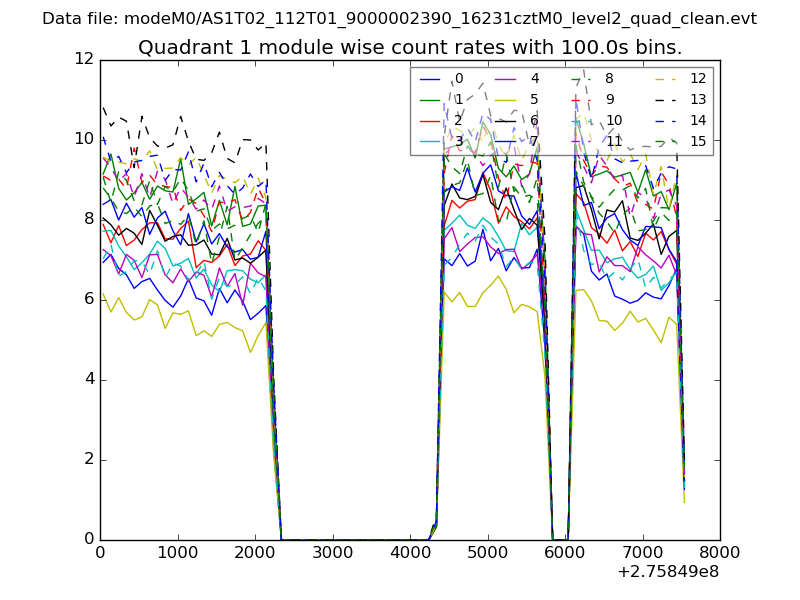
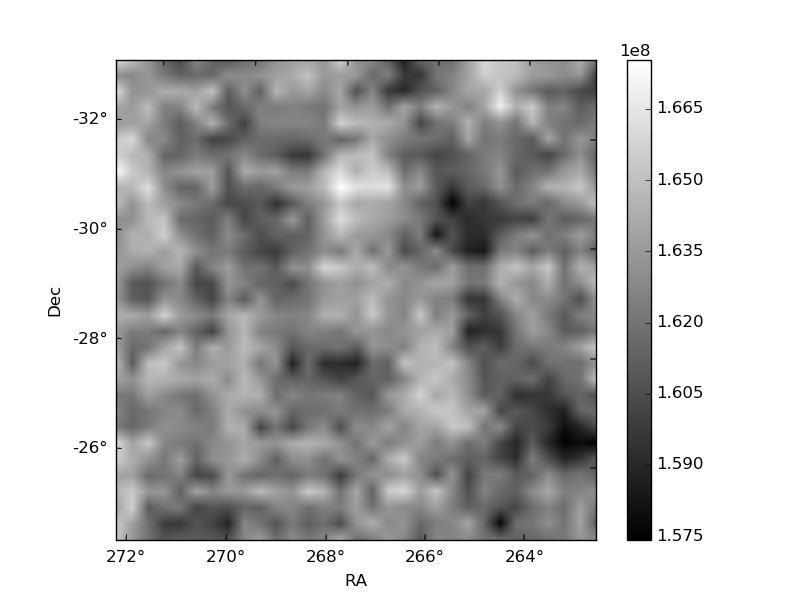
| Module-wise count rates for Quadrant A Data is divided into 100 sec bins |
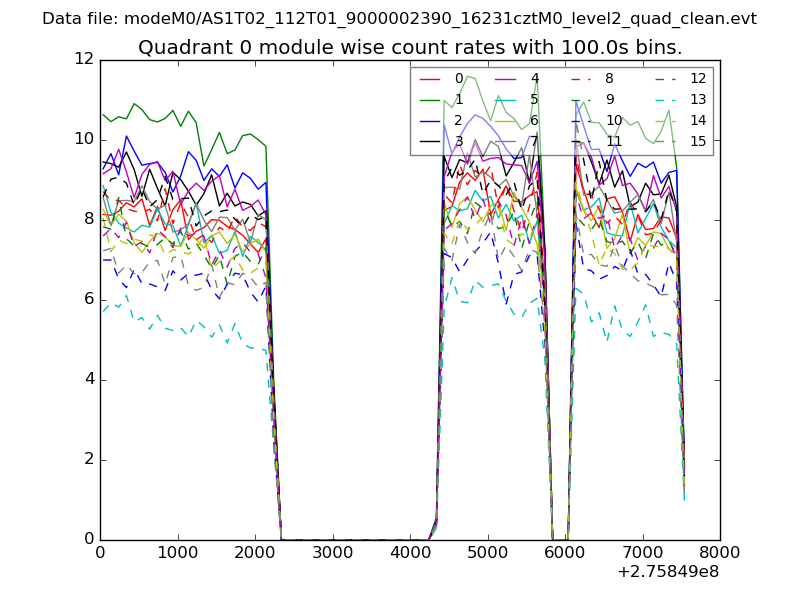 |
 |
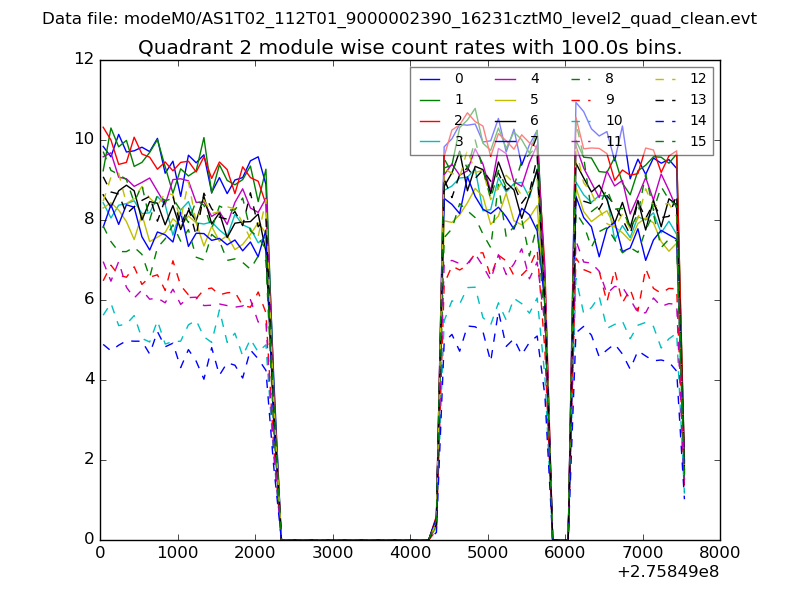
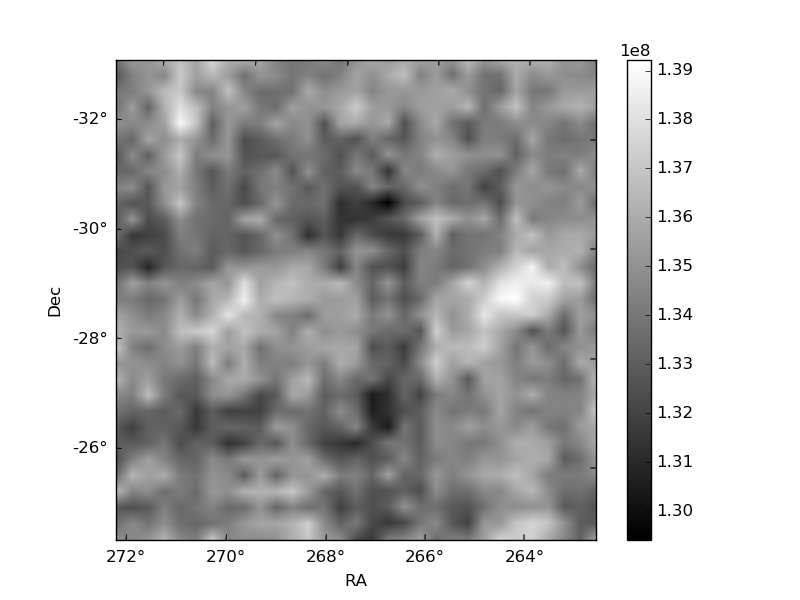
| Module-wise count rates for Quadrant B Data is divided into 100 sec bins |
 |
 |
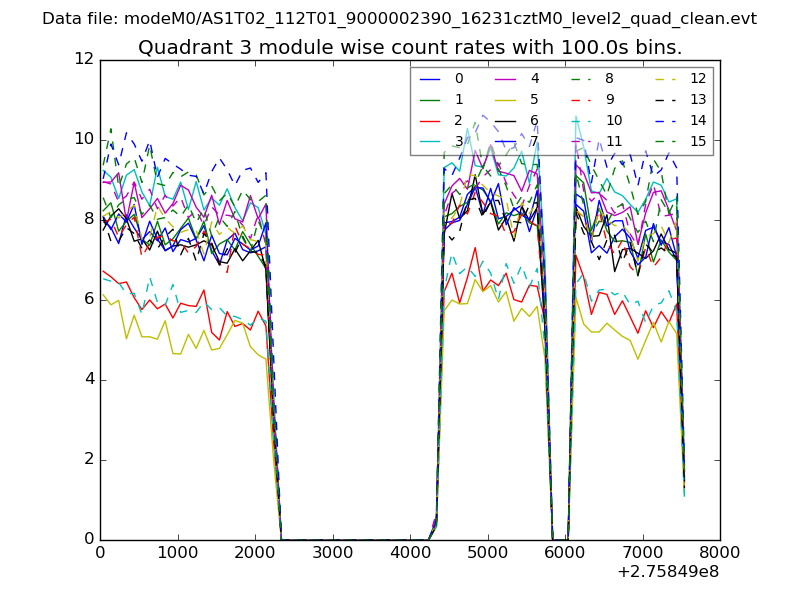
| Module-wise count rates for Quadrant C Data is divided into 100 sec bins |
 |
 |
| Module-wise count rates for Quadrant D Data is divided into 100 sec bins |
 |
 |
| Parameter | Plot |
|---|---|
| CZT HV Monitor |  |
| D_VDD | 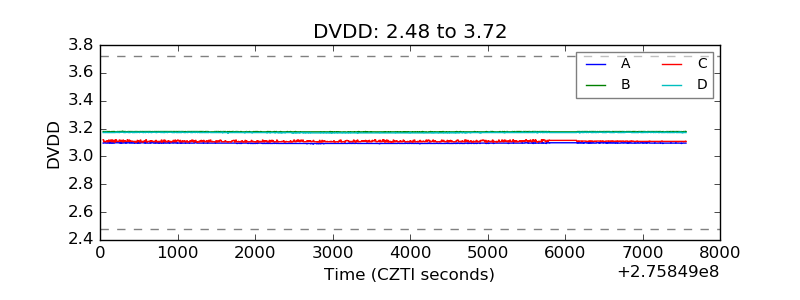 |
| Temperature 1 | 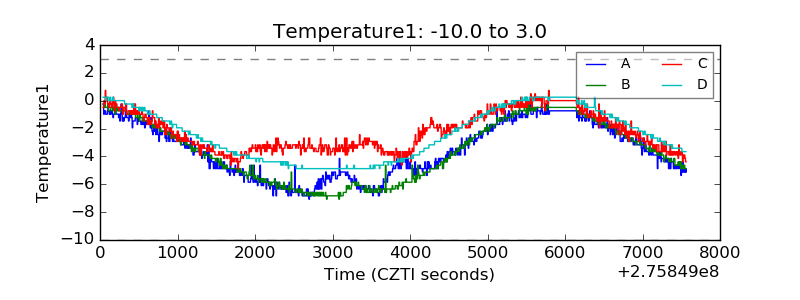 |
| Veto HV Monitor | 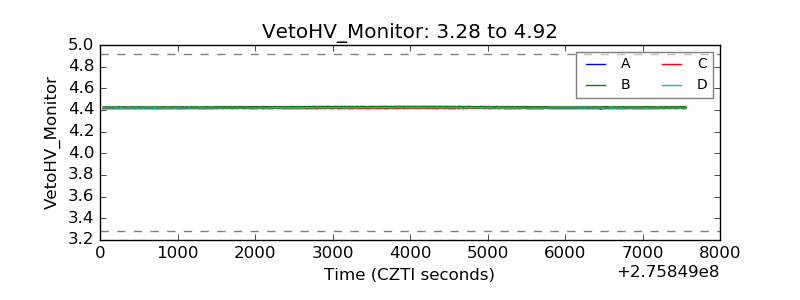 |
| Veto LLD | 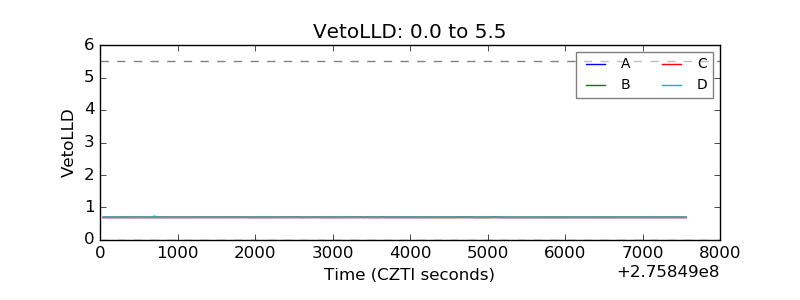 |
| Alpha Counter | 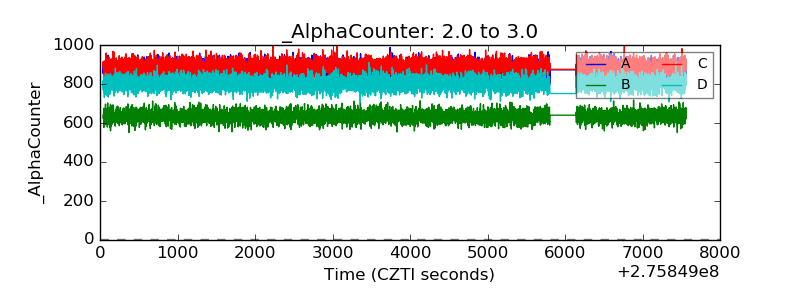 |
| _CPM_Rate | 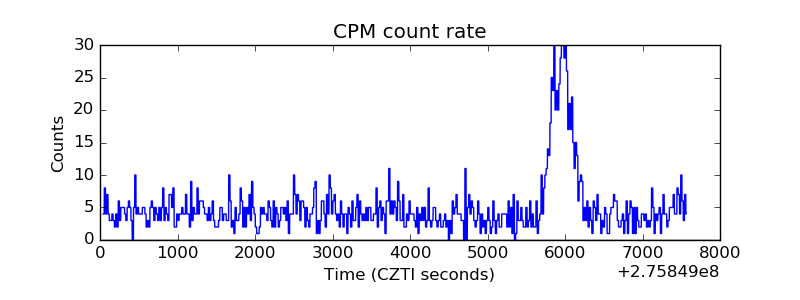 |
| CZT Counter | 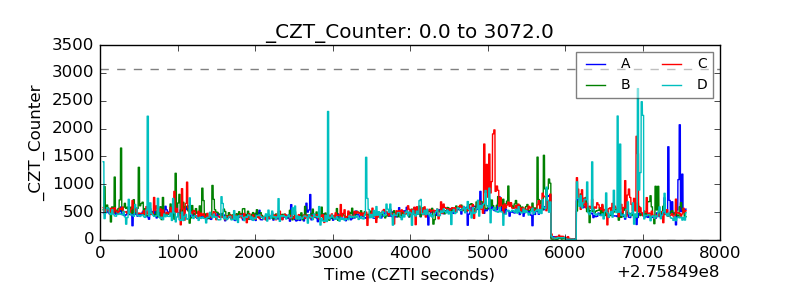 |
| +2.5 Volts monitor |  |
| +5 Volts monitor | 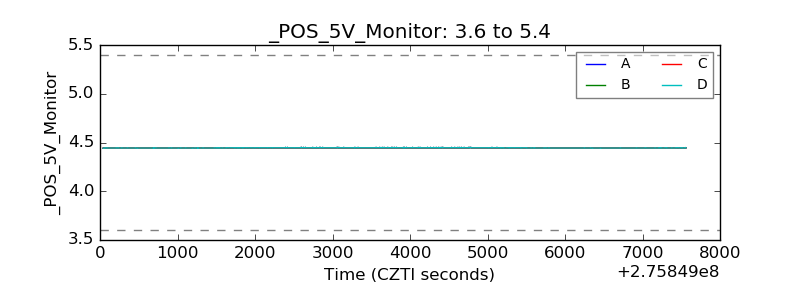 |
| _ROLL_ROT | 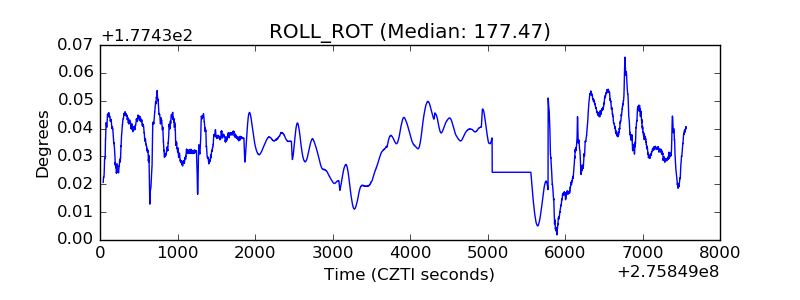 |
| _Roll_DEC | 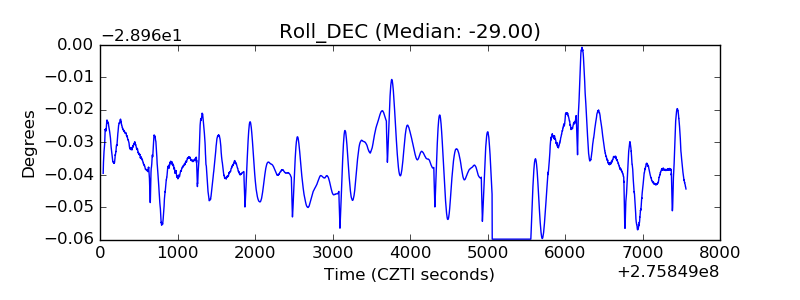 |
| _Roll_RA | 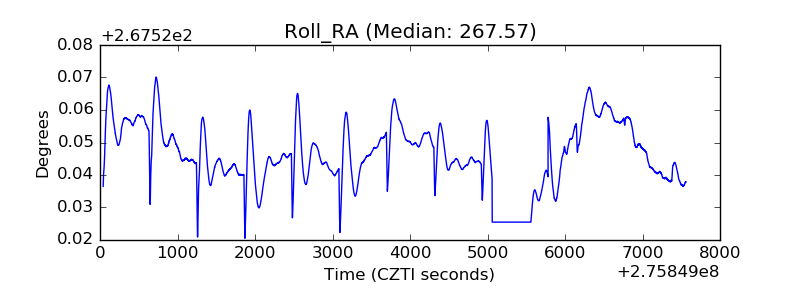 |
| Veto Counter | 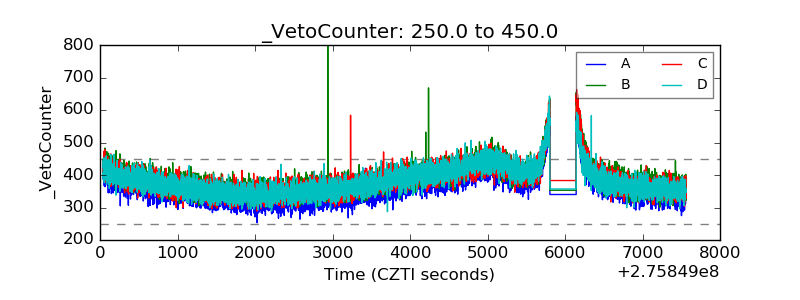 |