| Param | Original file | Final file |
|---|---|---|
| Filename | modeM0/AS1T02_112T01_9000002390_16237cztM0_level2.evt | modeM0/AS1T02_112T01_9000002390_16237cztM0_level2_quad_clean.evt |
| Size (bytes) | 453,525,120 | 63,207,360 |
| Size | 432.5 MB | 60.3 MB |
| Events in quadrant A | 3,396,210 | 376,081 |
| Events in quadrant B | 3,334,276 | 379,494 |
| Events in quadrant C | 3,649,331 | 371,757 |
| Events in quadrant D | 2,951,192 | 370,632 |
| Mode SS | |||
|---|---|---|---|
| Quadrant | BADHDUFLAG | Total packets | Discarded packets |
| A | 0 | 122 | 0 |
| B | 0 | 122 | 0 |
| C | 0 | 122 | 0 |
| D | 0 | 122 | 0 |
| Mode M9 | |||
|---|---|---|---|
| Quadrant | BADHDUFLAG | Total packets | Discarded packets |
| A | 0 | 11 | 0 |
| B | 0 | 11 | 0 |
| C | 0 | 11 | 0 |
| D | 0 | 11 | 0 |
| Mode M0 | |||
|---|---|---|---|
| Quadrant | BADHDUFLAG | Total packets | Discarded packets |
| A | 0 | 13781 | 2 |
| B | 0 | 13586 | 1 |
| C | 0 | 14865 | 1 |
| D | 0 | 12570 | 1 |
| Quadrant | Total seconds | Saturated seconds | Saturation percentage |
|---|---|---|---|
| A | 5947 | 207 | 3.480747% |
| B | 5947 | 66 | 1.109803% |
| C | 5947 | 74 | 1.244325% |
| D | 5947 | 29 | 0.487641% |
Noise dominated data is calculated using 1-second bins in cleaned event files. If a bin has >2000 counts, and if more than 50% of those come from <1% of pixels, then it is considered to be noise-dominated and hence unusable.
| Quadrant | # 1 sec bins | Bins with >0 counts | Bins with >2000 counts | High rate bins dominated by noise | Noise dominated (total time) | Noise dominated (detector-on time) | Marked lightcurve |
|---|---|---|---|---|---|---|---|
| A | 7108 | 5949 | 139 | 139 | 1.96% | 2.34% | 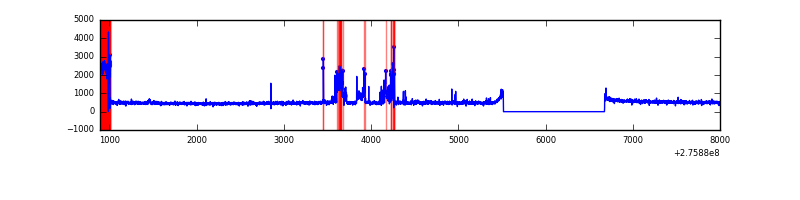 |
| B | 7108 | 5949 | 17 | 17 | 0.24% | 0.29% | 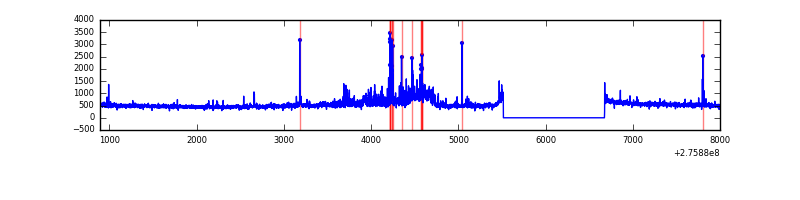 |
| C | 7108 | 5949 | 1 | 1 | 0.01% | 0.02% | 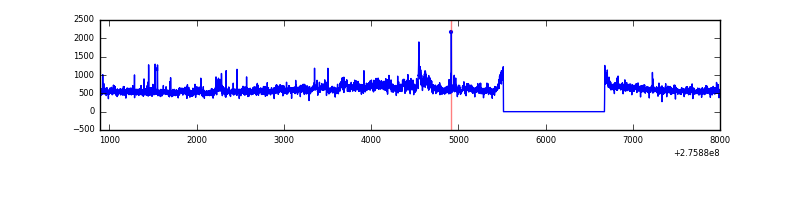 |
| D | 7108 | 5949 | 6 | 6 | 0.08% | 0.10% | 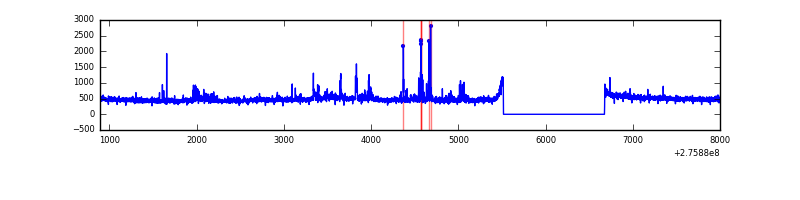 |
Top three noisy pixels from each quadrant. If the there are fewer than three noisy pixels in the level2.evt file, extra rows are filled as -1
| Pixel properties | Quadrant properties | ||||||
|---|---|---|---|---|---|---|---|
| Quadrant | DetID | PixID | Counts | Sigma | Mean | Median | Sigma |
| A | 15 | 174 | 561854 | 3781.12 | 732 | 719 | 148.4 |
| A | 8 | 247 | 12731 | 80.94 | 732 | 719 | 148.4 |
| A | 0 | 226 | 6615 | 39.73 | 732 | 719 | 148.4 |
| B | 4 | 216 | 129628 | 914.38 | 747 | 731 | 141.0 |
| B | 7 | 220 | 92354 | 649.97 | 747 | 731 | 141.0 |
| B | 0 | 198 | 67155 | 471.21 | 747 | 731 | 141.0 |
| C | 3 | 233 | 717939 | 4332.81 | 717 | 722 | 165.5 |
| C | 14 | 238 | 111117 | 666.91 | 717 | 722 | 165.5 |
| C | 8 | 128 | 7717 | 42.26 | 717 | 722 | 165.5 |
| D | 1 | 52 | 118521 | 658.91 | 726 | 706 | 178.8 |
| D | 12 | 233 | 50686 | 279.53 | 726 | 706 | 178.8 |
| D | 10 | 70 | 25461 | 138.45 | 726 | 706 | 178.8 |
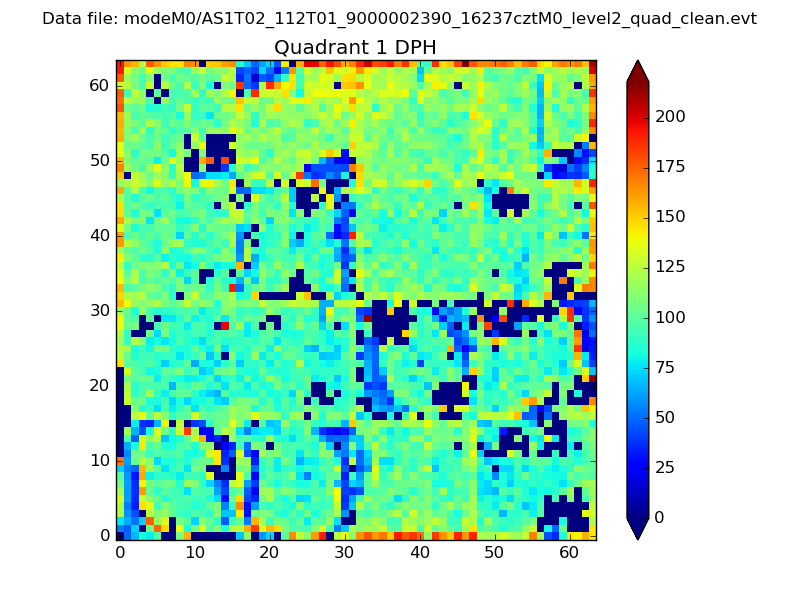
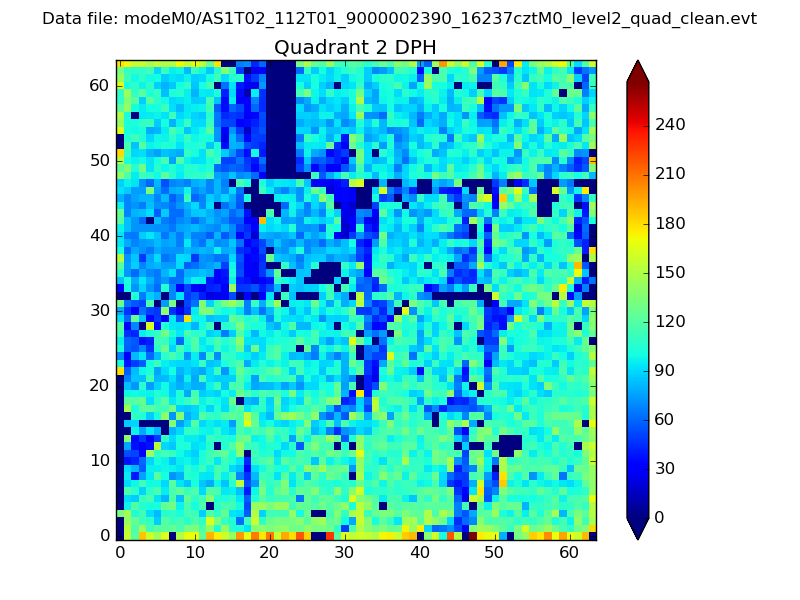
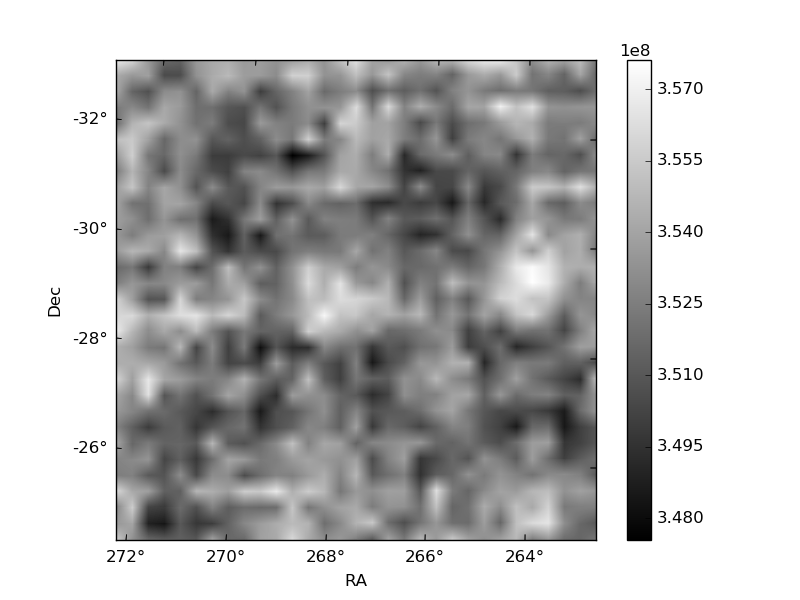
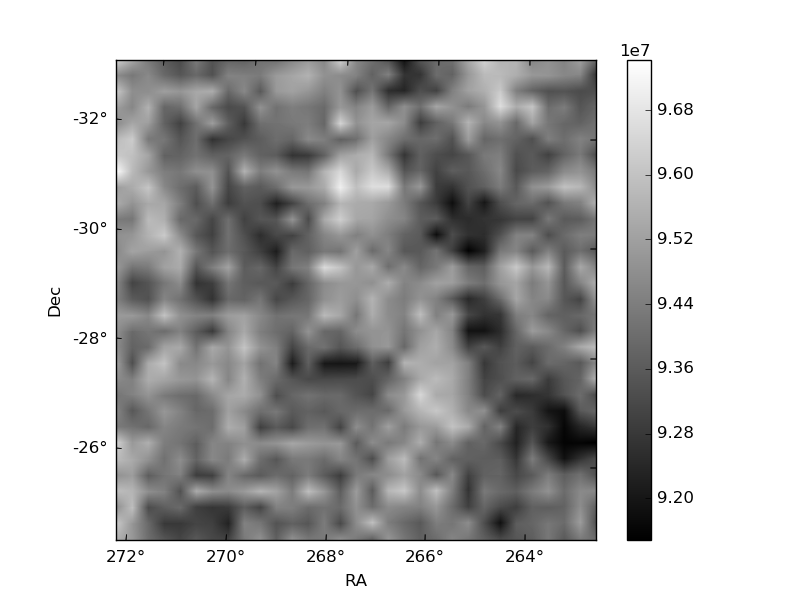
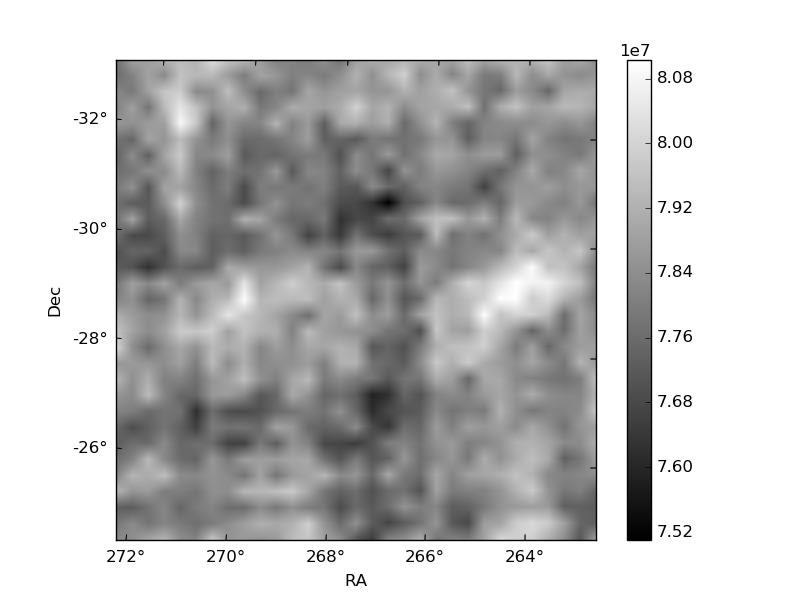
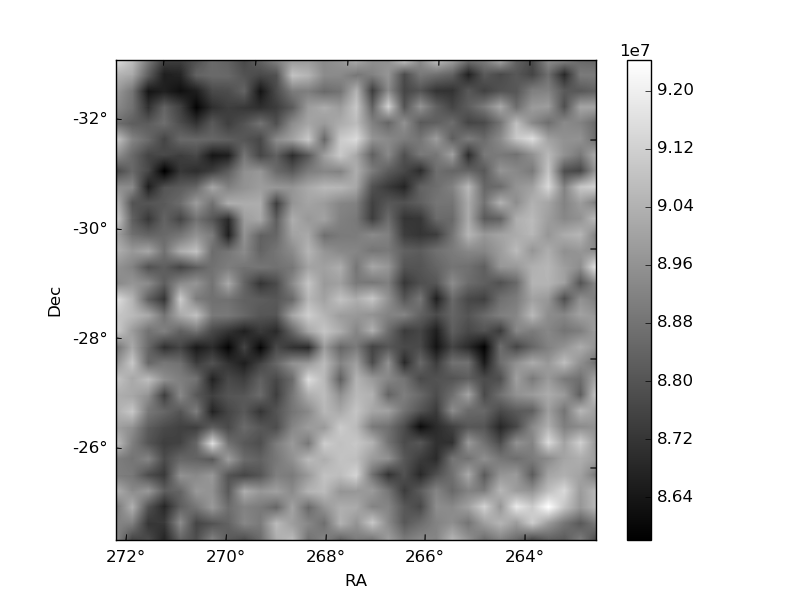
Histogram calculated using DETX and DETY for each event in the final _common_clean file
| Quadrant A |  |
 |
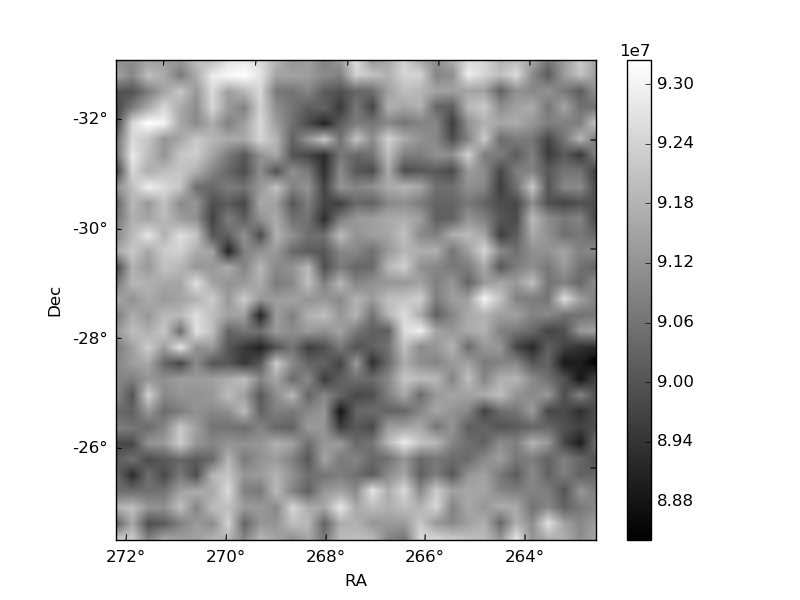
Quadrant B |
|---|---|---|---|
| Quadrant D | 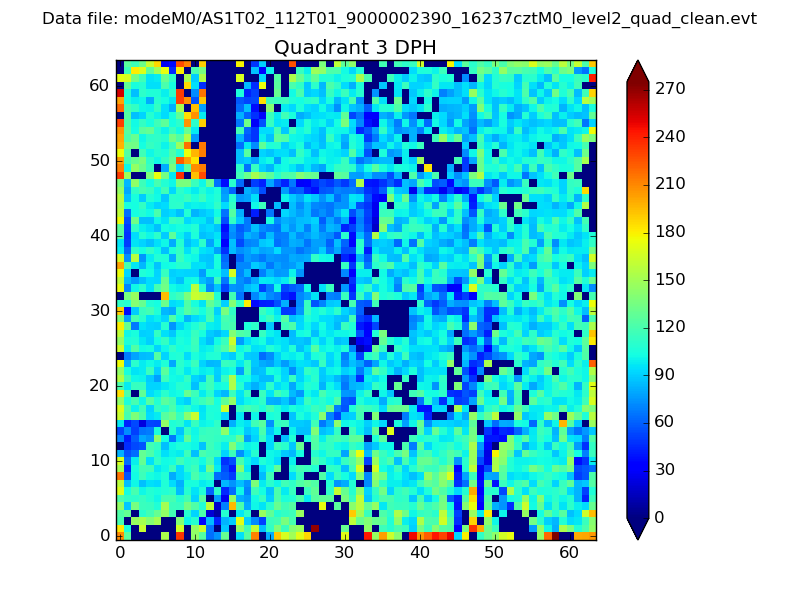 |
 |
Quadrant C |
| Plot type | Count rate plots | Images |
|---|---|---|
| Comparison with Poisson distribution Blue bars denote a histogram of data divided into 1 sec bins. Red curve is a Poisson curve with rate = median count rate of data. |
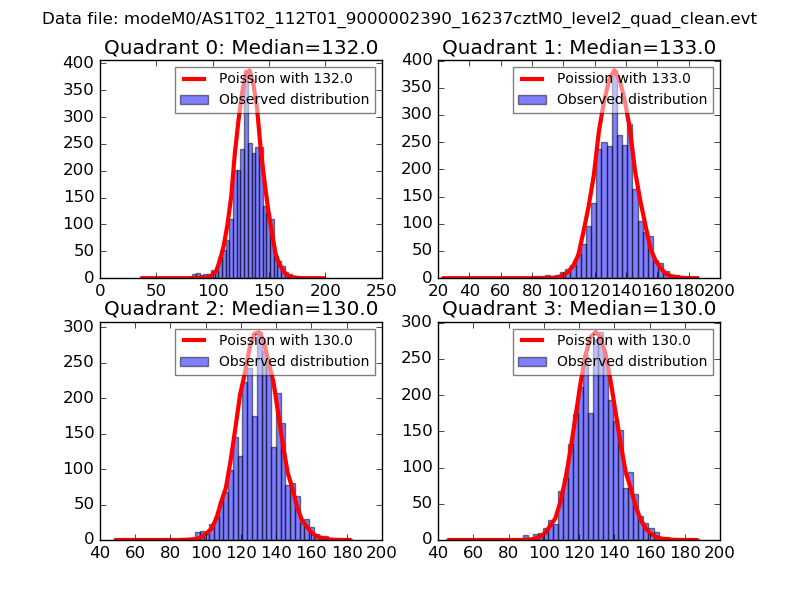 |
 |
| Quadrant-wise count rates Data is divided into 100 sec bins |
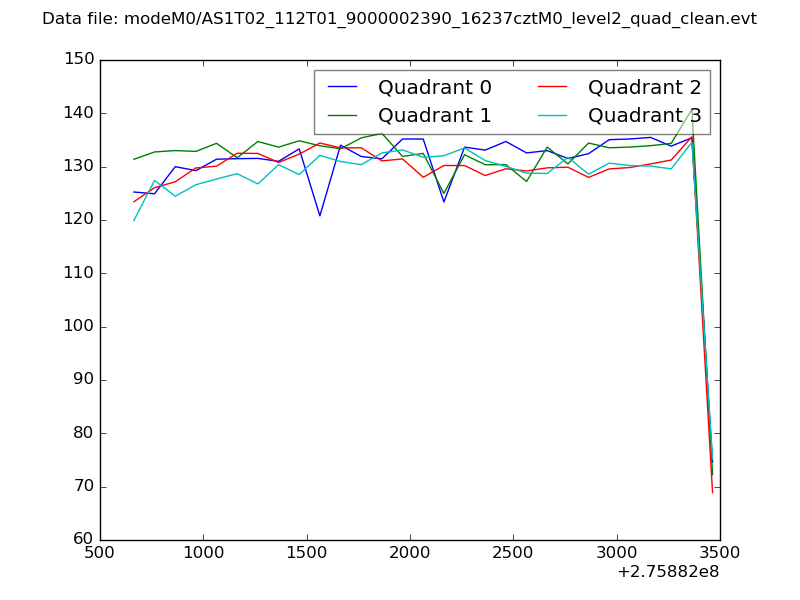 |
|
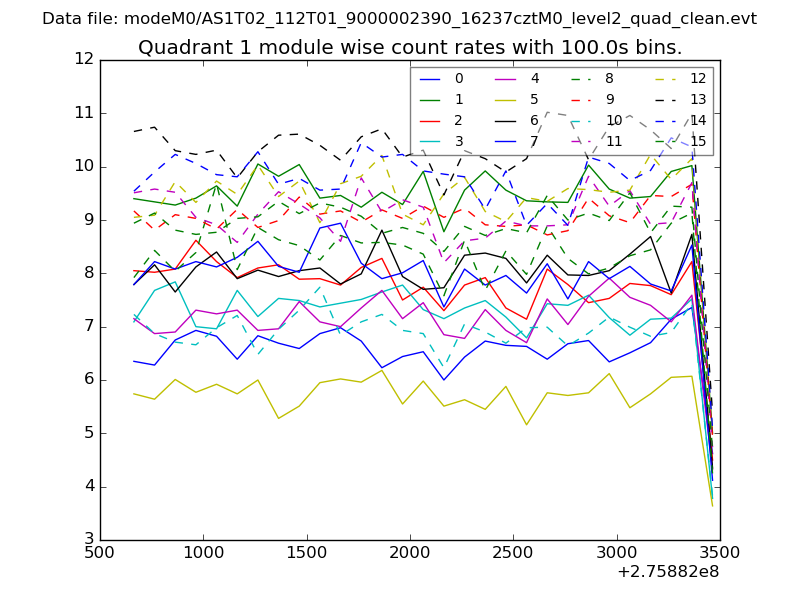
| Module-wise count rates for Quadrant A Data is divided into 100 sec bins |
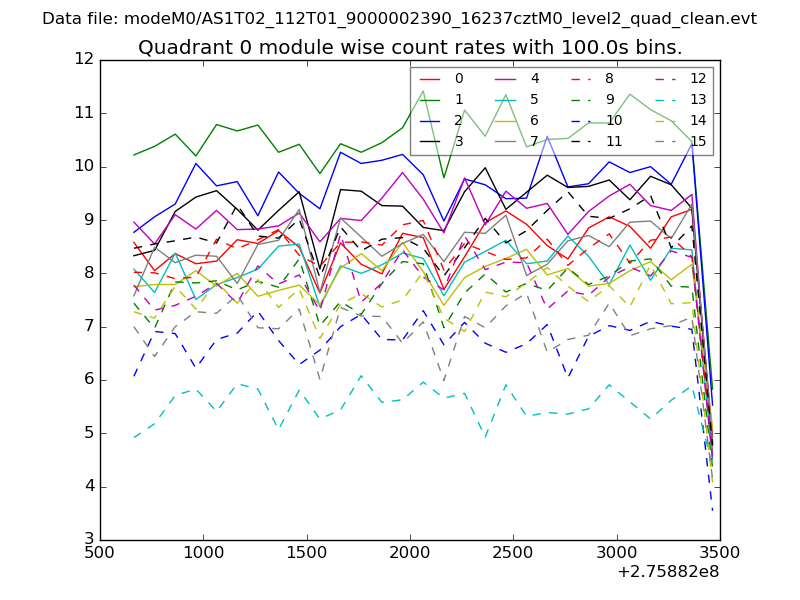 |
 |
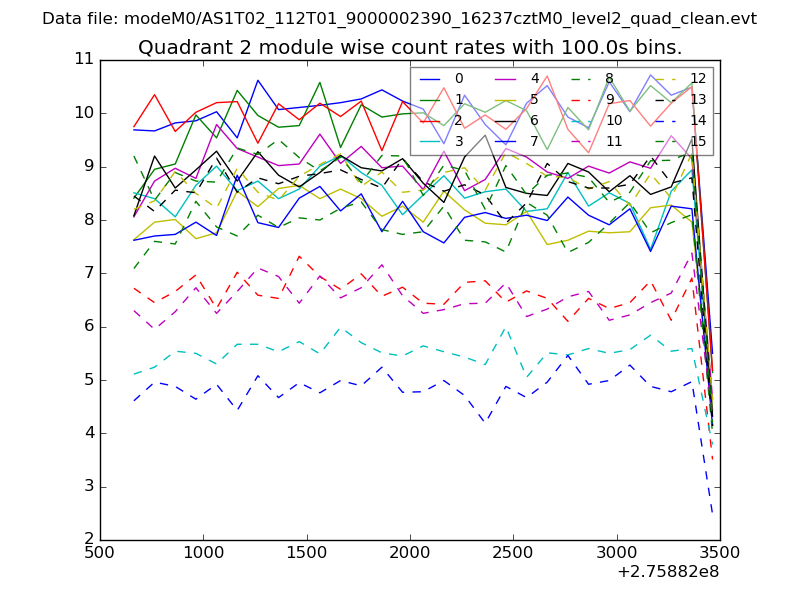
| Module-wise count rates for Quadrant B Data is divided into 100 sec bins |
 |
 |
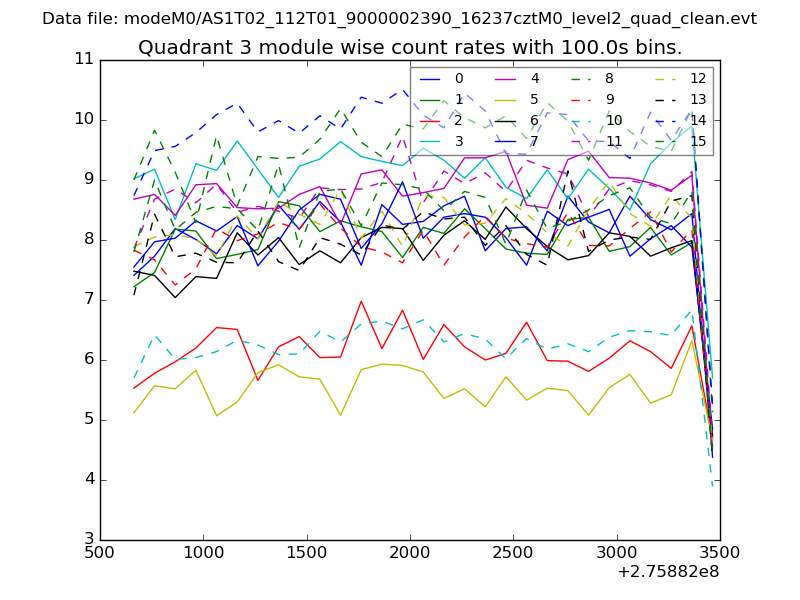
| Module-wise count rates for Quadrant C Data is divided into 100 sec bins |
 |
 |
| Module-wise count rates for Quadrant D Data is divided into 100 sec bins |
 |
 |
| Parameter | Plot |
|---|---|
| CZT HV Monitor | 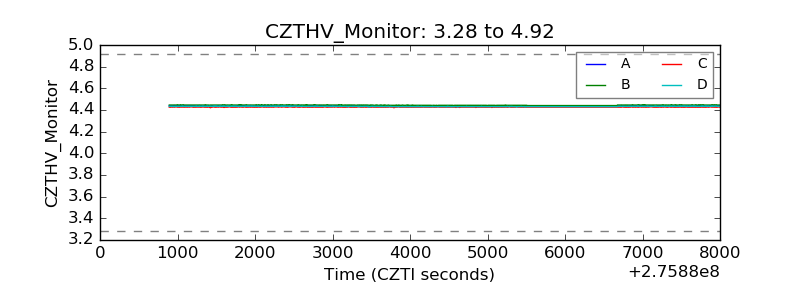 |
| D_VDD | 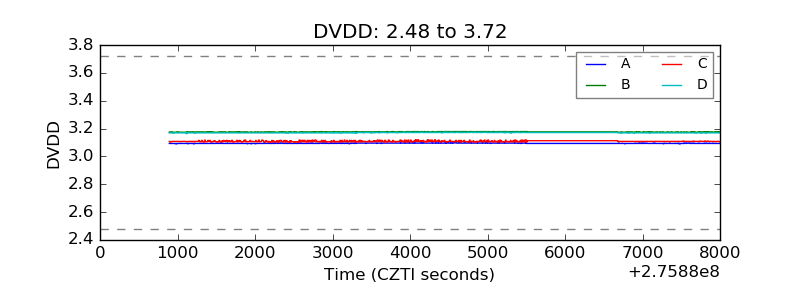 |
| Temperature 1 | 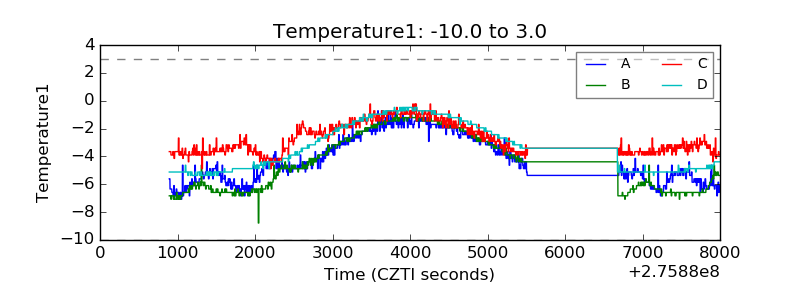 |
| Veto HV Monitor | 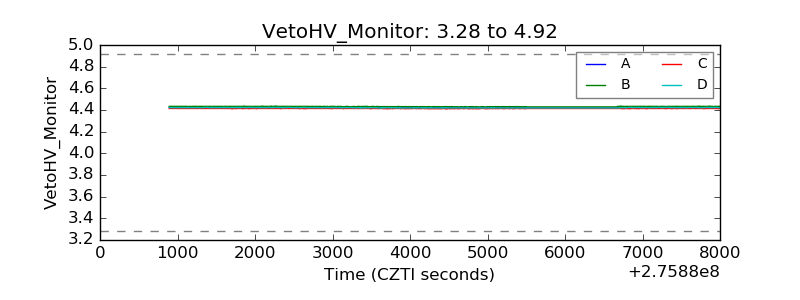 |
| Veto LLD | 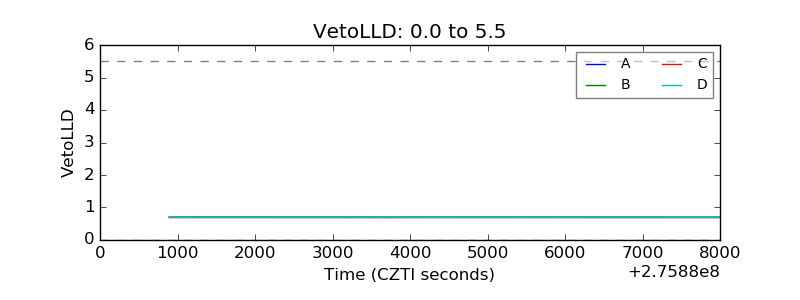 |
| Alpha Counter | 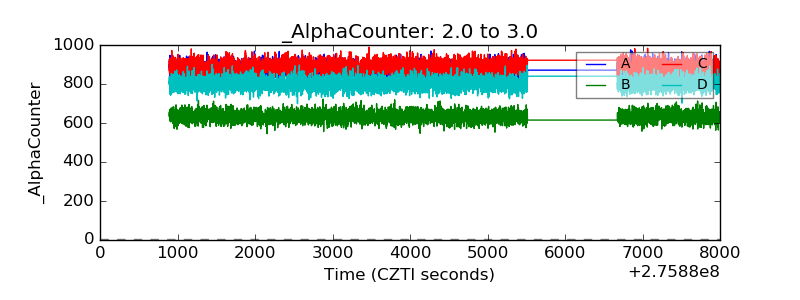 |
| _CPM_Rate | 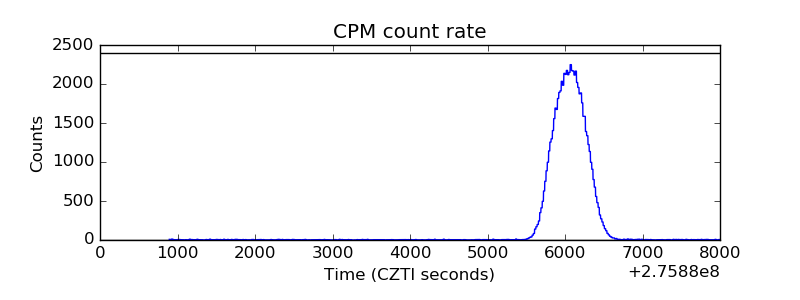 |
| CZT Counter | 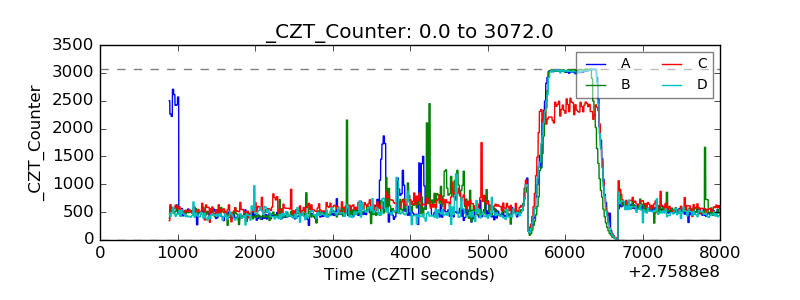 |
| +2.5 Volts monitor |  |
| +5 Volts monitor | 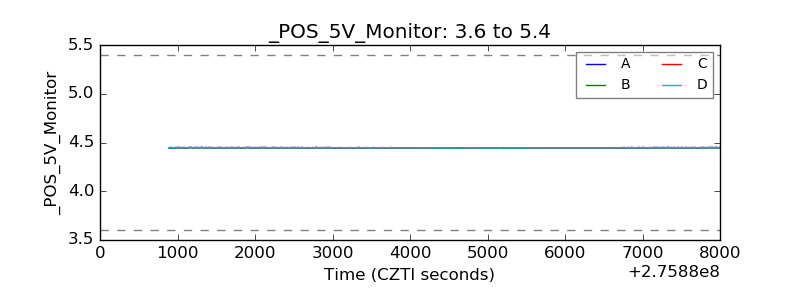 |
| _ROLL_ROT | 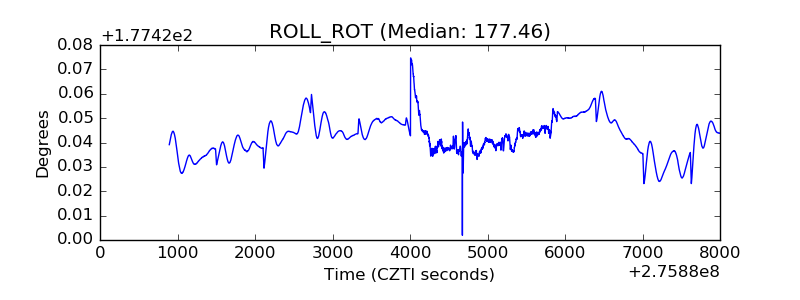 |
| _Roll_DEC | 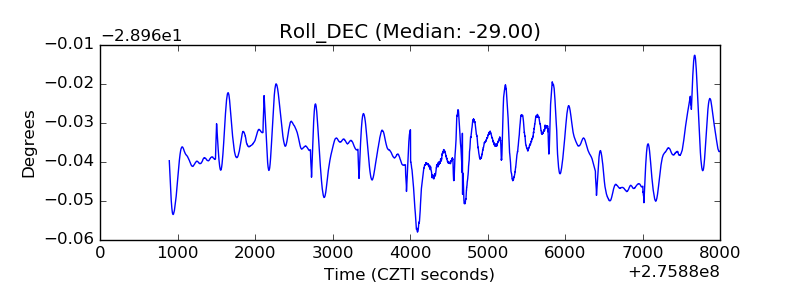 |
| _Roll_RA | 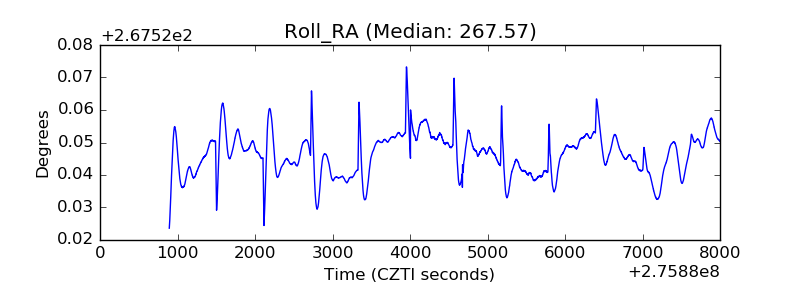 |
| Veto Counter | 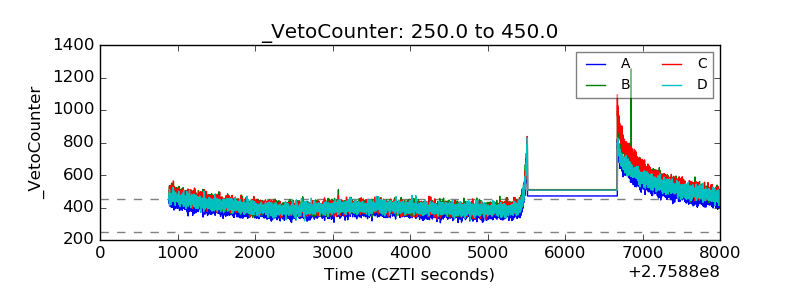 |