| Param | Original file | Final file |
|---|---|---|
| Filename | modeM0/AS1T02_112T01_9000002390_16238cztM0_level2.evt | modeM0/AS1T02_112T01_9000002390_16238cztM0_level2_quad_clean.evt |
| Size (bytes) | 466,729,920 | 70,663,680 |
| Size | 445.1 MB | 67.4 MB |
| Events in quadrant A | 3,382,574 | 432,307 |
| Events in quadrant B | 3,293,525 | 439,928 |
| Events in quadrant C | 3,614,109 | 432,987 |
| Events in quadrant D | 3,446,637 | 424,276 |
| Mode SS | |||
|---|---|---|---|
| Quadrant | BADHDUFLAG | Total packets | Discarded packets |
| A | 0 | 120 | 0 |
| B | 0 | 120 | 0 |
| C | 0 | 120 | 0 |
| D | 0 | 120 | 0 |
| Mode M9 | |||
|---|---|---|---|
| Quadrant | BADHDUFLAG | Total packets | Discarded packets |
| A | 0 | 13 | 0 |
| B | 0 | 13 | 0 |
| C | 0 | 13 | 0 |
| D | 0 | 13 | 0 |
| Mode M0 | |||
|---|---|---|---|
| Quadrant | BADHDUFLAG | Total packets | Discarded packets |
| A | 0 | 13592 | 2 |
| B | 0 | 13344 | 1 |
| C | 0 | 14627 | 1 |
| D | 0 | 13866 | 1 |
| Quadrant | Total seconds | Saturated seconds | Saturation percentage |
|---|---|---|---|
| A | 5867 | 97 | 1.653315% |
| B | 5867 | 54 | 0.920402% |
| C | 5867 | 92 | 1.568093% |
| D | 5867 | 79 | 1.346514% |
Noise dominated data is calculated using 1-second bins in cleaned event files. If a bin has >2000 counts, and if more than 50% of those come from <1% of pixels, then it is considered to be noise-dominated and hence unusable.
| Quadrant | # 1 sec bins | Bins with >0 counts | Bins with >2000 counts | High rate bins dominated by noise | Noise dominated (total time) | Noise dominated (detector-on time) | Marked lightcurve |
|---|---|---|---|---|---|---|---|
| A | 7133 | 5869 | 43 | 43 | 0.60% | 0.73% | 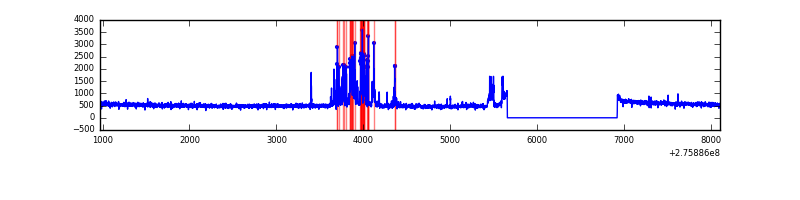 |
| B | 7133 | 5869 | 6 | 6 | 0.08% | 0.10% | 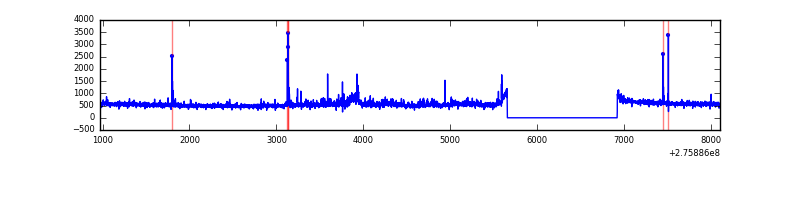 |
| C | 7133 | 5869 | 0 | 0 | 0.00% | 0.00% | 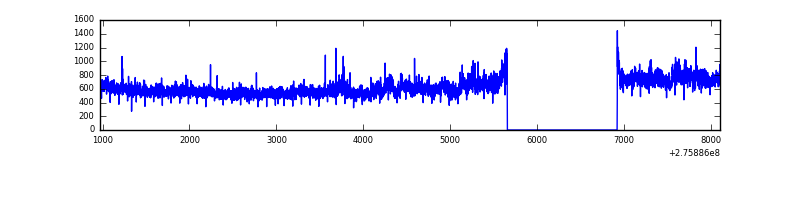 |
| D | 7133 | 5869 | 57 | 57 | 0.80% | 0.97% | 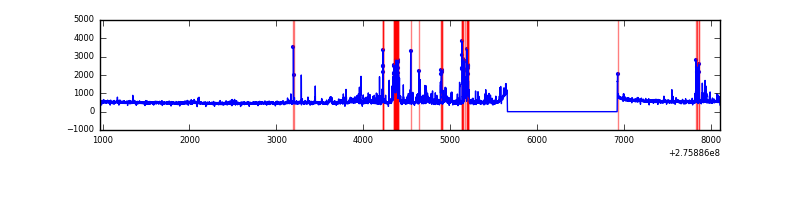 |
Top three noisy pixels from each quadrant. If the there are fewer than three noisy pixels in the level2.evt file, extra rows are filled as -1
| Pixel properties | Quadrant properties | ||||||
|---|---|---|---|---|---|---|---|
| Quadrant | DetID | PixID | Counts | Sigma | Mean | Median | Sigma |
| A | 15 | 174 | 390710 | 2498.42 | 777 | 765 | 156.1 |
| A | 0 | 226 | 6877 | 39.16 | 777 | 765 | 156.1 |
| A | 12 | 194 | 5739 | 31.87 | 777 | 765 | 156.1 |
| B | 4 | 216 | 51029 | 348.36 | 777 | 762 | 144.3 |
| B | 0 | 198 | 49988 | 341.14 | 777 | 762 | 144.3 |
| B | 0 | 219 | 40593 | 276.04 | 777 | 762 | 144.3 |
| C | 3 | 233 | 577663 | 3359.83 | 747 | 755 | 171.7 |
| C | 14 | 238 | 118446 | 685.42 | 747 | 755 | 171.7 |
| C | 13 | 61 | 5380 | 26.94 | 747 | 755 | 171.7 |
| D | 1 | 52 | 367387 | 2006.48 | 755 | 735 | 182.7 |
| D | 13 | 168 | 182397 | 994.14 | 755 | 735 | 182.7 |
| D | 2 | 234 | 21154 | 111.74 | 755 | 735 | 182.7 |
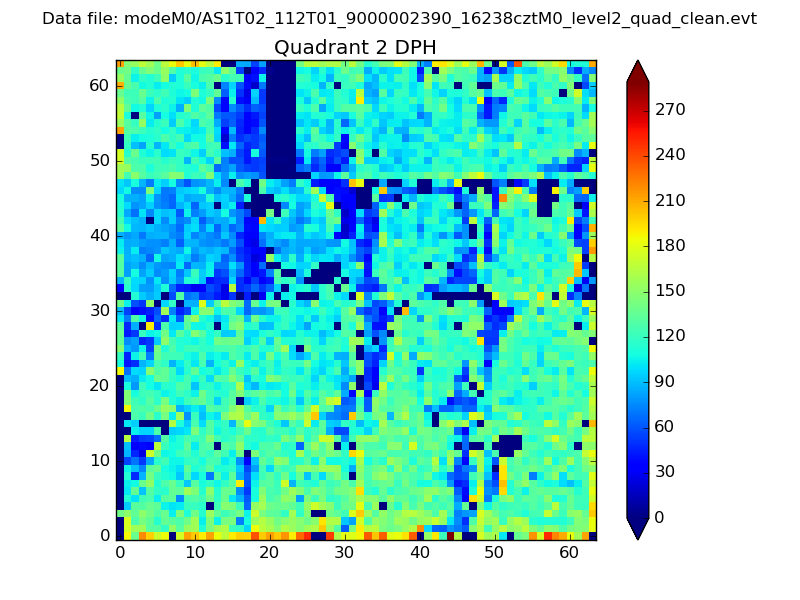
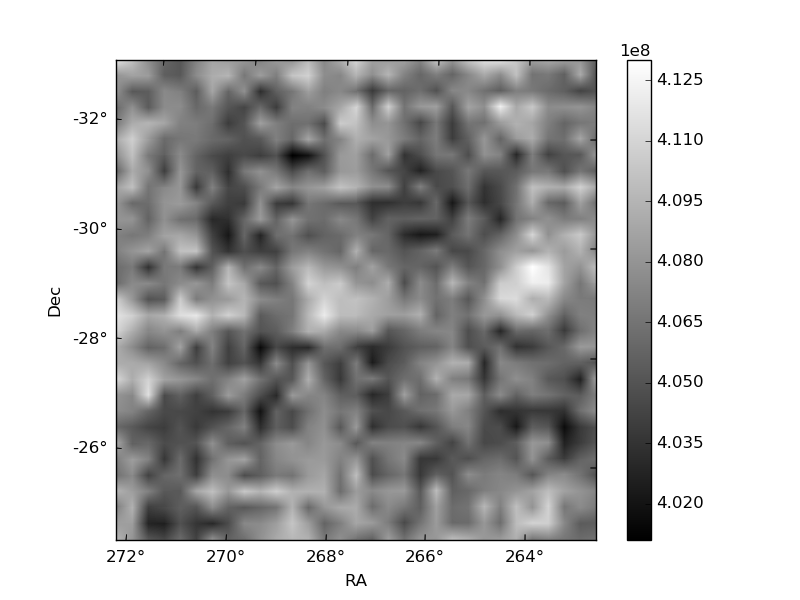
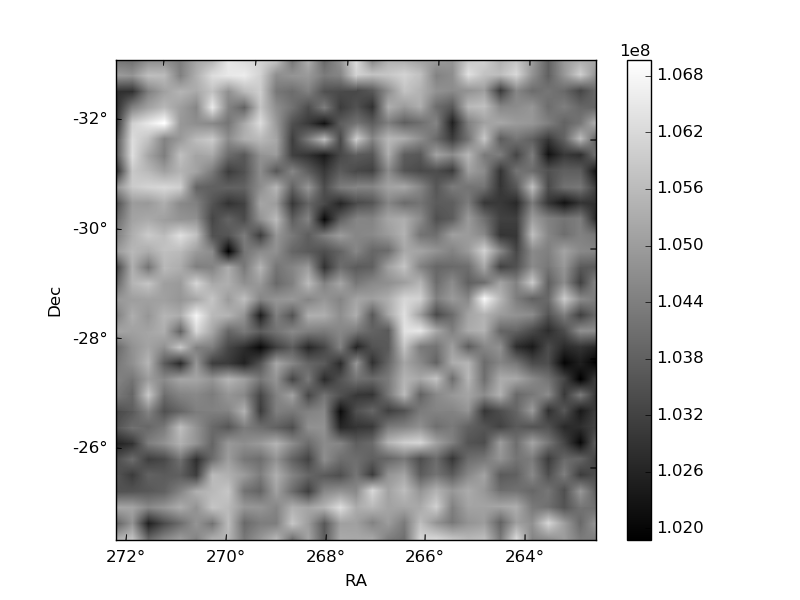
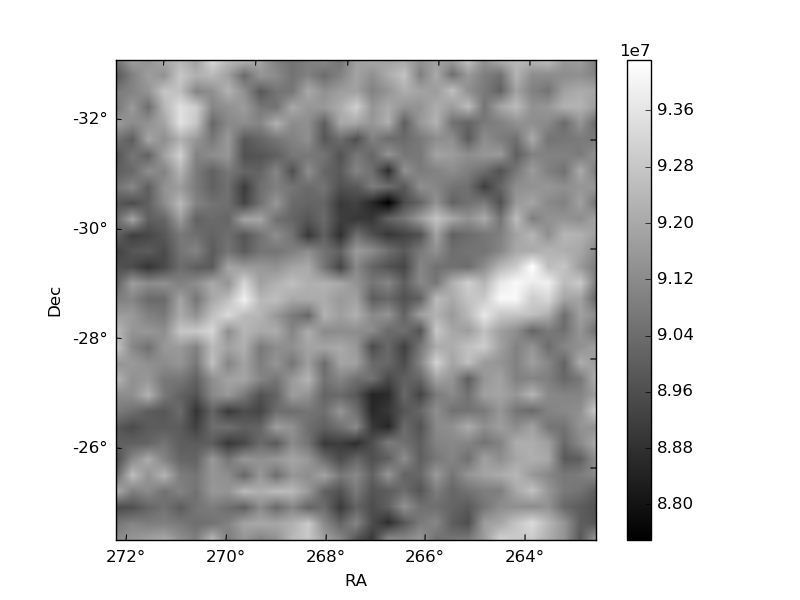
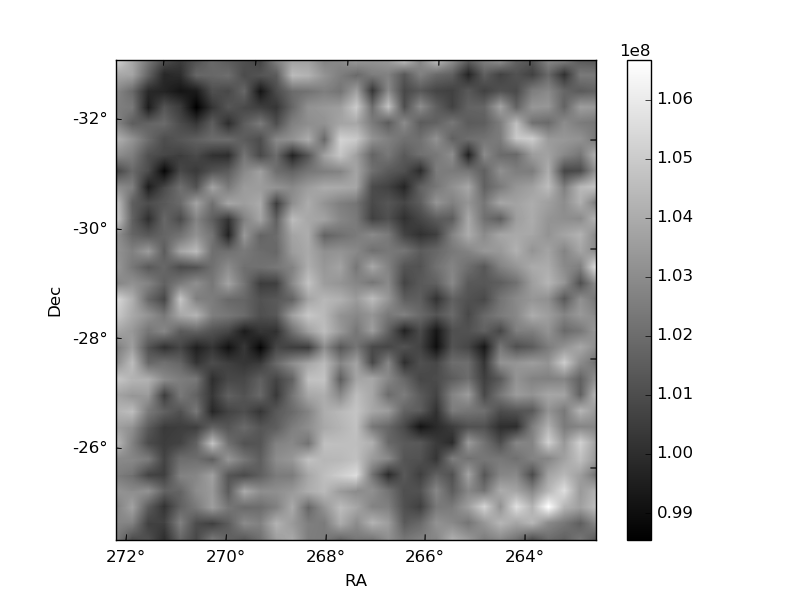
Histogram calculated using DETX and DETY for each event in the final _common_clean file
| Quadrant A | 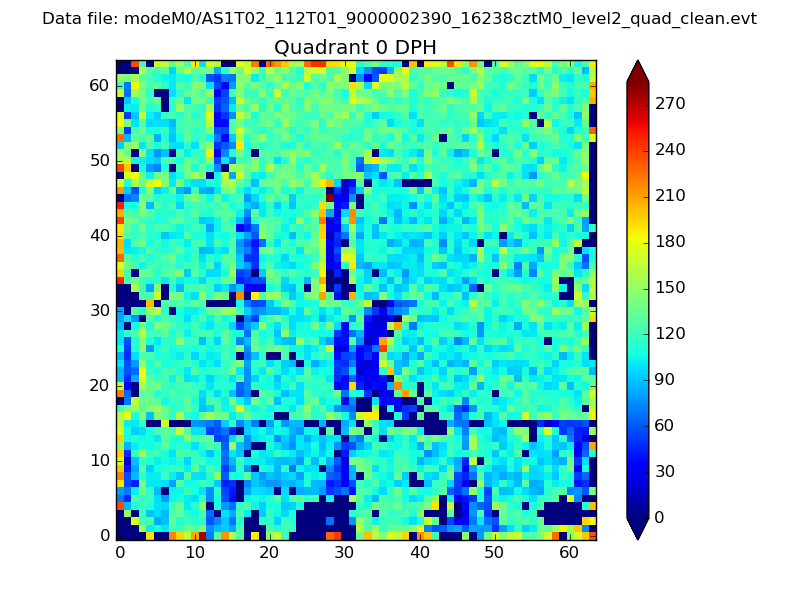 |
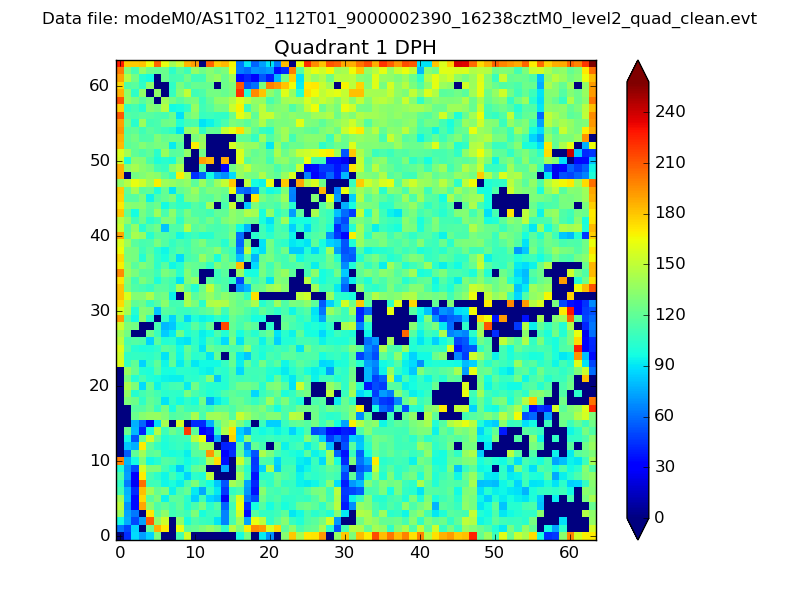 |
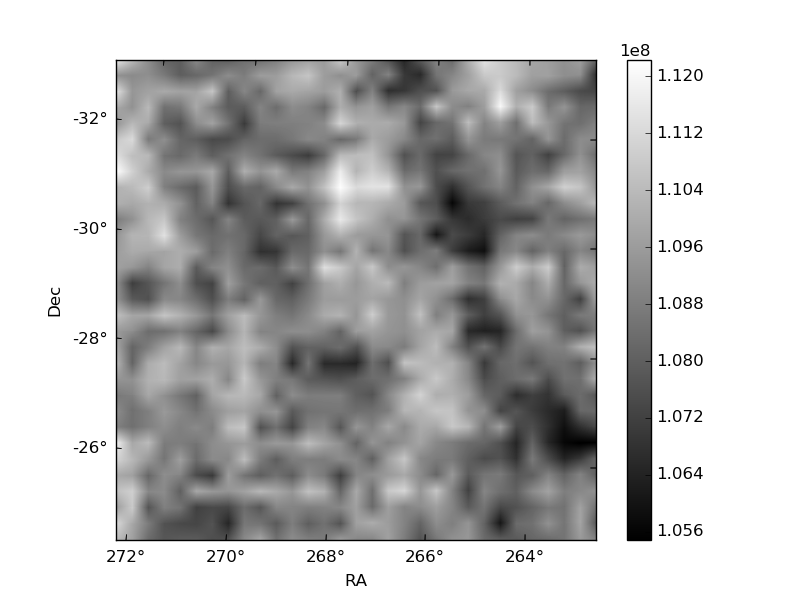
Quadrant B |
|---|---|---|---|
| Quadrant D | 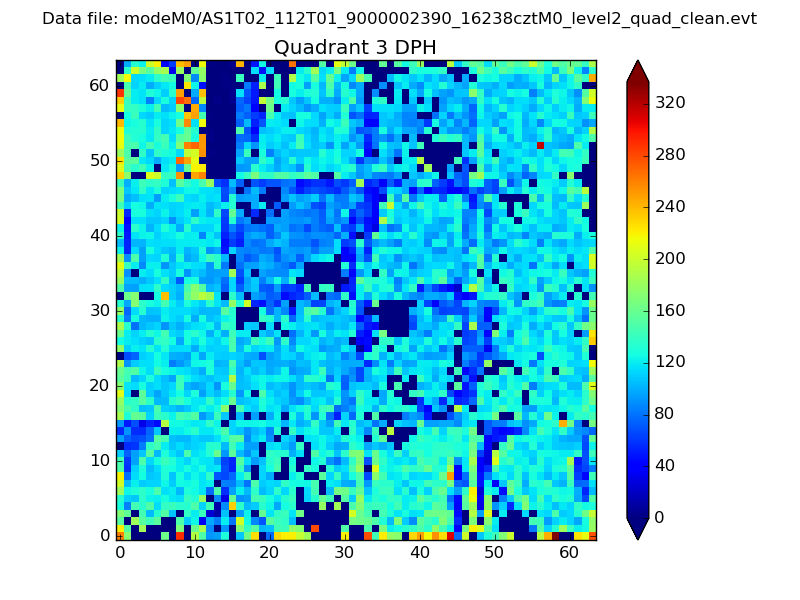 |
 |
Quadrant C |
| Plot type | Count rate plots | Images |
|---|---|---|
| Comparison with Poisson distribution Blue bars denote a histogram of data divided into 1 sec bins. Red curve is a Poisson curve with rate = median count rate of data. |
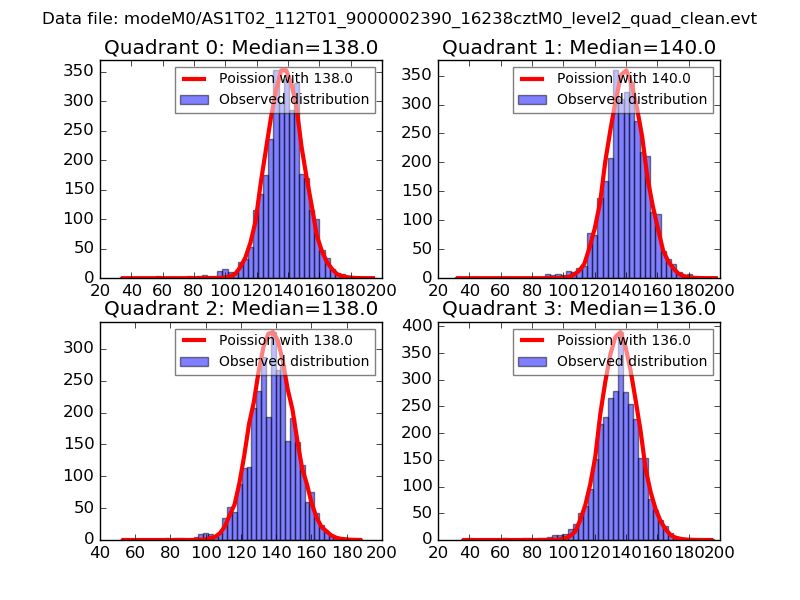 |
 |
| Quadrant-wise count rates Data is divided into 100 sec bins |
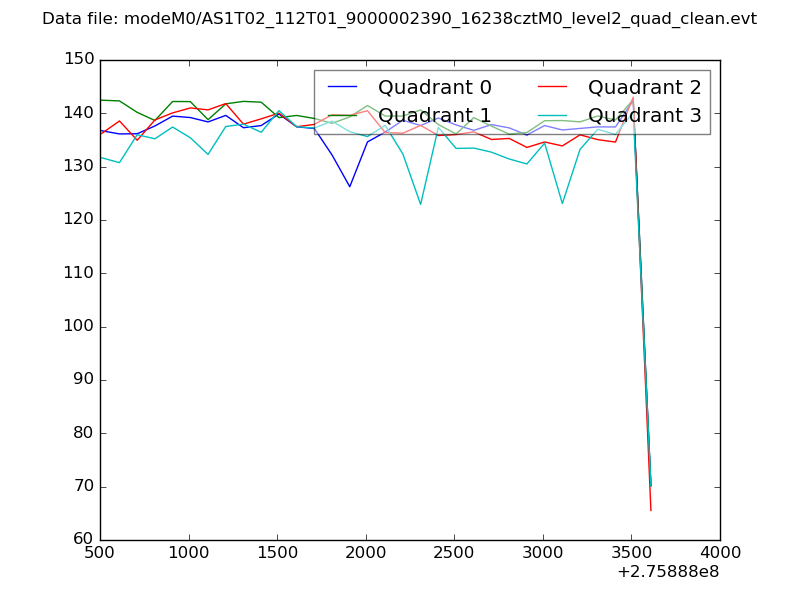 |
|
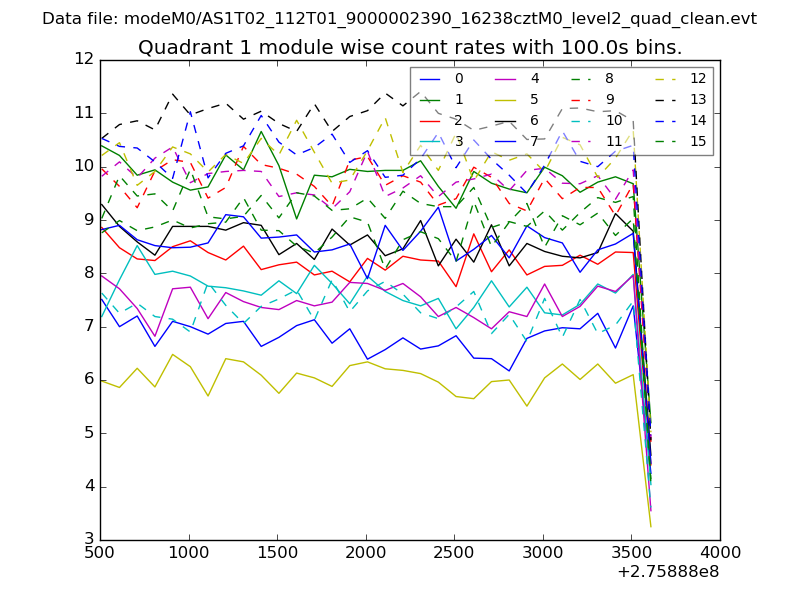
| Module-wise count rates for Quadrant A Data is divided into 100 sec bins |
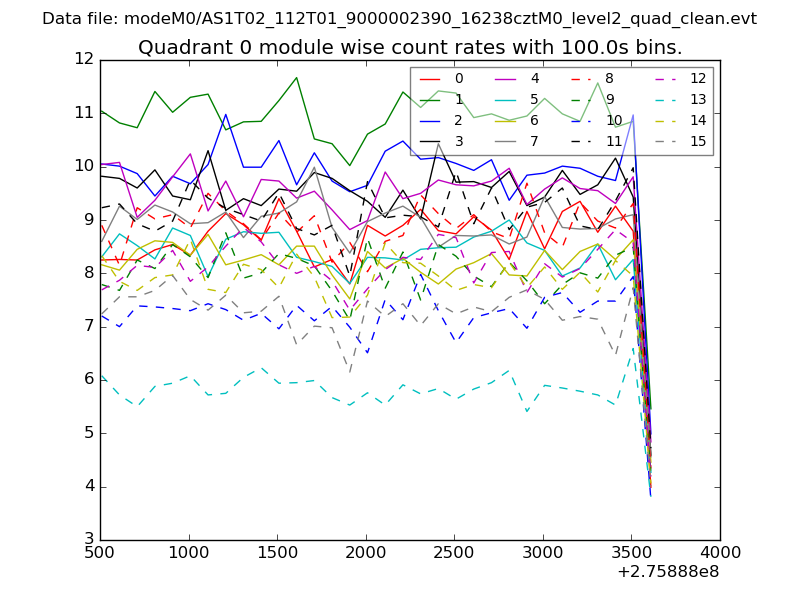 |
 |
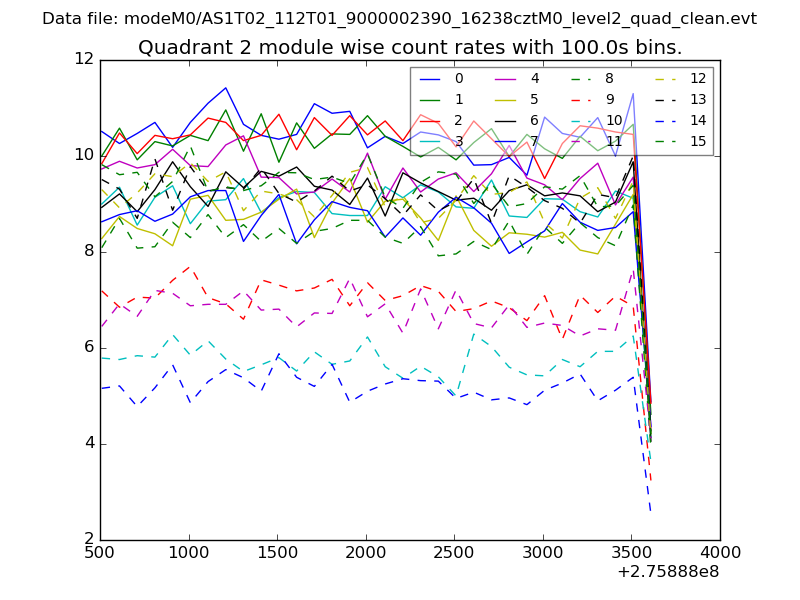
| Module-wise count rates for Quadrant B Data is divided into 100 sec bins |
 |
 |
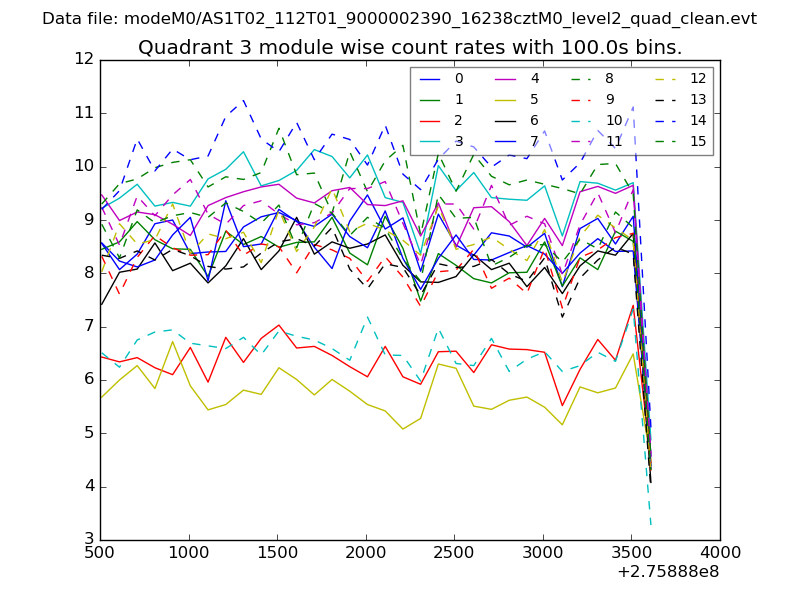
| Module-wise count rates for Quadrant C Data is divided into 100 sec bins |
 |
 |
| Module-wise count rates for Quadrant D Data is divided into 100 sec bins |
 |
 |
| Parameter | Plot |
|---|---|
| CZT HV Monitor | 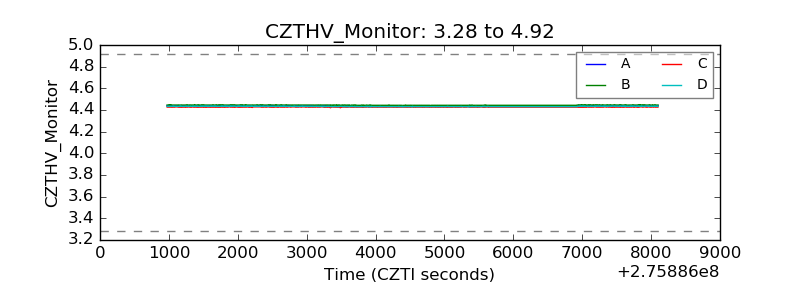 |
| D_VDD | 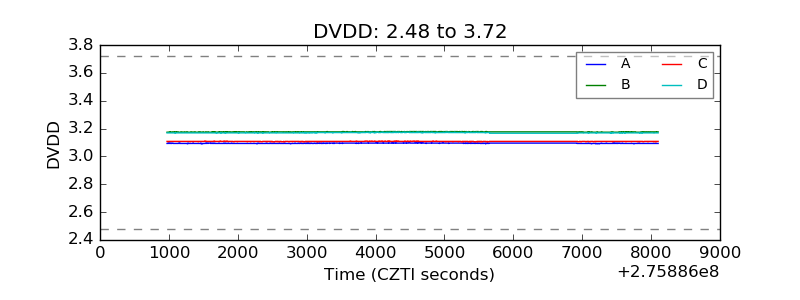 |
| Temperature 1 | 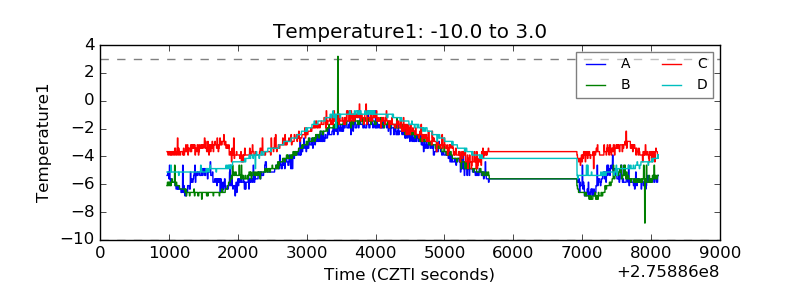 |
| Veto HV Monitor | 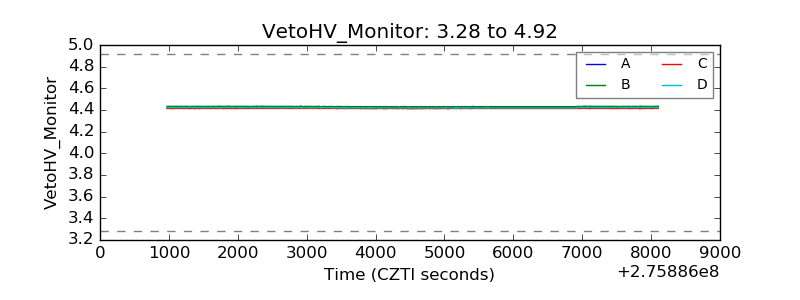 |
| Veto LLD | 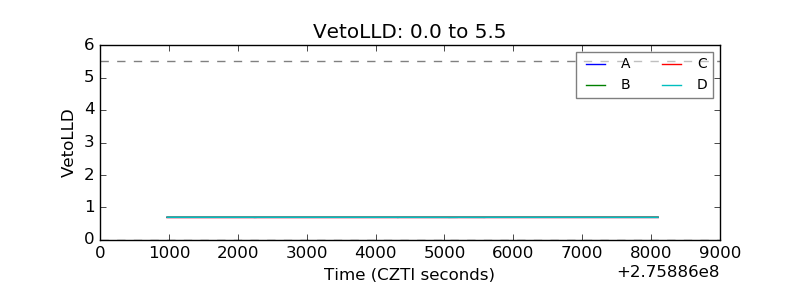 |
| Alpha Counter | 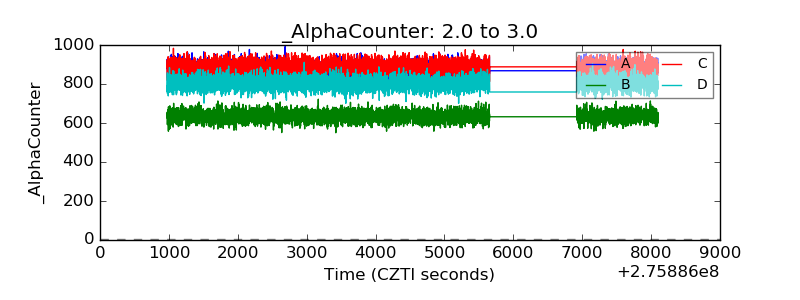 |
| _CPM_Rate | 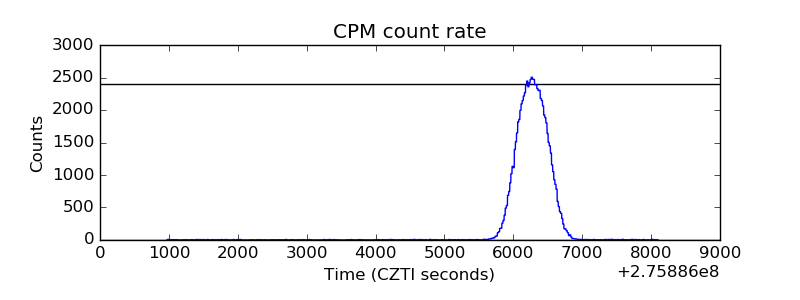 |
| CZT Counter | 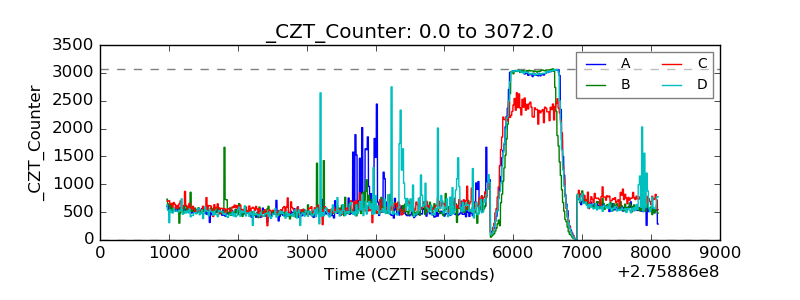 |
| +2.5 Volts monitor |  |
| +5 Volts monitor |  |
| _ROLL_ROT | 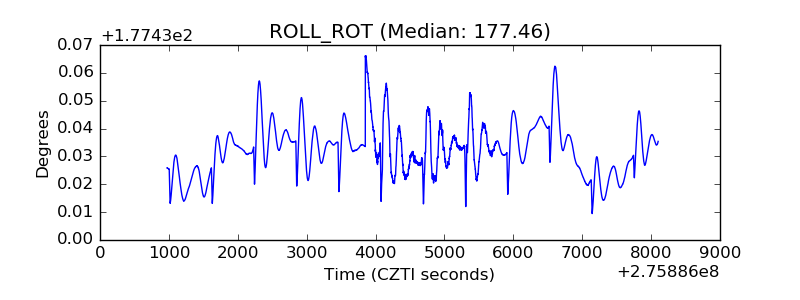 |
| _Roll_DEC | 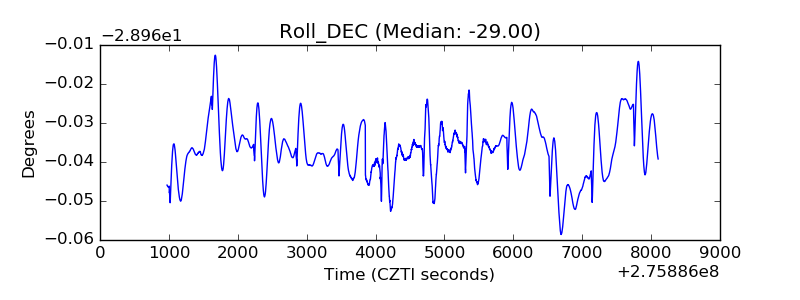 |
| _Roll_RA | 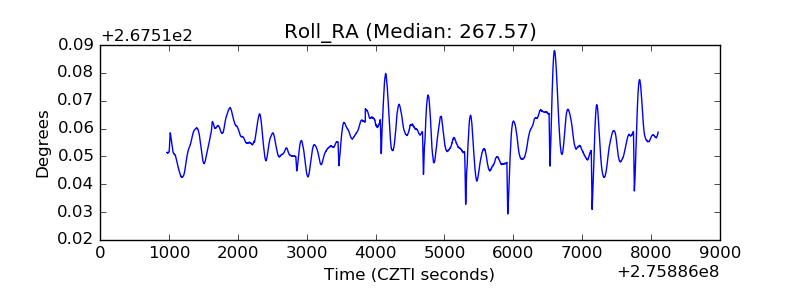 |
| Veto Counter | 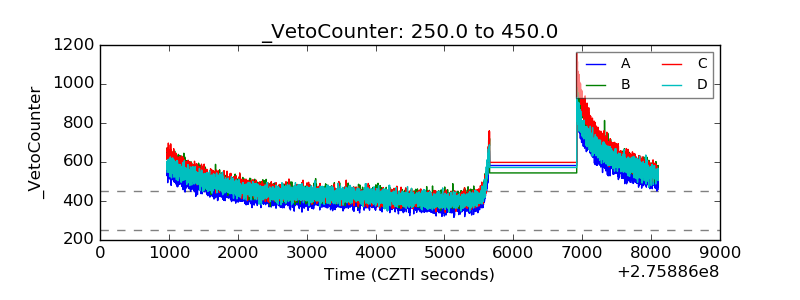 |